
In the world of finance, the word “leverage” carries a weight that can signal either explosive growth or impending ruin. At its core, leverage is the use of borrowed capital to increase the potential return of an investment or to scale business operations. However, because debt must be repaid regardless of a project’s success, it introduces a layer of risk that must be meticulously managed. This is where the leverage ratio becomes an indispensable tool for investors, creditors, and business owners alike.
A leverage ratio is a financial metric that evaluates how much of a company’s capital comes from debt versus equity. It provides a snapshot of a firm’s financial health by measuring its ability to meet its long-term financial obligations. Understanding these ratios is not just an academic exercise; it is a fundamental requirement for anyone looking to navigate the complexities of corporate finance, stock market investing, or business management.

1. The Core Categories of Leverage Ratios
To understand a company’s financial standing, one must look beyond the surface level of its revenue. Leverage ratios peel back the layers of a balance sheet to show how a business is funded. Generally, these ratios fall into several distinct categories, each offering a different perspective on debt and risk.
Debt-to-Equity (D/E) Ratio
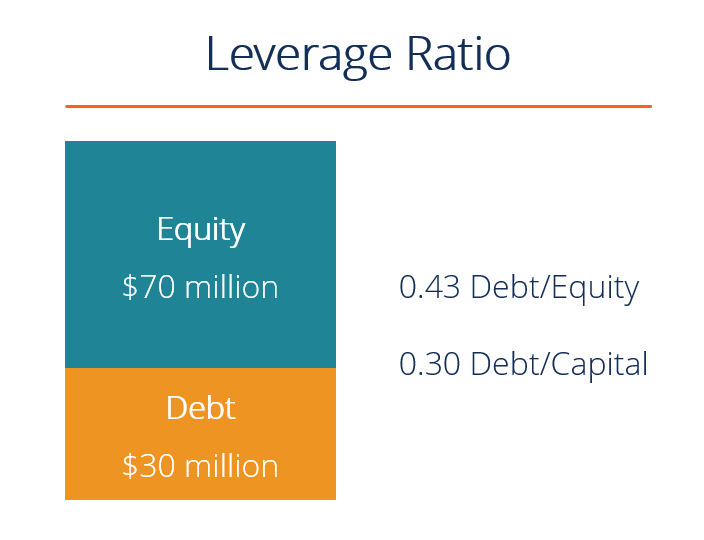
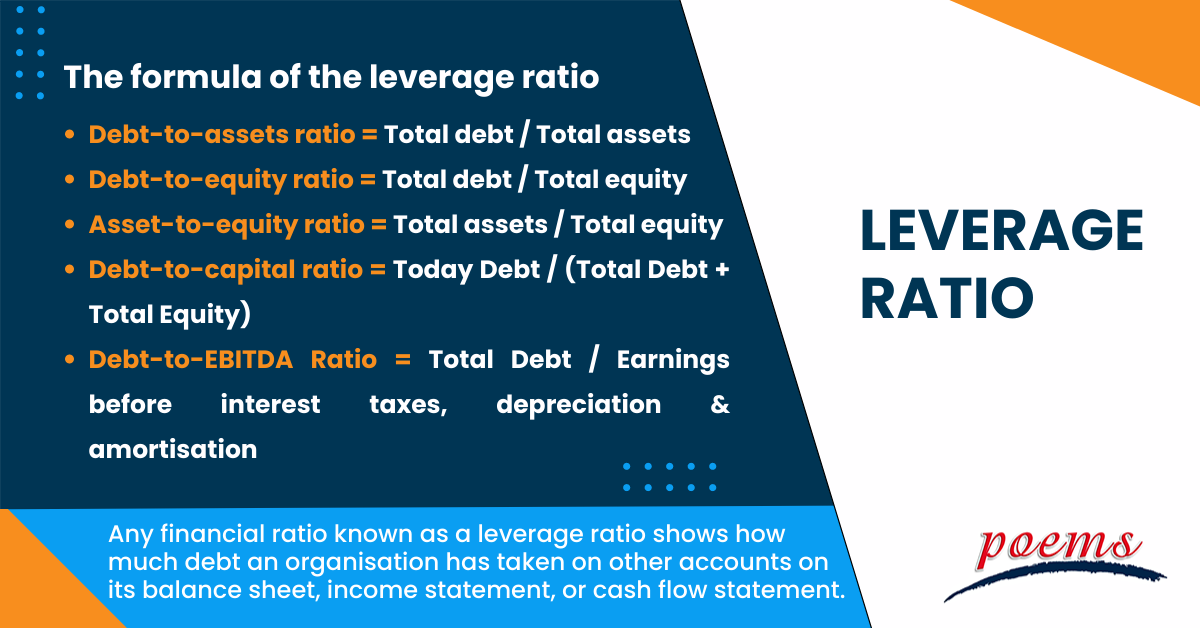
The Debt-to-Equity ratio is perhaps the most widely recognized leverage metric. It is calculated by dividing a company’s total liabilities by its shareholder equity. This ratio indicates the proportion of equity and debt the company is using to finance its assets. A high D/E ratio suggests that a company has been aggressive in financing its growth with debt, which can result in volatile earnings as a result of the additional interest expense. Conversely, a low ratio often indicates a more conservative approach with a stronger reliance on internal funding.
The Debt-to-Assets Ratio
While the D/E ratio compares debt to ownership, the Debt-to-Assets ratio compares total liabilities to total assets. This tells us what percentage of a company’s assets are financed by creditors rather than owners. If a company has a debt-to-asset ratio of 0.6, it means that 60% of its assets are financed by debt. This is a critical metric for assessing solvency; if the ratio is greater than 1.0, the company has more debt than assets, which is a significant red flag for potential bankruptcy.
Interest Coverage Ratio
Leverage isn’t just about how much you owe; it’s about your ability to pay for it. The Interest Coverage Ratio (also known as “times interest earned”) measures how easily a company can pay interest on its outstanding debt with its current earnings. It is calculated by dividing earnings before interest and taxes (EBIT) by the interest expense. A higher ratio indicates that the company is comfortably generating enough profit to cover its interest obligations, while a low ratio suggests the company is “debt-burdened.”
2. Why Leverage Ratios are Critical for Business Finance
In the realm of business finance, leverage is a strategic tool. When used correctly, it allows a company to undertake projects that it otherwise could not afford, potentially leading to higher returns for shareholders. However, the margin for error narrows as leverage increases.
Assessing Solvency and Long-term Risk
Solvency refers to a company’s ability to meet its long-term debts and financial obligations. Unlike liquidity, which focuses on short-term cash flow, solvency is about the “big picture” of the company’s survival. Leverage ratios are the primary indicators of solvency. High leverage makes a company vulnerable to economic downturns. If revenue dips, the fixed costs of debt (interest payments) do not disappear. A highly leveraged company may find itself unable to pay creditors, leading to restructuring or liquidation.
Influencing Capital Structure Strategy
A company’s capital structure is the specific mix of debt and equity it uses to finance its overall operations and growth. Financial managers use leverage ratios to determine the “Optimal Capital Structure”—the point at which the cost of capital is minimized and the value of the firm is maximized. Debt is often “cheaper” than equity because interest payments are tax-deductible. However, as the leverage ratio rises, the risk of default increases, causing lenders to demand higher interest rates and investors to demand higher returns, thus increasing the cost of capital.
Impact on Creditworthiness and Borrowing Power
For a business, a leverage ratio is like a credit score. Banks and bondholders use these ratios to decide whether to lend money and what interest rate to charge. A company with a healthy, industry-standard leverage ratio will find it easier to secure favorable loan terms. On the other hand, if ratios indicate excessive debt, a company may be “covenanted”—restricted by lenders from taking on more debt or paying dividends until the ratios improve.
3. The Investor’s Perspective: Using Leverage Ratios to Evaluate Stocks
For the individual investor, leverage ratios serve as a “stress test” for potential investments. In a bull market, high leverage can make a company look like a superstar because debt can amplify Return on Equity (ROE). However, in a bear market, those same companies are often the first to fail.
Sector-Specific Benchmarks
It is a mistake to view leverage ratios in a vacuum. What constitutes a “good” ratio varies wildly across different industries. For example, capital-intensive industries like utilities, telecommunications, and manufacturing often carry high leverage ratios because they have stable cash flows and significant physical assets to use as collateral. In contrast, technology or service-based companies typically maintain lower leverage ratios because their primary assets are intellectual property and human capital, which are less effective as collateral.
The Double-Edged Sword of Financial Leverage
Investors use leverage ratios to identify the “magnification effect.” When a company earns more on the assets purchased with borrowed money than the interest it pays on that debt, the “extra” profit belongs to the shareholders. This increases the Return on Equity significantly. However, if the return on assets is lower than the interest rate, the shareholders must “subsidize” the debt payment, which can rapidly erode equity value. By analyzing leverage ratios over several quarters, investors can see if a company is using debt to grow efficiently or if it is simply digging a deeper hole.
Identifying “Value Traps”
Sometimes, a stock looks cheap based on its Price-to-Earnings (P/E) ratio, but a quick look at its leverage ratios reveals why. If a company is trading at a low multiple but has a skyrocketing Debt-to-Equity ratio, the market may be pricing in the risk of a future liquidity crisis. Distinguishing between a “undervalued gem” and a “debt-laden sinking ship” is a primary skill of successful value investors, and leverage ratios are the tools they use to make that distinction.
4. How to Calculate and Interpret Ratios in Real-World Scenarios
Understanding the theory is the first step, but applying these metrics to real financial statements is where the real insight happens. To calculate these ratios, one needs the Balance Sheet and the Income Statement.
A Step-by-Step Calculation Example
Imagine a hypothetical company, “Global Tech Corp.”
- Total Liabilities: $500,000
- Total Shareholder Equity: $250,000
- Total Assets: $750,000
- EBIT (Annual): $100,000
- Interest Expense: $20,000
- Debt-to-Equity: $500,000 / $250,000 = 2.0. For every dollar of equity, the company has two dollars of debt.
- Debt-to-Assets: $500,000 / $750,000 = 0.66. 66% of the company’s assets are financed by debt.
- Interest Coverage: $100,000 / $20,000 = 5.0. The company can pay its interest obligations five times over with its current earnings.
What is a “Good” Leverage Ratio?
Generally, a Debt-to-Equity ratio of 1.0 to 1.5 is considered average for many industries, while anything over 2.0 is seen as risky. For the Interest Coverage Ratio, a result below 1.5 is usually a cause for concern, as it leaves very little room for error if earnings fluctuate. However, the most important part of interpretation is the trend. Is the leverage ratio increasing or decreasing over time? A company that is actively “deleveraging” (paying down debt) is often viewed positively by the market, as it reduces risk and improves the balance sheet for future opportunities.
Conclusion: The Strategic Role of Leverage in Wealth Building
Leverage is neither inherently good nor bad; it is a financial tool that amplifies outcomes. In the context of business finance and investing, leverage ratios are the gauges that tell us if the engine is running efficiently or if it is at risk of overheating.
For the business owner, maintaining a balanced leverage ratio ensures that the company remains agile, capable of weathering economic storms while retaining the power to seize growth opportunities. For the investor, these ratios provide a layer of protection, helping to filter out businesses that are taking unnecessary risks with shareholder capital.
In an era of fluctuating interest rates and global economic uncertainty, the ability to analyze and interpret leverage ratios is more than a technical skill—it is a fundamental pillar of financial literacy. By mastering these metrics, you gain a deeper understanding of the mechanics of money, allowing you to make informed, strategic decisions that lead to long-term financial stability and success.
aViewFromTheCave is a participant in the Amazon Services LLC Associates Program, an affiliate advertising program designed to provide a means for sites to earn advertising fees by advertising and linking to Amazon.com. Amazon, the Amazon logo, AmazonSupply, and the AmazonSupply logo are trademarks of Amazon.com, Inc. or its affiliates. As an Amazon Associate we earn affiliate commissions from qualifying purchases.