In the world of finance, whether you are managing a multinational corporation, a small business, or a personal investment portfolio, data is the compass that guides your decisions. However, not all data is created equal. To navigate the complexities of the financial landscape, one must distinguish between information that predicts the future and information that confirms the past. This is where the concept of the lag indicator becomes essential.
A lag indicator is a measurable fact that records the actual performance of a business or investment after the events have occurred. If a leading indicator is the windshield that shows you what is coming down the road, a lag indicator is the rearview mirror. While it cannot tell you where you are going, it is the only way to verify where you have been and whether your previous strategies were successful. In this article, we will explore the depth of lag indicators within the “Money” niche—covering business finance, personal investing, and economic trends—to understand how hindsight provides the foundation for future wealth.
1. Defining Lag Indicators in the Financial Landscape
To master financial management, one must first understand the fundamental nature of a lag indicator. In technical terms, it is a “post-hoc” metric. It follows an event and provides a definitive confirmation of a pattern or a result. Because lag indicators are based on hard data from completed transactions or periods, they are incredibly accurate, though they lack predictive power on their own.
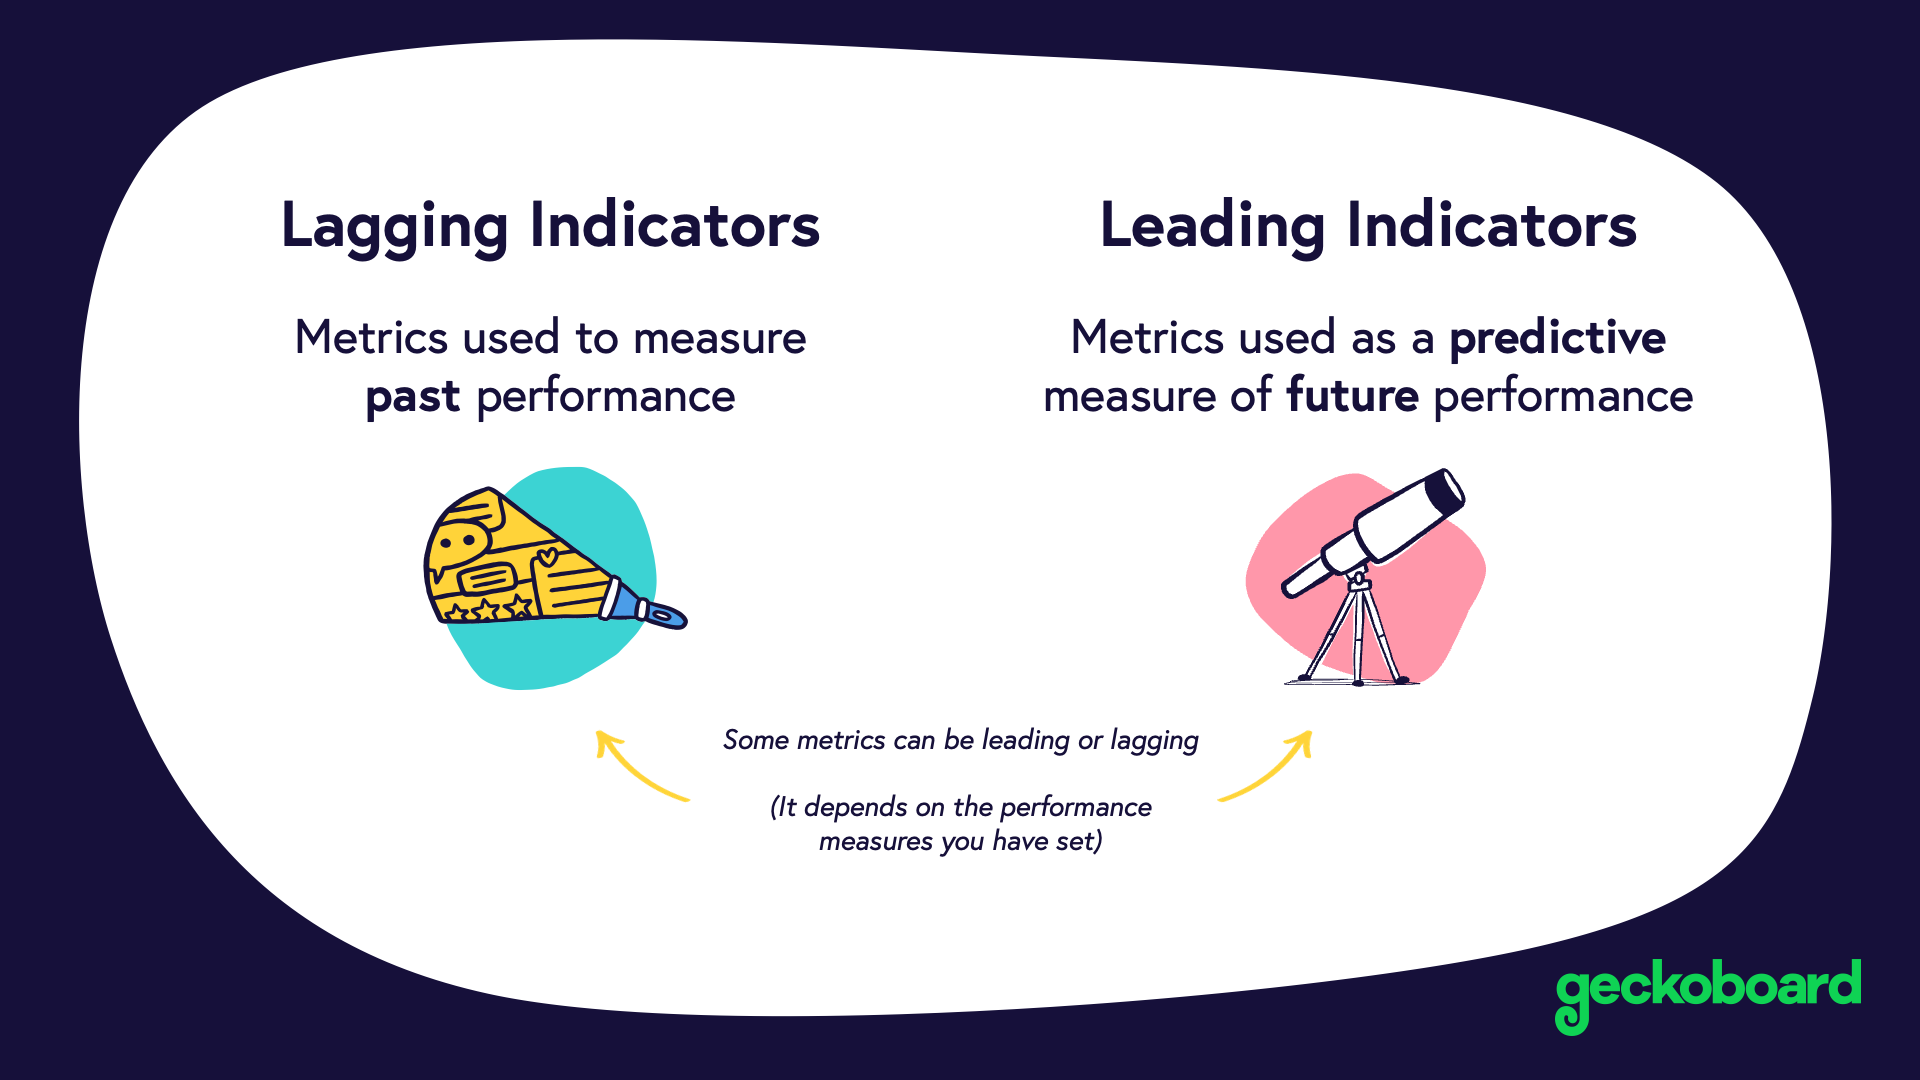
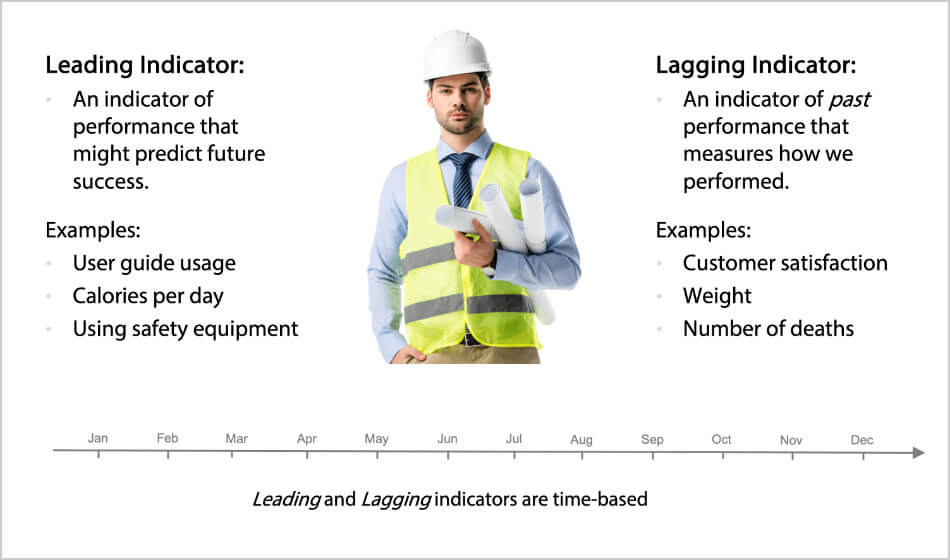
The Distinction Between Leading and Lagging Indicators
The easiest way to understand a lag indicator is to contrast it with its counterpart: the leading indicator. In business finance, a leading indicator might be “sales inquiries” or “website traffic.” These suggest that revenue might increase in the future. Conversely, a lag indicator is “monthly revenue.” You cannot calculate revenue until the sales have been finalized and the month has closed.
In personal finance, a leading indicator of wealth might be your “savings rate” or “monthly budget adherence.” These are actions you take today that suggest a future outcome. The lag indicator is your “Net Worth” at the end of the year. It is the final score of your financial habits over the preceding twelve months.
Why Hindsight is Essential for Business Growth
It is a common mistake for novice investors and entrepreneurs to dismiss lag indicators as “old news.” However, without lag indicators, there is no accountability. They serve as the “grade card” for any financial strategy. For instance, a company might launch an expensive marketing campaign (a leading action), but they won’t know if the campaign was actually profitable until they look at the lag indicators: Net Profit Margin and Customer Acquisition Cost (CAC).
Lagging indicators provide the “ground truth” that prevents financial leaders from being misled by optimistic projections. They validate or invalidate your financial models, allowing for a cycle of continuous improvement.
2. Key Lagging Indicators for Corporate and Business Finance
For any business, from a solo freelance operation to a Fortune 500 company, certain lagging indicators are non-negotiable. These metrics appear on balance sheets and income statements, providing stakeholders with a clear picture of the company’s health.
Net Profit and Revenue Growth
Revenue is perhaps the most fundamental lag indicator in existence. It tells you exactly how much money flowed into the business during a specific period. While revenue shows the scale of a business, Net Profit shows its efficiency. A business could have record-breaking revenue (a lag indicator) but still be failing if its expenses outpaced that growth. Therefore, analyzing the “Bottom Line” is the ultimate way to confirm if a business model is sustainable.
Return on Investment (ROI) and Equity
ROI is a critical lag indicator used to evaluate the efficiency of an investment or to compare the efficiencies of several different investments. Whether a business is investing in new machinery, a software upgrade, or a new hire, the ROI can only be calculated after the investment has had time to produce a result.
Similarly, Return on Equity (ROE) measures a corporation’s profitability in relation to stockholders’ equity. Because it relies on Net Income and Shareholder Equity from previous reporting periods, it is a lagging metric that tells investors how effectively the management is using the company’s assets to create profit.
Debt-to-Equity Ratios and Solvency
In the realm of business finance, how you fund your growth is as important as the growth itself. The Debt-to-Equity (D/E) ratio is a lagging indicator that reflects the financial leverage of a company. It is calculated by dividing total liabilities by shareholder equity. Since these figures are pulled from the most recent balance sheet, they represent the cumulative result of all past borrowing and repayment decisions. A rising D/E ratio over several quarters serves as a lagging warning sign that a company may be over-leveraged.
3. The Role of Lagging Indicators in Investment Strategy
For the individual investor or the institutional fund manager, lag indicators are used to confirm trends and filter out market “noise.” While everyone wants to find the next “leading” signal to buy a stock before it rockets, seasoned investors know that lagging indicators provide the safety and confirmation needed for long-term wealth accumulation.
Technical Analysis: Moving Averages and Trend Confirmation
In the stock market, many technical analysts use “Moving Averages” (MA) as their primary lag indicator. A 200-day moving average, for example, takes the closing prices of the last 200 days and averages them. Because it uses past data, the line on the chart will always “lag” behind the current price.
However, its value is immense: it smooths out daily volatility to reveal the long-term trend. If the current price is consistently above the 200-day MA, it confirms a bullish trend. Investors use this lagging information to ensure they are not “fighting the trend,” which is a key principle in risk management.
Economic Lagging Indicators: Unemployment and GDP
On a macroeconomic level, governments and central banks look at lagging indicators to determine interest rate policies.
- Gross Domestic Product (GDP): GDP is the ultimate lagging indicator of economic health. It is reported after a quarter ends. When we hear that the economy grew by 2%, we are looking at a snapshot of the past.
- Unemployment Rate: Surprisingly, unemployment is a lagging indicator. Businesses usually wait until the economy is firmly in a recession before they begin mass layoffs, and they wait until a recovery is well underway before they start hiring again.
Investors track these lagging metrics to understand where we are in the “Economic Cycle.” Knowing that we are officially in a period of growth (confirmed by GDP) allows investors to shift their portfolios into more aggressive, growth-oriented assets.
4. How to Balance Lagging Indicators with Proactive Financial Planning
The danger of focusing solely on lag indicators is “analysis paralysis” or “reactive management.” If you only look at the rearview mirror, you will eventually crash. The key to financial mastery is the “Feedback Loop”—using lagging indicators to inform your future leading indicators.
Avoiding the “Mirror-Only” Management Trap
In personal finance, if you only look at your bank balance (a lag indicator) at the end of the month, you might realize you spent too much, but you can’t change the outcome. To balance this, you must use that lagging information to set a “Leading” behavior: a strict weekly budget or an automated savings transfer.
In a corporate setting, if a company notices that its “Employee Turnover Rate” (a lag indicator) was high last year, it must implement “Leading” changes, such as improved training programs or better benefits, to influence the future results.
Using Past Data to Predict Future Performance
While lag indicators tell you what happened, they also provide the “baseline” for forecasting. In business finance, “Historical Trend Analysis” involves looking at five years of lagging data to project the next three years of growth. This is the basis of financial modeling. By identifying the average growth rate and seasonal fluctuations in past revenue, a business owner can create a more accurate budget for the coming year.
In the world of online income and side hustles, a creator might look at their “Earnings per 1,000 views” (a lag indicator) over the last six months to decide which types of content are worth investing time into for the next quarter. The past data proves what the market values, allowing the creator to double down on what works.
Conclusion: The Value of the Final Score
A lag indicator is more than just a historical record; it is the ultimate truth in the world of money. In an industry often clouded by speculation, hype, and “get rich quick” promises, lag indicators provide the grounding reality of actual performance. They represent the dividends paid, the profits earned, and the growth achieved.
To succeed financially, you must respect the lag indicator. Use it to validate your theories, to measure your progress against your peers, and to identify when a change in strategy is required. By mastering the balance between the proactive actions of today and the analytical reflections of yesterday’s results, you can build a robust, evidence-based path toward financial independence and business excellence. In the end, while leading indicators give you hope, it is the lag indicators that give you wealth.
aViewFromTheCave is a participant in the Amazon Services LLC Associates Program, an affiliate advertising program designed to provide a means for sites to earn advertising fees by advertising and linking to Amazon.com. Amazon, the Amazon logo, AmazonSupply, and the AmazonSupply logo are trademarks of Amazon.com, Inc. or its affiliates. As an Amazon Associate we earn affiliate commissions from qualifying purchases.