In the modern landscape of digital productivity, data is no longer just a record of the past; it is a blueprint for the future. For professionals, developers, and analysts, the ability to project outcomes based on varying inputs is a critical skill. This is where “What-If Analysis” becomes indispensable. Within the Google Sheets ecosystem, What-If Analysis refers to the process of changing values in cells to see how those changes affect the outcome of formulas on the worksheet.
As businesses migrate toward cloud-native collaborative environments, Google Sheets has evolved from a simple spreadsheet tool into a robust platform for complex modeling. This guide explores the technical frameworks, built-in tools, and strategic methodologies required to master What-If Analysis in Google Sheets, enabling you to transform static data into dynamic, predictive intelligence.

Understanding the Core Logic of What-If Analysis
At its heart, What-If Analysis is a mathematical experiment. By isolating specific variables and adjusting them within a controlled environment, you can observe the ripple effects across your entire data model. In the realm of technology and software, this is often referred to as sensitivity analysis or scenario modeling.
Sensitivity Analysis vs. Scenario Planning
While often used interchangeably, these two concepts represent different technical approaches. Sensitivity analysis focuses on how the uncertainty in the output of a mathematical model or system can be apportioned to different sources of uncertainty in its inputs. In Google Sheets, this usually involves changing one variable at a time (e.g., “If our conversion rate increases by 1%, how does it impact total revenue?”).
Scenario planning, conversely, involves changing multiple variables simultaneously to reflect a specific set of circumstances. For instance, a “Best Case Scenario” might involve high user growth and low churn, while a “Worst Case Scenario” models low growth and high operational costs. Google Sheets provides the logical framework to build these multi-dimensional models through its advanced formula engine.
The Role of Variables and Parameters
To build a functional What-If model, you must distinguish between your input variables (the levers you can pull) and your output parameters (the results you are monitoring). A well-structured spreadsheet separates these clearly. Input variables should be housed in dedicated cells, often color-coded, so that the underlying formulas remain untouched while the user experiments with different data points. This technical modularity is the hallmark of a professional-grade analytical tool.
Essential Google Sheets Tools for What-If Modeling
Google Sheets offers several specialized features designed specifically for predictive modeling. Unlike traditional data entry, these tools automate the iteration process, allowing you to find the exact inputs needed to reach a desired outcome.
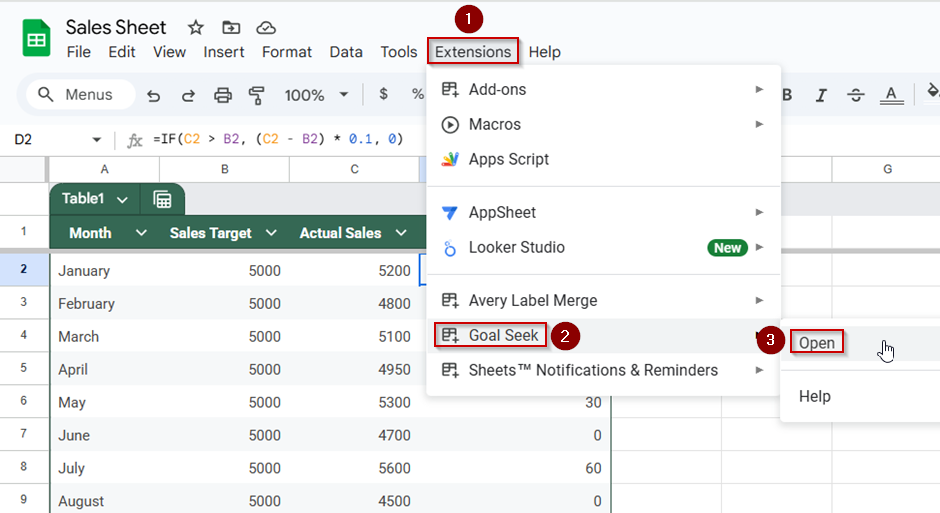
Utilizing Goal Seek for Reverse Engineering Results
Goal Seek is perhaps the most powerful “What-If” tool for single-variable problems. It works by looking for a specific result for one cell by adjusting the value of another cell. While Excel has this built-in, Google Sheets users typically access this through the “Goal Seek” add-on (provided by Google) or through custom Apps Script.
Technically, Goal Seek uses an iterative approach to converge on a solution. If you know the target—for example, you want a project’s net profit to be exactly $50,000—Goal Seek will automatically cycle through input values for “Total Units Sold” until it finds the number that achieves that profit. This is vital for tech project management and capacity planning, where resource allocation must be precision-tuned to meet fixed milestones.
Building Dynamic Data Tables for Multi-Variable Analysis
A Data Table is a range of cells that shows how changing one or two variables in your formulas will affect the results of those formulas. While Google Sheets does not have a “Data Table” button identical to Excel’s, the same effect is achieved using the ARRAYFORMULA function or the SEQUENCE function.
By creating a grid where the X-axis represents one variable (e.g., Price) and the Y-axis represents another (e.g., Volume), you can populate the intersections with calculated results. This visual matrix allows a stakeholder to see hundreds of possible outcomes at a single glance. From a technical perspective, using ARRAYFORMULA is more efficient than manual copying because it reduces the computational overhead on the browser, ensuring the spreadsheet remains responsive even with large datasets.
Managing Alternatives with Data Validation and Protected Ranges
To facilitate professional scenario switching, Google Sheets’ “Data Validation” tool is essential. By creating a dropdown menu that allows a user to select between “Scenario A,” “Scenario B,” and “Scenario C,” you can use the SWITCH or VLOOKUP functions to update the entire model instantly.
To ensure the integrity of the analysis, “Protected Ranges” should be used. This prevents collaborators from accidentally overwriting the complex logic of the What-If formulas while still allowing them to toggle the input variables. This balance of flexibility and security is a core component of digital workspace management.
Advanced Techniques: Formulas and Scripts

For those looking to push Google Sheets beyond its standard capabilities, advanced logic and scripting offer a pathway to truly automated What-If Analysis.
Leveraging the Power of IF, IFS, and SWITCH
The foundation of any What-If model is conditional logic. The IF function allows for simple binary branching, but for sophisticated modeling, IFS and SWITCH are more efficient.
- IFS: Allows you to test multiple conditions in a single formula. For a tech startup modeling growth, an
IFSformula can apply different growth multipliers based on which “Tier” of venture funding is selected. - SWITCH: Is technically cleaner when you are comparing a single expression against a list of possible values. It is ideal for scenario managers where a user selects a “Case” (Base, Bull, or Bear), and the formula returns the corresponding data set.
Using these functions reduces the need for “nested IFs,” which are notoriously difficult to debug and slow down sheet performance.
Automating Scenarios with Google Apps Script
When standard formulas aren’t enough, Google Apps Script (a JavaScript-based platform) allows you to build custom What-If engines. You can write a script that automatically iterates through a range of values, records the results, and generates a summary report.
For example, if you are performing a stress test on a cloud infrastructure budget, a script can simulate 1,000 different traffic patterns and output the probability of exceeding the budget. This move toward “Monte Carlo Simulations” represents the high end of tech-based data analysis in Google Sheets, bridging the gap between basic spreadsheets and dedicated statistical software.
Best Practices for Building Robust Analysis Models
An analytical model is only as good as its architecture. Poorly designed sheets lead to “garbage in, garbage out” scenarios, which can result in costly business errors.
Designing for Flexibility and Scalability
A professional What-If model should be built with the “separation of concerns” principle.
- Input Sheet: Where all variables are stored.
- Calculation Sheet: Where the heavy lifting (logic/formulas) happens.
- Output/Dashboard Sheet: Where the results are visualized.
By keeping the logic separate from the presentation, you make it easier to scale the model. If you need to add a new variable, you don’t have to rewrite every formula across the entire workbook; you simply update the calculation layer.
Error Handling and Data Validation
In complex What-If Analysis, errors can propagate quickly. Using IFERROR or IFNA is a technical necessity to ensure that a single missing variable doesn’t break the entire dashboard. Furthermore, implementing strict Data Validation on input cells ensures that users cannot enter a “string” (text) where a “float” (number) is expected, which would otherwise result in calculation failures.
The Future of Analysis: Integration with AI and External Data
As we look toward the future of Google Workspace, What-If Analysis is becoming increasingly automated through Artificial Intelligence and Big Data integration.
Using Connected Sheets for Big Data
For enterprise-level tech environments, Google Sheets can now connect directly to BigQuery via “Connected Sheets.” This allows What-If Analysis to be performed on billions of rows of data without leaving the spreadsheet interface. You can analyze live production data, apply your What-If parameters, and see real-time projections. This integration represents a major shift in how software tools handle data gravity, moving the analysis to the data rather than the other way around.
AI-Driven Predictions within Google Workspace
Google is increasingly integrating “Help me organize” and “Duet AI” features into Sheets. These AI tools can suggest What-If scenarios based on the patterns they detect in your data. In the near future, the manual setup of Goal Seek or Data Tables may be supplemented by natural language queries—such as “Show me a scenario where our CAC (Customer Acquisition Cost) drops by 15%.”
By mastering these technical tools and methodologies today, you position yourself at the forefront of this evolution. What-If Analysis in Google Sheets is more than just a spreadsheet trick; it is a vital technical competency that empowers you to navigate uncertainty with calculated confidence. Through structured logic, advanced formulas, and the power of the cloud, you can turn “What If?” into a definitive roadmap for success.
aViewFromTheCave is a participant in the Amazon Services LLC Associates Program, an affiliate advertising program designed to provide a means for sites to earn advertising fees by advertising and linking to Amazon.com. Amazon, the Amazon logo, AmazonSupply, and the AmazonSupply logo are trademarks of Amazon.com, Inc. or its affiliates. As an Amazon Associate we earn affiliate commissions from qualifying purchases.