
In the world of passive investing, few instruments carry as much weight or reputation as the Vanguard Total Stock Market ETF, known by its ticker symbol, VTI. For many investors, from those just beginning their journey to seasoned portfolio managers, VTI represents the “gold standard” of diversified equity exposure. However, to truly understand the value of this fund, one must look beneath the surface of its ticker symbol to understand exactly what it tracks, how it is structured, and why it has become a cornerstone of modern financial planning.
At its core, VTI is designed to provide investors with exposure to the entire investable United States equity market. This is an ambitious goal, as the U.S. market comprises thousands of companies ranging from multi-trillion-dollar tech giants to small-town industrial firms. To achieve this, VTI tracks a specific benchmark that dictates its holdings, weightings, and overall performance characteristics.
The Foundation: The CRSP US Total Market Index
VTI does not simply pick stocks based on a manager’s intuition. Instead, it follows a strict, rules-based methodology dictated by its underlying benchmark: the CRSP US Total Market Index. Developed by the Center for Research in Security Prices at the University of Chicago Booth School of Business, this index is one of the most comprehensive representations of the U.S. stock market available today.
The Scope of the CRSP Index
The CRSP US Total Market Index is designed to capture 100% of the investable universe of the U.S. equity market. Unlike the S&P 500, which focuses exclusively on large-cap companies, or the Russell 2000, which focuses on small-caps, the CRSP index tracked by VTI includes everything. It spans across large-cap, mid-cap, small-cap, and even micro-cap stocks. As of recent data, this equates to nearly 4,000 individual stocks.
By tracking this index, VTI ensures that an investor owns a piece of virtually every publicly traded company in the United States that meets basic liquidity and size requirements. This “total market” approach eliminates the need for an investor to guess which segment of the market—large or small—will outperform in a given year.
Market Capitalization Weighting
The index employs a market-capitalization-weighted methodology. This means that companies with larger total market values (share price multiplied by shares outstanding) occupy a larger percentage of the index. If a company like Apple or Microsoft has a market cap in the trillions, it will naturally represent a much larger portion of VTI than a small-cap company with a market cap of only $500 million.
This weighting strategy is intentional. It reflects the actual distribution of wealth within the U.S. economy. As companies grow and become more successful, they naturally become a larger part of the index. Conversely, if a company’s value declines, its influence on VTI diminishes. This creates a self-cleansing mechanism where the winners are “bought” and the losers are “sold” automatically through the rebalancing of the index.
Diversification Across Market Caps and Sectors
One of the primary reasons investors choose to track the total market via VTI is the inherent diversification it provides. While the S&P 500 is often used as a proxy for “the market,” it actually misses about 15% to 20% of the investable U.S. landscape—the mid- and small-cap sectors that VTI includes.
Large-Cap Dominance with a Long Tail
Because VTI is market-cap weighted, it is heavily influenced by large-cap stocks. Approximately 70% to 80% of the fund is composed of the same companies found in the S&P 500. These are the household names: Amazon, Alphabet, Nvidia, and Meta.
However, the “long tail” of VTI is what sets it apart. The remaining 20% to 30% of the fund is distributed among thousands of smaller companies. While an individual small-cap stock might only represent 0.001% of the fund, the collective movement of these thousands of smaller companies provides a different risk-return profile than a large-cap-only fund. Historically, small-cap stocks have the potential for higher growth, albeit with higher volatility. By tracking VTI, an investor captures that growth potential without the concentrated risk of picking individual small-cap winners.
Comprehensive Sector Allocation
VTI tracks the U.S. economy across all major sectors. Because it is a mirror of the total market, its sector weightings shift as the economy evolves. Currently, the Technology sector holds the largest weight, reflecting the digital transformation of the global economy. This is followed by sectors such as Healthcare, Financials, and Consumer Discretionary.
By tracking the total market, VTI provides exposure to:
-
Industrials and Materials: The backbone of infrastructure and manufacturing.
-
Energy: Companies involved in oil, gas, and renewable energy.
-
Utilities and Real Estate: Often sought for their dividend yields and relative stability.
-
Consumer Staples: The “recession-proof” companies that provide everyday essentials.
This broad sector exposure ensures that an investor is never overly dependent on a single industry’s success. If the tech sector faces a downturn but healthcare thrives, the diversified nature of VTI helps mitigate the overall impact on the portfolio.
VTI vs. VOO: Understanding the Tracking Nuance
A common question in the financial world is why an investor would choose VTI (Total Market) over VOO (Vanguard S&P 500 ETF). The answer lies in the specific segments of the market they track.
The Inclusion of the “Extended Market”
VOO tracks the S&P 500, which represents the 500 largest, most stable companies in the U.S. It is often seen as a “quality” index because companies must meet specific profitability criteria to be included. VTI, by tracking the CRSP US Total Market Index, includes those 500 companies plus approximately 3,500 more. These additional 3,500 companies represent the “extended market.”
The extended market includes “the next” great companies before they become large enough for the S&P 500. For example, a company like Tesla was a significant part of VTI long before it was finally added to the S&P 500 in 2020. By tracking the total market, VTI investors captured Tesla’s early meteoric rise, whereas S&P 500 investors only benefited from its performance after it had already become one of the largest companies in the world.
Performance Correlation
Despite the difference in the number of holdings, VTI and VOO are highly correlated. Because both are market-cap weighted, the 500 largest companies dictate the majority of the movement for both funds. Over long periods, the performance of VTI and VOO is remarkably similar. However, in years where small-cap stocks outperform large-caps, VTI will typically edge out VOO. In years where “mega-cap” tech dominates, VOO may have a slight lead.
The Mechanics of Efficient Tracking
For an ETF to successfully track an index of 4,000 stocks, it requires sophisticated institutional management. Vanguard utilizes a “full replication” strategy for VTI, meaning the fund physically owns every single stock in the CRSP US Total Market Index in the exact proportions dictated by the benchmark.
Expense Ratio and Cost Efficiency
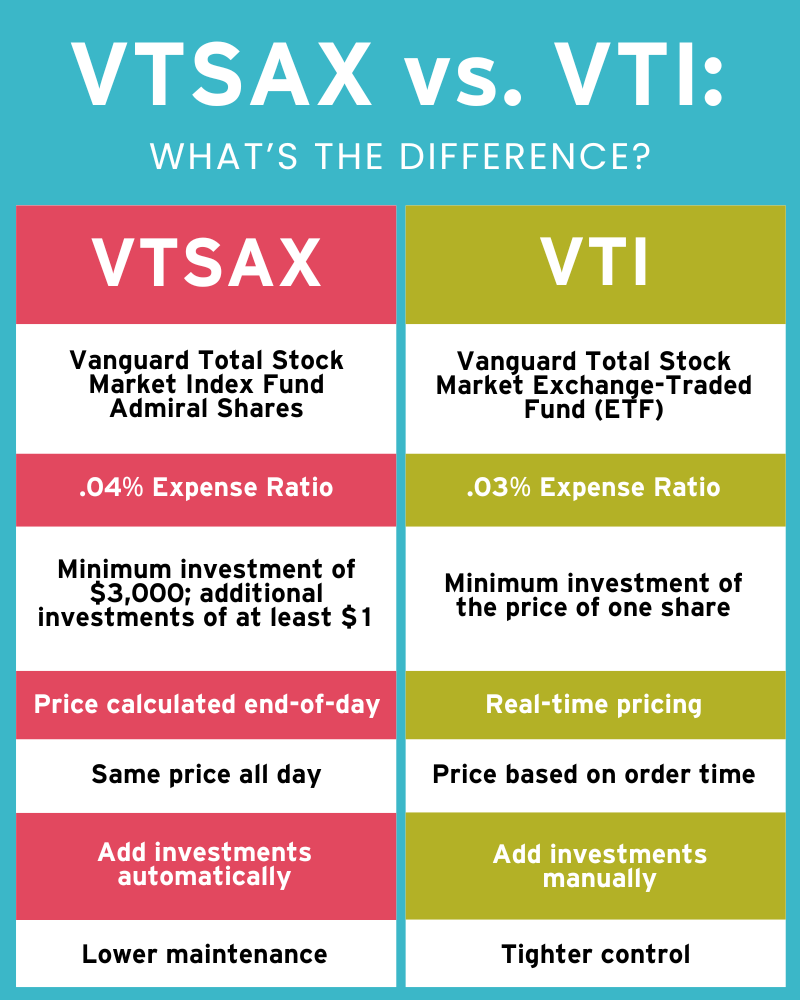
One of the most attractive features of how VTI tracks its index is the cost. VTI is famous for its ultra-low expense ratio, currently standing at 0.03%. This means that for every $10,000 invested, the annual cost to the investor is only $3.
This low cost is a direct result of the passive tracking strategy. Because the fund isn’t paying a team of analysts to “beat the market” through active stock picking, it can pass those savings on to the investor. In the world of finance, fees are one of the few things an investor can control, and by tracking the total market at such a low cost, VTI maximizes the power of compounding.
Tracking Error and Liquidity
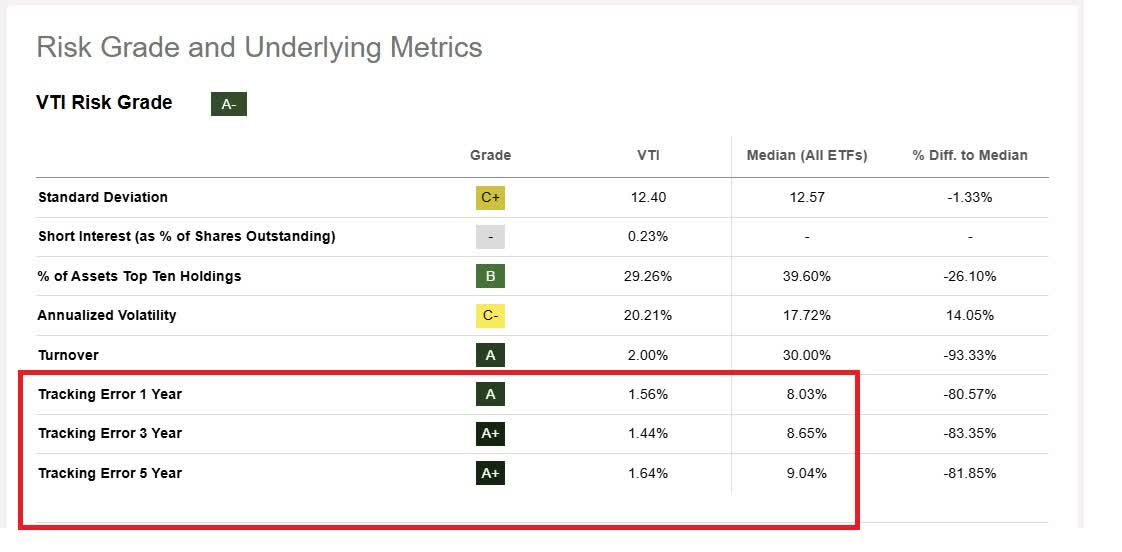
The “tracking error” is the difference between the performance of the ETF and the performance of the underlying index. Because Vanguard is a pioneer in index fund management, VTI’s tracking error is historically negligible. The fund is also highly liquid, with hundreds of millions of dollars in shares traded daily. This ensures that the price of VTI remains very close to its Net Asset Value (NAV), allowing investors to enter and exit positions at fair market prices without significant “spread” costs.
Why VTI Tracks the Total Market: The Philosophy of Passive Income
The decision to track the total market rather than a specific sector or style is rooted in the “Efficient Market Hypothesis.” This theory suggests that at any given time, stock prices reflect all available information. Therefore, it is incredibly difficult for an individual investor or a fund manager to consistently “outpick” the market.
Capturing the “Winner’s Effect”
In any given decade, a small handful of stocks are responsible for the vast majority of the market’s total returns. In the 1990s, it was tech and telecommunications; in the 2010s, it was the “FAANG” stocks. The difficulty lies in predicting which stocks will be the winners of the next decade.
By tracking the total market, VTI guarantees that the investor will own the winners. You don’t have to find the next Amazon or the next Nvidia; by owning VTI, you already own them, and as they grow, they will automatically become a larger part of your portfolio. This “buy the haystack” approach, popularized by Vanguard founder John Bogle, prioritizes broad participation in corporate America’s growth over the risky pursuit of individual alpha.
Tax Efficiency through the ETF Structure
VTI is also designed to be a tax-efficient vehicle for tracking the market. Because it is an ETF, it utilizes an “in-kind” creation and redemption process. When the index rebalances or when investors sell their shares, the fund can often avoid triggering capital gains taxes that would typically be passed on to the shareholders in a traditional mutual fund. This makes VTI an ideal candidate for taxable brokerage accounts, as it allows the investment to grow with minimal tax drag over decades.

Summary of the VTI Experience
What VTI tracks is more than just a list of stocks; it is the collective output of the American economy. By mirroring the CRSP US Total Market Index, VTI provides a self-adjusting, low-cost, and highly diversified investment vehicle. It captures the stability of large-cap blue-chip companies while maintaining exposure to the explosive growth potential of small- and mid-cap firms.
For the investor, tracking VTI means moving away from the noise of financial news and day trading. It represents a commitment to long-term wealth building based on the historical upward trajectory of the U.S. equity market. Whether used as the “core” of a portfolio or as a standalone investment, VTI remains one of the most effective tools for capturing the total return of the American stock market.
aViewFromTheCave is a participant in the Amazon Services LLC Associates Program, an affiliate advertising program designed to provide a means for sites to earn advertising fees by advertising and linking to Amazon.com. Amazon, the Amazon logo, AmazonSupply, and the AmazonSupply logo are trademarks of Amazon.com, Inc. or its affiliates. As an Amazon Associate we earn affiliate commissions from qualifying purchases.