
When you glance at your smartphone weather app before heading out, you are almost certainly met with a percentage—often labeled as the “Probability of Precipitation” (PoP). For many, this number is misinterpreted as the percentage of the area that will receive rain, or perhaps the percentage of the day that will be rainy. However, the true definition is rooted in a specific meteorological equation that blends atmospheric observation with statistical confidence. Understanding this metric is essential for anyone who relies on data-driven planning, whether you are managing daily commutes or optimizing logistics for outdoor operations.
The Mathematical Foundation of PoP
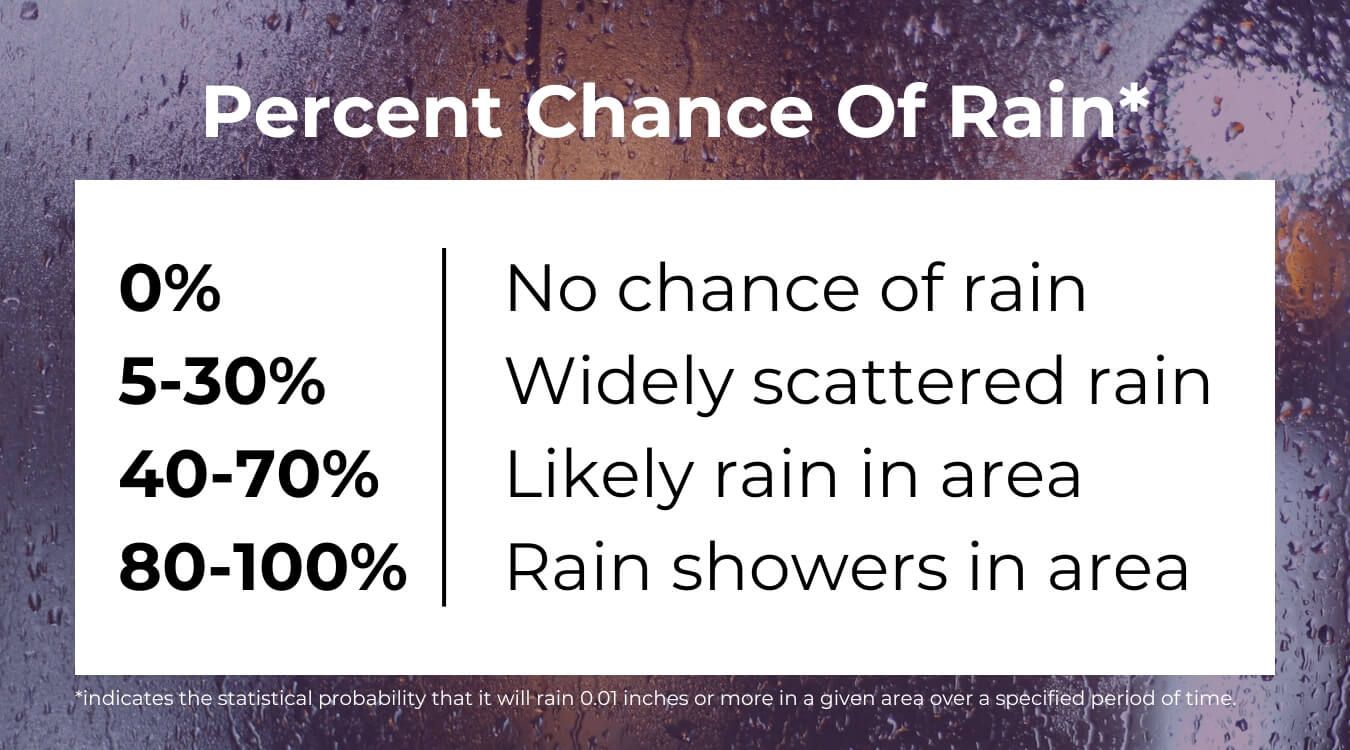
The standard definition of the Probability of Precipitation (PoP) is the statistical probability that a specific point in the forecast area will receive at least 0.01 inches of liquid equivalent precipitation during a specified time period. To arrive at this number, meteorologists utilize a formula that combines two distinct variables: confidence and coverage.
Confidence vs. Coverage
The “Confidence” factor refers to the certainty that a forecaster has in their numerical models. If a forecaster is certain that rain will develop in the region, the confidence factor is 100%. If they are uncertain, that number drops.
The “Coverage” factor refers to the amount of the area that is expected to receive precipitation if the rain actually occurs. If a forecaster is 100% sure that rain will occur, but they believe it will only cover 20% of the area, the resulting PoP is 20%. Conversely, if a forecaster is only 50% sure that any rain will happen at all, but they believe that if it does, it will cover 80% of the region, the calculation (0.50 x 0.80) results in a 40% PoP.
Understanding the 0.01 Inch Threshold
It is vital to note that the PoP metric ignores “trace” amounts. To be counted as “rain” in the eyes of the National Weather Service and most commercial weather APIs, the precipitation must total at least 0.01 inches. This means that a 30% chance of rain does not necessarily mean there is a 30% chance of a downpour; it could imply a 30% chance of a light drizzle that accumulates enough moisture to hit that measurable threshold.
The Role of Numerical Weather Prediction (NWP) Models
Modern weather forecasting is heavily reliant on advanced software and high-performance computing clusters that run Numerical Weather Prediction (NWP) models. These digital tools ingest massive datasets—including satellite imagery, radar feeds, oceanic temperatures, and barometric pressure readings—to simulate the fluid dynamics of the Earth’s atmosphere.
Digital Ensemble Forecasting
Rather than relying on a single deterministic model, meteorologists utilize “Ensemble Forecasting.” This process involves running the same model multiple times with slightly varied initial conditions. If a meteorologist runs an ensemble of 20 model iterations and 8 of them show measurable precipitation for a specific grid square, the mathematical probability of rain for that area is 40% (8/20). This software-driven approach reduces the margin of error by accounting for the inherent chaos in atmospheric patterns.
API Integration and Data Transparency
For developers building weather-integrated applications, understanding the backend of these models is crucial. Most commercial weather APIs, such as OpenWeatherMap or Tomorrow.io, provide precipitation probability as a standard data point. These services parse the raw outputs from global models like the GFS (Global Forecast System) or the ECMWF (European Centre for Medium-Range Weather Forecasts). When you see a percentage on a website, you are essentially looking at a user-friendly visualization of raw computational data generated by these algorithmic systems.
Why We Misinterpret the Data
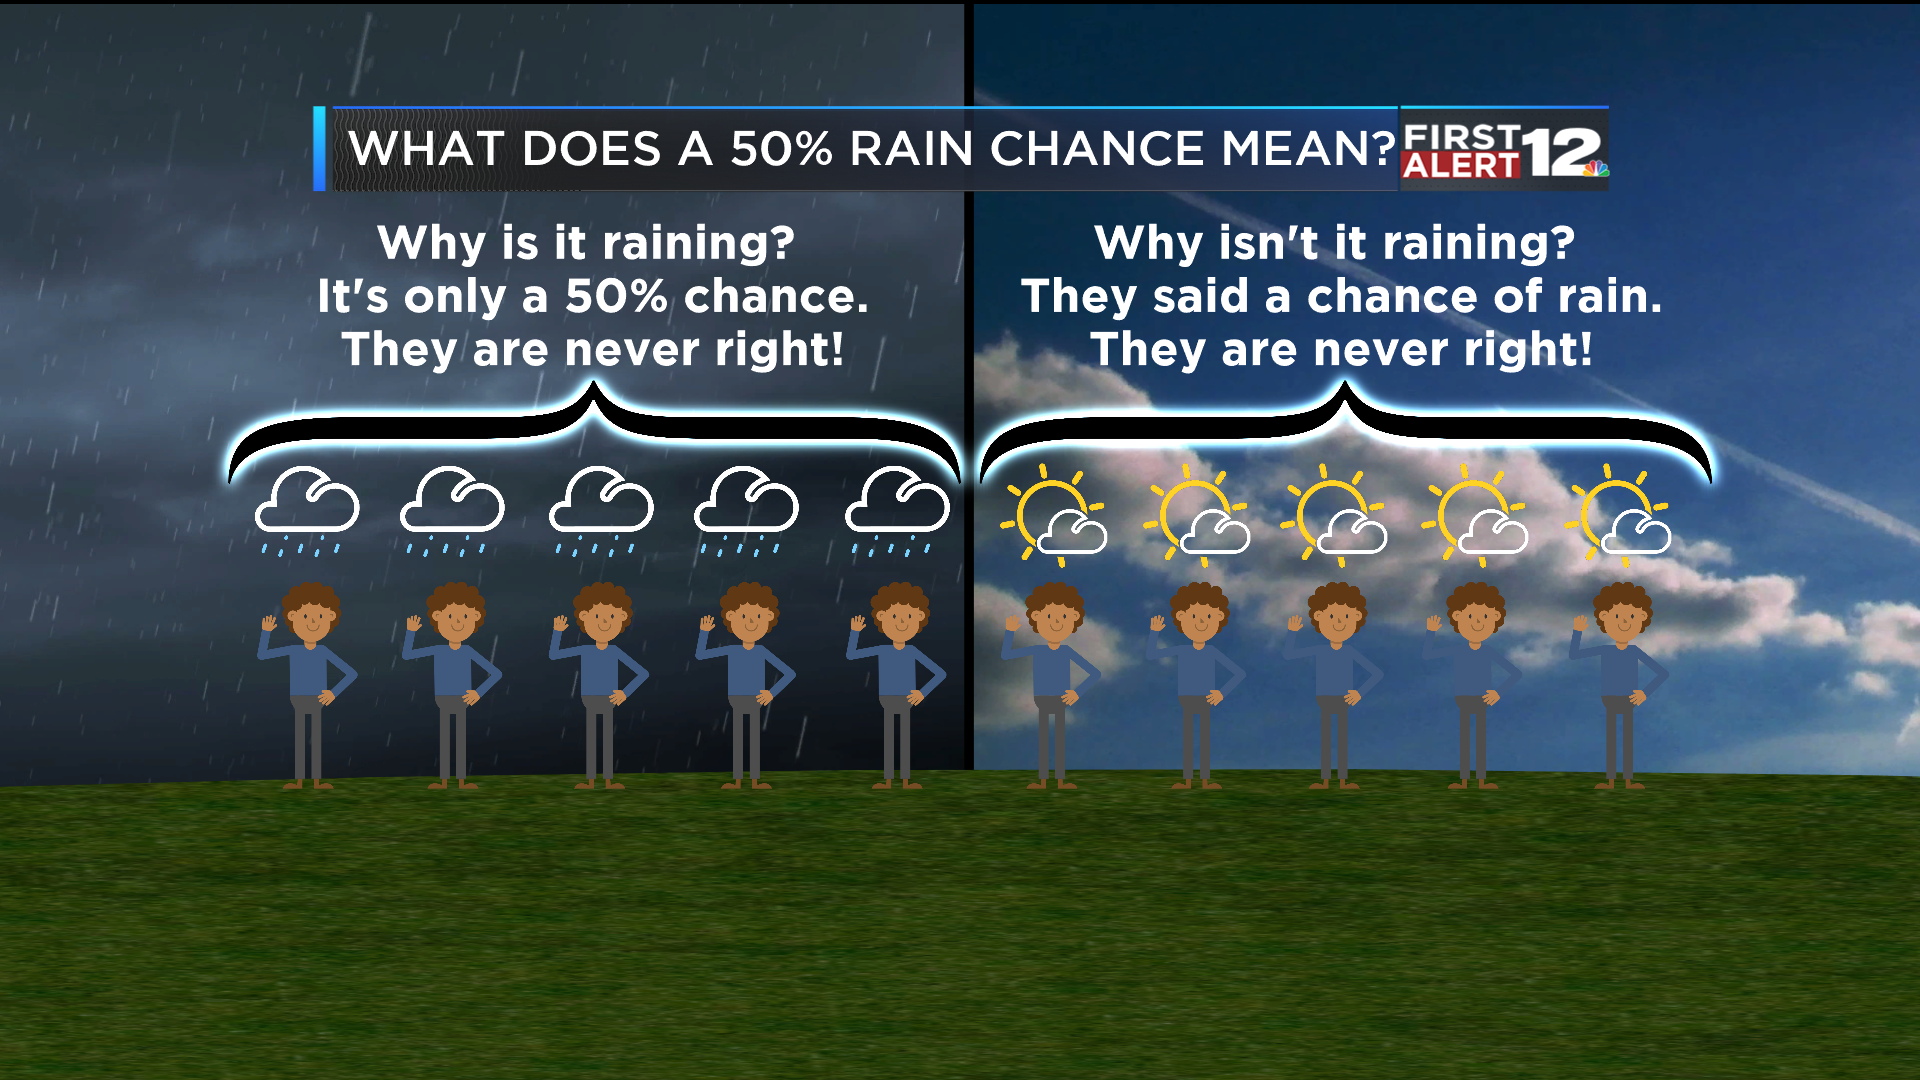
Human intuition is historically poor at processing probability, which leads to widespread confusion regarding weather forecasts. The most common fallacy is the “spatial coverage” myth. Many people believe a 40% chance of rain means that 40% of the city will be covered in rain. While this can sometimes be a byproduct of the calculation, it is not the literal definition.
The Cognitive Bias in Probability
Psychologists often refer to this as the “Base Rate Fallacy.” When users see a 20% chance of rain, they tend to assume that rain is unlikely. However, in a professional or operational context, a 20% risk is significant. If an investment firm were told there was a 20% chance of a market dip, they would treat that as a serious risk factor. Similarly, weather services treat these percentages as calibrated risk probabilities. The goal is to provide a consistent statistical baseline so that users can make informed decisions based on their own risk tolerance.
The Impact of Localized Topography
Digital forecasting tools sometimes struggle with highly localized topography. A city with significant elevation changes—such as San Francisco or Denver—might see high PoP percentages for the region, but specific neighborhoods remain dry due to rain shadows. Because the PoP represents an average for the forecast area, users must supplement these digital figures with local knowledge. Relying solely on the “percentage” without understanding the geography of your area can lead to a disconnect between the digital report and the physical reality on the ground.
Optimizing Personal and Professional Planning
Once you understand that the rain percentage is a calculation of confidence multiplied by area coverage, you can move from passive viewing to active risk management. This shift is beneficial for both personal scheduling and larger-scale professional planning.
Risk Management Frameworks
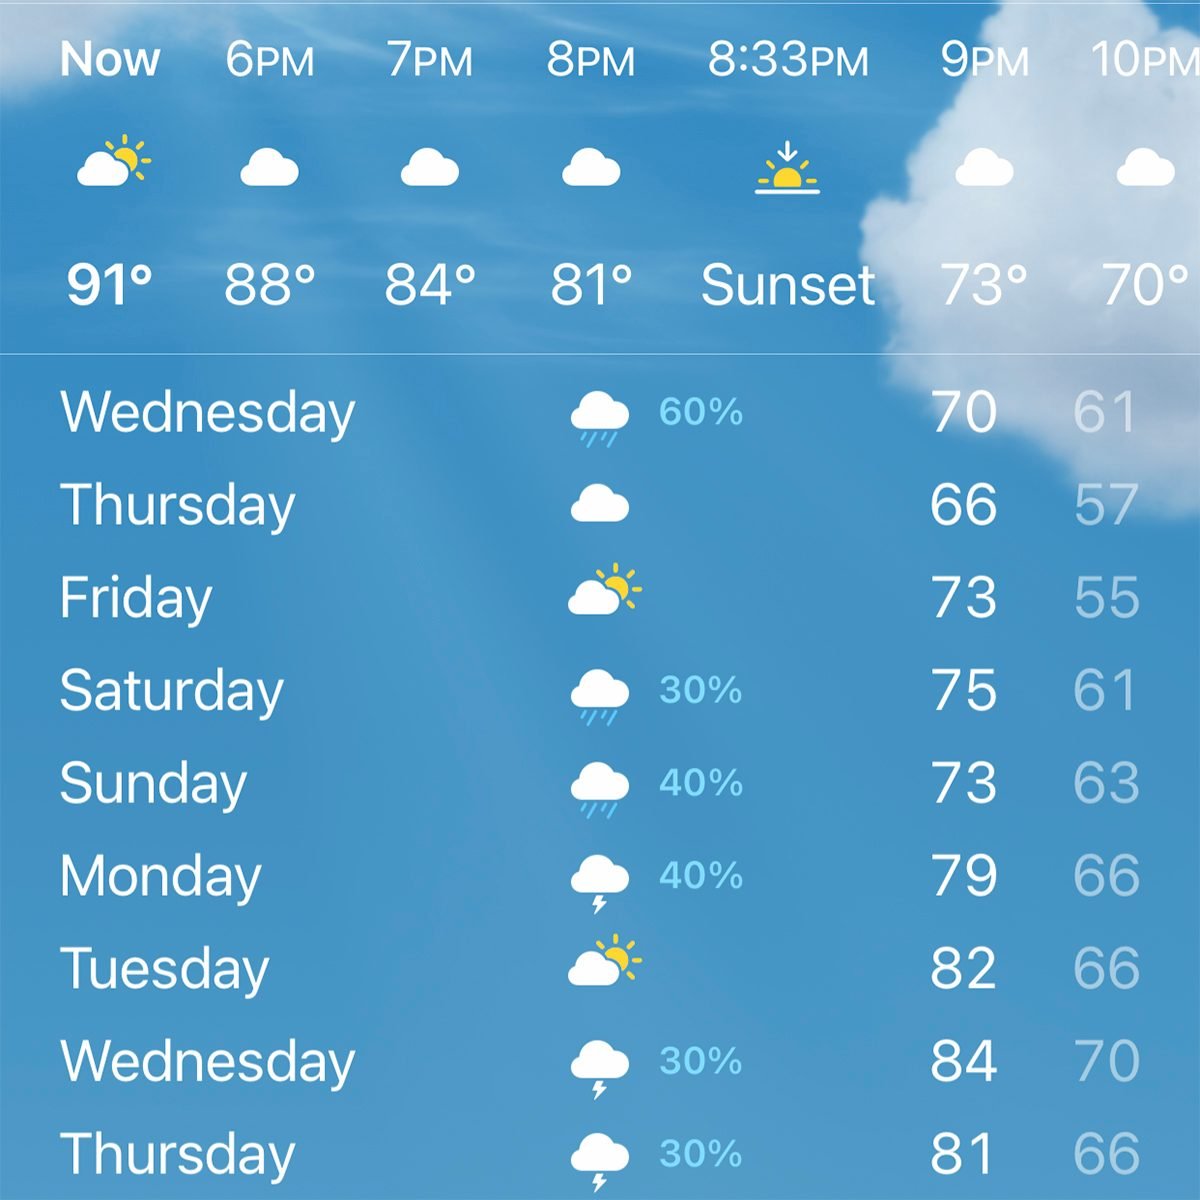
If you are planning an event, you should not just look at the percentage; you should look at the “forecast trend.” If the PoP has been steadily increasing over the last six hours, the confidence factor in the model is strengthening. If the percentage is fluctuating wildly, the model is unstable, and you should plan for volatility.
Using technology effectively means viewing the percentage as a variable in an equation rather than an absolute truth. For instance, if you are a logistics manager deciding whether to schedule outdoor deliveries, a 30% PoP might be acceptable if the duration of the predicted rain is short and the intensity is low. By looking deeper into the metadata of your weather application—such as “QPF” (Quantitative Precipitation Forecast), which estimates the actual amount of rain—you gain a much clearer picture than the probability percentage alone provides.
The Future of Hyper-Local Forecasting
Advancements in AI and machine learning are currently revolutionizing how we calculate these percentages. We are moving toward “Nowcasting,” where models update in near-real-time using edge computing to process hyper-local data from internet-connected weather sensors. This will eventually lead to forecasts that are not just “city-wide,” but granular to the street level. As these software tools evolve, the traditional definition of PoP will likely shift from a broad regional probability to a highly localized, dynamic risk assessment.
Ultimately, the “rain percentage” is a bridge between complex atmospheric modeling and human decision-making. By stripping away the misconceptions and recognizing the mathematical reality—that it is a product of model confidence and spatial probability—you become a more informed user of digital data. Whether you are checking your app to decide if you need an umbrella or optimizing a professional schedule, remember that the percentage is a tool for risk management, not a simple forecast of a binary outcome. It is a statistical window into the chaotic, fluid, and entirely fascinating nature of our atmosphere.
aViewFromTheCave is a participant in the Amazon Services LLC Associates Program, an affiliate advertising program designed to provide a means for sites to earn advertising fees by advertising and linking to Amazon.com. Amazon, the Amazon logo, AmazonSupply, and the AmazonSupply logo are trademarks of Amazon.com, Inc. or its affiliates. As an Amazon Associate we earn affiliate commissions from qualifying purchases.