
In the landscape of educational assessment, psychometrics, and performance analytics, raw data often requires transformation to be truly actionable. Whether you are an educator evaluating student progress or a human resources professional analyzing aptitude test results, raw scores—such as the number of questions answered correctly—rarely provide the full picture. They lack context. To bridge this gap, statisticians developed the “stanine” system.
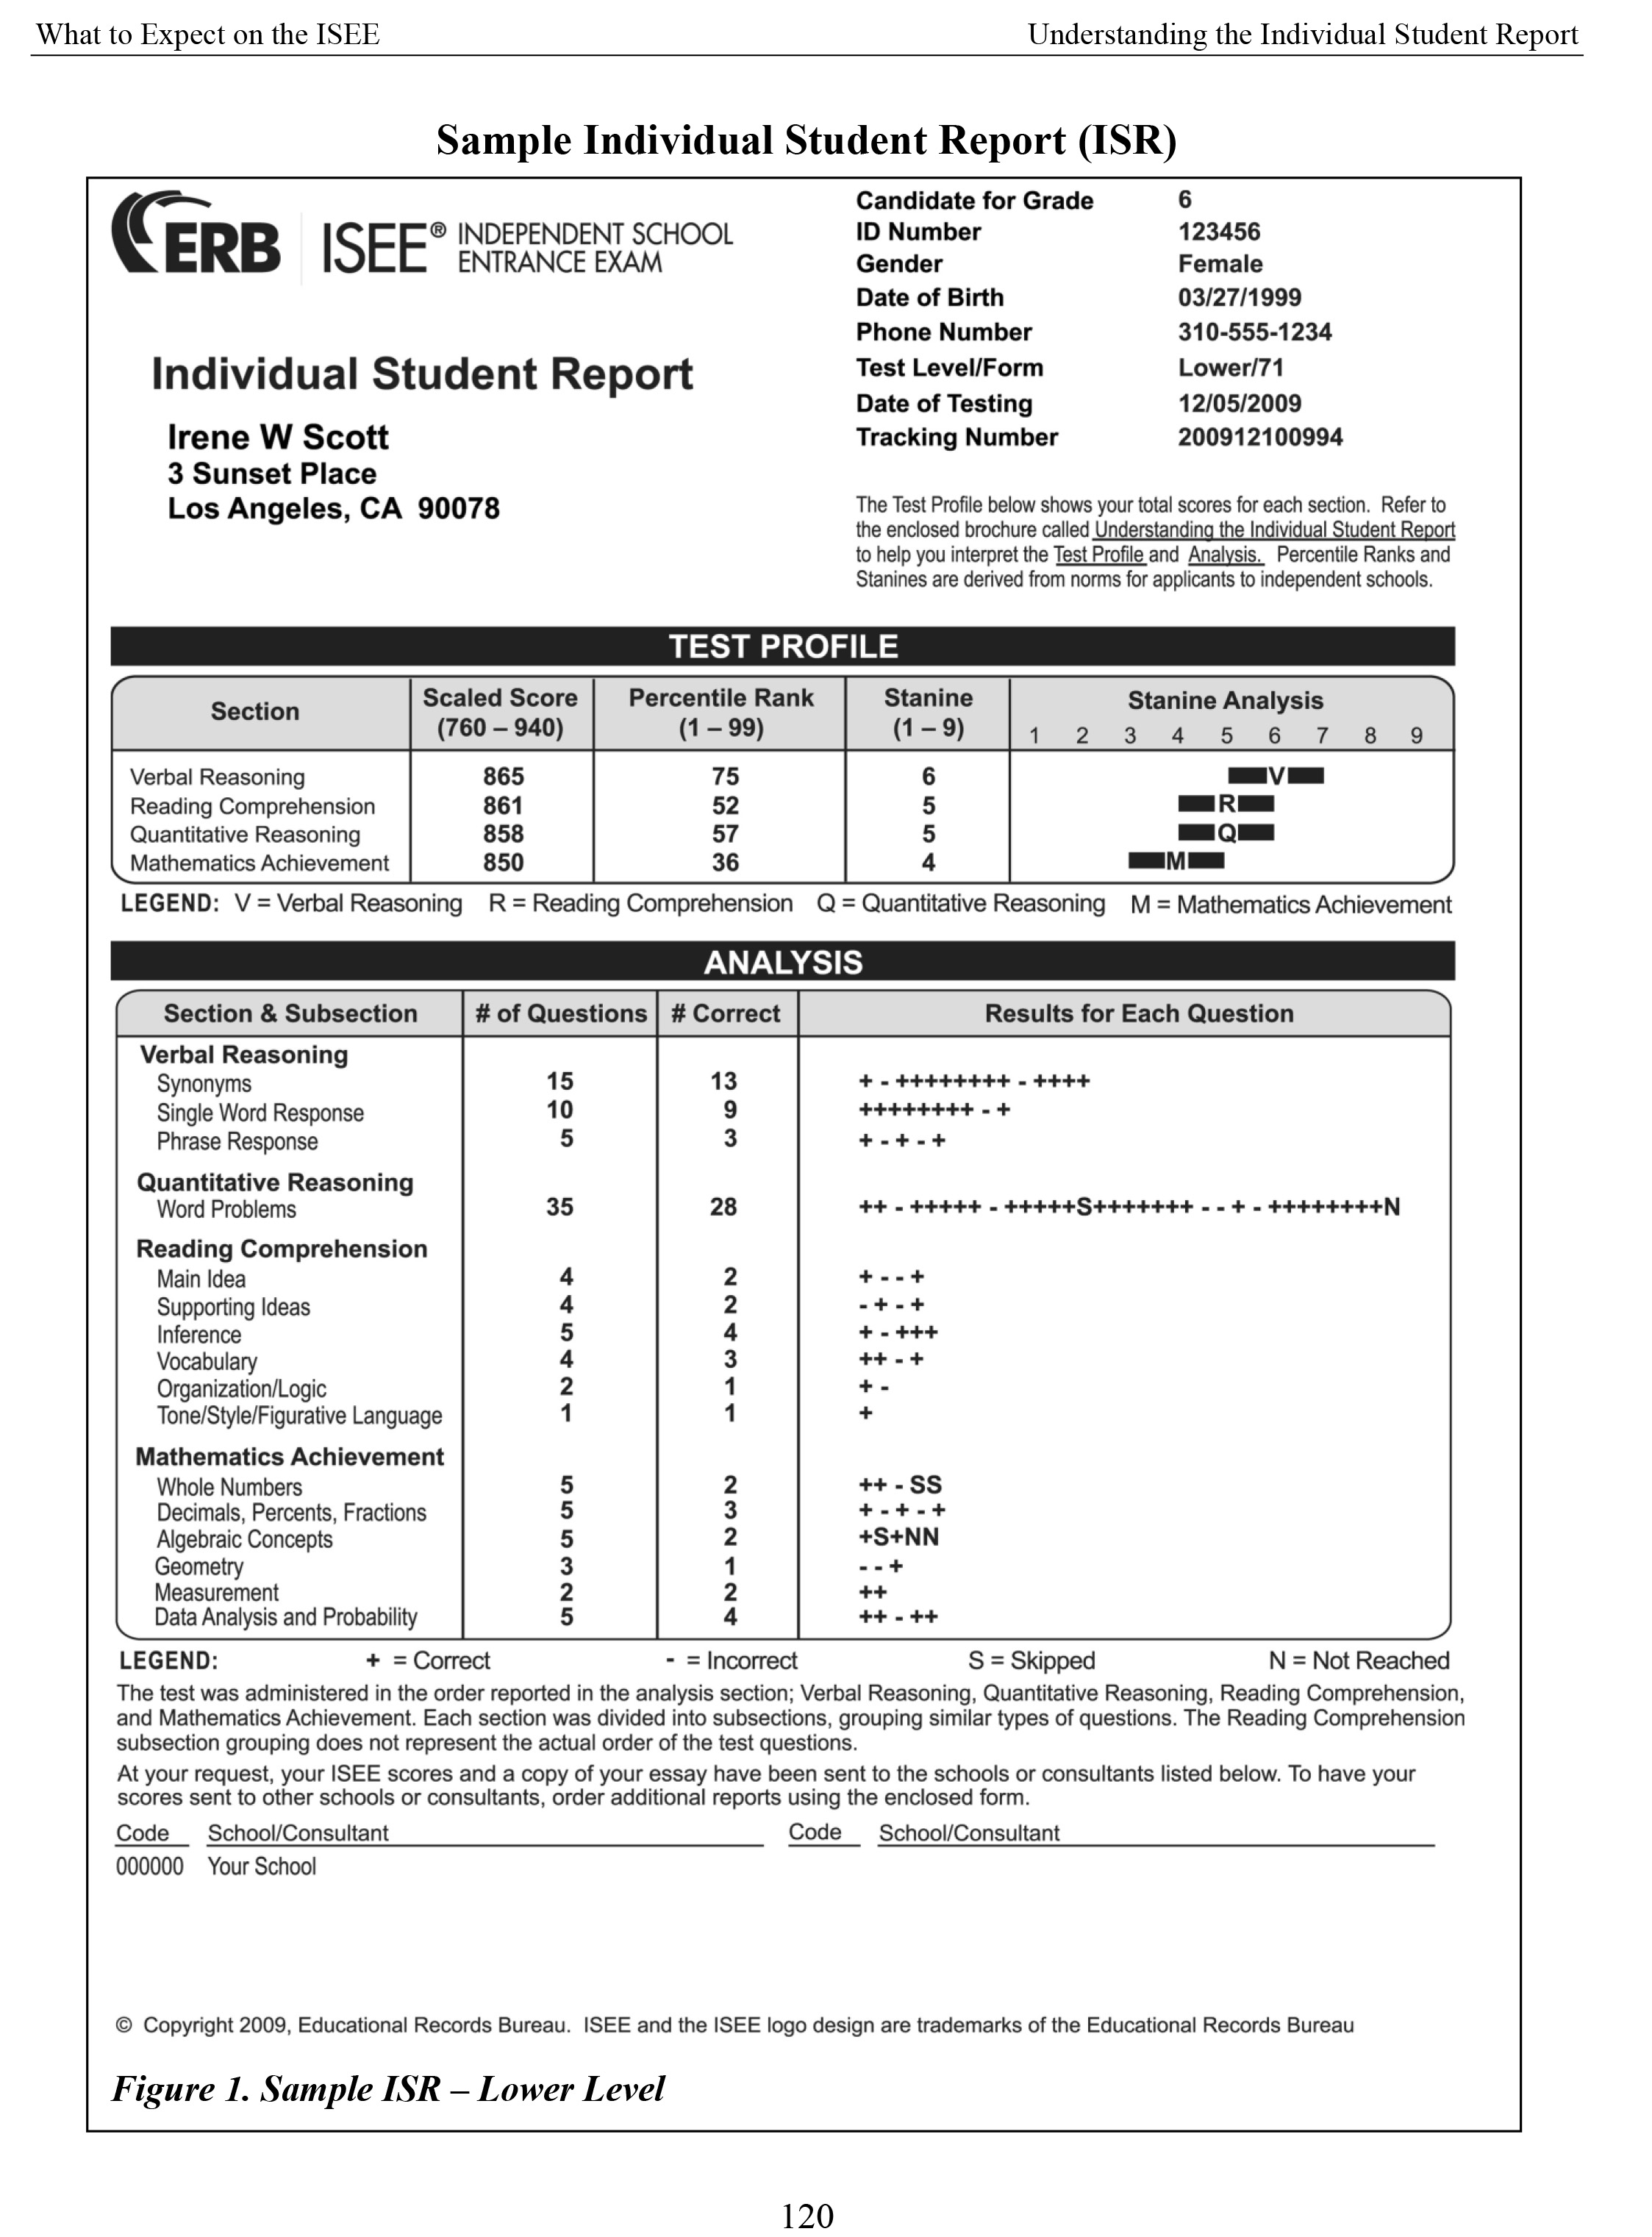
The term “stanine” is a portmanteau of “standard nine.” It is a method of scaling test scores on a nine-point scale, which allows for the comparison of performance across different groups or different tests. By normalizing data, the stanine system helps stakeholders understand how an individual performs relative to a normative group, moving beyond simple percentages to reveal a student’s or candidate’s standing in a broader statistical distribution.
The Mathematical Foundation of Stanines
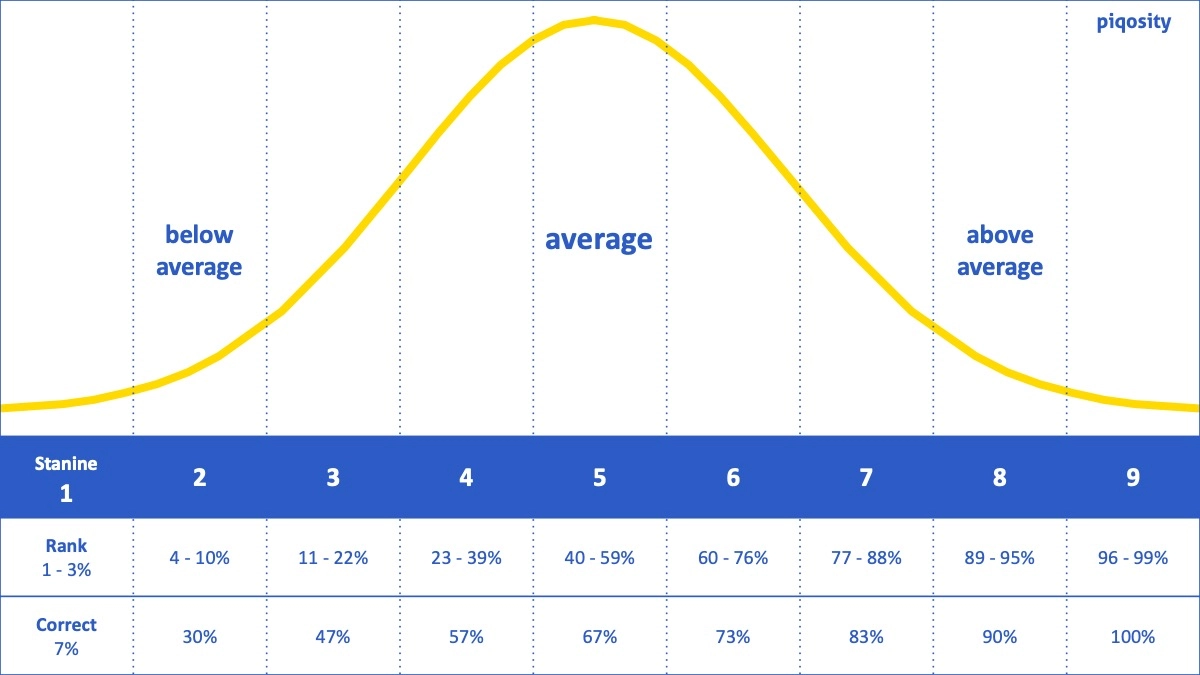
The stanine system is rooted in the normal distribution, or the “bell curve.” In a perfectly normal distribution, scores cluster around the mean, with fewer scores appearing at the extreme high or low ends. Stanines partition this curve into nine discrete segments, each representing a specific proportion of the population.
Understanding the Distribution
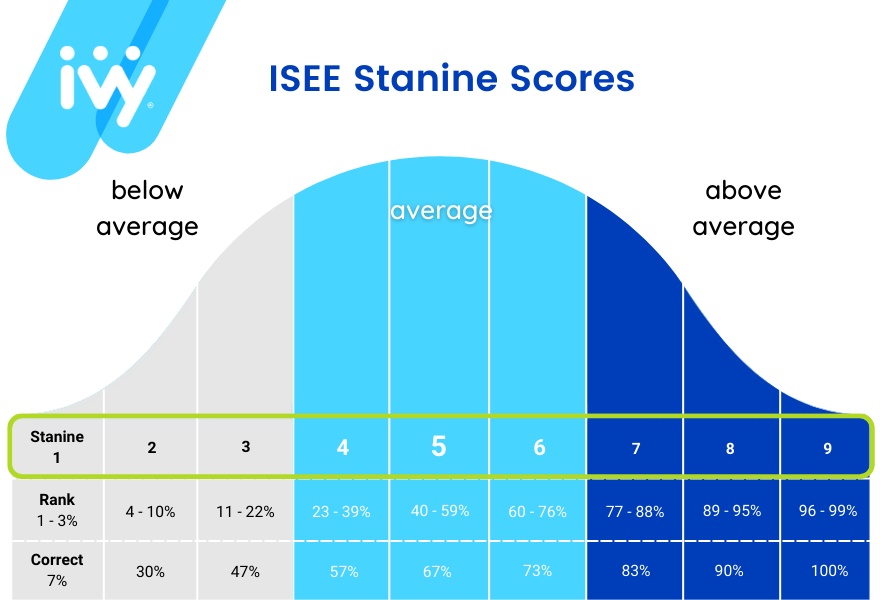
The system allocates a specific percentage of the total test-taking population to each stanine level, ranging from 1 to 9. The allocation is designed to mirror the shape of the bell curve:
- Stanine 1: The lowest 4% of the population.
- Stanine 2: The next 7% (cumulative 11%).
- Stanine 3: The next 12% (cumulative 23%).
- Stanine 4: The next 17% (cumulative 40%).
- Stanine 5: The middle 20% (cumulative 60%).
- Stanine 6: The next 17% (cumulative 77%).
- Stanine 7: The next 12% (cumulative 89%).
- Stanine 8: The next 7% (cumulative 96%).
- Stanine 9: The top 4% of the population.
This structure is highly deliberate. By assigning the largest percentage (20%) to the middle score—stanine 5—the system inherently identifies the “average” performer, while the lower and higher stanines provide increasingly granular distinctions for those who fall outside the norm.
Why Normalize Data?
Raw scores are sensitive to the difficulty of a specific test. If an exam is unusually difficult, a raw score of 60% might actually represent an excellent performance, whereas on an easy test, 60% could be a failure. Stanines strip away this volatility. By comparing an individual’s raw score against the mean and standard deviation of a standardized reference group, the stanine score reveals that individual’s true relative proficiency, regardless of the test’s inherent difficulty level.
Interpreting Stanine Scores in Professional and Educational Contexts
Interpreting stanines requires shifting one’s perspective from “percent correct” to “percentile rank.” When someone receives a stanine score, it is not a grade; it is an indicator of placement within a distribution.
The Significance of the Middle Range
Many people fall into the trap of viewing anything below a 9 as a “failure,” but that is a fundamental misunderstanding of the stanine scale. A stanine of 5 is explicitly defined as average performance. In this system, 5 represents the exact center of the bell curve. If an individual scores a 4, 5, or 6, they are performing within the “average” range, accounting for 54% of the total population. This is crucial for educators and managers to understand, as it prevents the mislabeling of perfectly capable individuals as “underperformers” simply because they did not achieve a score in the top decile.
Extremes: Interpreting the Lows and Highs
Stanines 1, 2, and 3 represent performance significantly below the average, while 7, 8, and 9 represent performance significantly above the average. These scores act as red flags or green lights, respectively.
- Low Stanines (1–3): These scores suggest that an individual may require additional resources, specialized instruction, or a review of their foundational knowledge.
- High Stanines (7–9): These scores indicate advanced aptitude or mastery, suggesting that the individual may be ready for more challenging material or increased responsibilities.
The primary utility here is resource allocation. If a training program or classroom curriculum is designed for the average learner, those in stanines 8 or 9 will likely be bored and disengaged, while those in stanines 1 or 2 will be left behind. Stanine analysis allows administrators to tailor their interventions effectively.
The Advantages and Limitations of the Stanine Scale
While the stanine system is a robust tool for statistical analysis, it is not without its limitations. Understanding these trade-offs is essential for any professional tasked with interpreting performance data.
The Benefit: Reducing Measurement Error
One of the most significant advantages of stanines is their ability to minimize the impact of minor measurement errors. Raw scores are often “noisy”—a student might get a question wrong due to a momentary lapse in concentration rather than a lack of knowledge. By grouping scores into broader categories, stanines provide a “coarser” but more reliable measure. Small fluctuations in a raw score are less likely to result in a dramatic change in a stanine score, making the final metric more stable and reflective of long-term proficiency rather than a single “bad day.”
The Limitation: Lack of Granularity
The very feature that makes stanines reliable also acts as their greatest limitation: they lack precision. Because the scale is limited to nine points, it is impossible to distinguish between a student who barely made it into the 9th stanine and a student who achieved a perfect raw score.
In high-stakes scenarios—such as medical board exams, entrance tests for elite programs, or professional certifications—the difference between the top of the 8th stanine and the bottom of the 9th might be significant in terms of raw accuracy. For such high-resolution needs, stanines are often combined with other metrics, such as percentile ranks or standard deviations, to provide a more nuanced picture.
Stanines vs. Other Standardized Scoring Systems
To fully grasp the role of stanines, it is helpful to contrast them with other common scoring methods used in assessment.
Stanines vs. Percentiles
It is common to confuse stanines with percentile ranks. A percentile rank indicates the percentage of individuals who scored lower than the individual in question. A percentile of 90 means the individual performed better than 90% of the group. While percentiles offer 99 points of distinction, they can be misleading because the distance between percentiles is not uniform across the curve. The difference in skill between the 50th and 55th percentile is significantly smaller than the difference between the 90th and 95th percentile. Stanines solve this by grouping scores in a way that respects the mathematical distance of the normal distribution, making them a more statistically honest representation of performance.
Stanines vs. T-Scores and Z-Scores
T-scores (with a mean of 50 and a standard deviation of 10) and Z-scores (with a mean of 0 and a standard deviation of 1) are more common in clinical psychology and advanced research. These metrics offer continuous, granular data. However, they are often less accessible to non-specialists. Stanines were specifically designed to be easily communicable. The single-digit nature of the stanine scale (1–9) makes it significantly easier to report results to parents, employees, or stakeholders who may not possess a background in statistics.
Conclusion: Utilizing Stanines for Data-Driven Decisions
In the modern data-driven environment, the goal of assessment is not just to grade, but to understand. The stanine system offers a balance between mathematical rigor and communicative simplicity. By normalizing performance data into a consistent nine-point scale, it provides a stable framework for identifying outliers, measuring progress over time, and ensuring that interventions—whether in the classroom or the workplace—are targeted at the right individuals.
When we ask, “What does stanine mean?” we are really asking how we can better categorize human capability in a fair and standardized manner. It is not merely a label; it is a tool for context. By recognizing that a stanine score is a reflection of relative standing within a specific population, decision-makers can avoid the common pitfalls of raw-score interpretation. Whether you are aiming to improve educational outcomes or refine professional aptitude assessments, the stanine remains one of the most effective methods for turning raw numbers into meaningful insights. Through its structure, we find a way to honor the bell curve while maintaining the clarity needed to make impactful, informed decisions.
aViewFromTheCave is a participant in the Amazon Services LLC Associates Program, an affiliate advertising program designed to provide a means for sites to earn advertising fees by advertising and linking to Amazon.com. Amazon, the Amazon logo, AmazonSupply, and the AmazonSupply logo are trademarks of Amazon.com, Inc. or its affiliates. As an Amazon Associate we earn affiliate commissions from qualifying purchases.