
The evolution of medical imaging has transitioned from static, grainy black-and-white snapshots to dynamic, high-definition visualizations of the human body’s internal mechanics. At the heart of this transformation is the integration of advanced signal processing and computational algorithms. When a technician or engineer observes a flash of red on an ultrasound screen, they are witnessing a sophisticated execution of the Doppler effect, translated through complex software to provide real-time data on fluid dynamics.
Understanding what red means on an ultrasound requires a deep dive into the technology of Color Doppler imaging. It is not merely a visual aid; it is a triumph of digital signal processing (DSP), high-frequency acoustics, and user-interface engineering. In the realm of medical technology, the color red represents a specific vector of movement identified by the system’s transducer and processed by the unit’s internal logic.

Decoding the Doppler Effect: The Engineering of Color Mapping
At its core, the presence of color on an ultrasound screen is the result of the Doppler Shift principle. This physical phenomenon occurs when the frequency of a wave changes relative to an observer moving toward or away from the source. In an ultrasound machine, the “source” is the piezoelectric crystals within the transducer, and the “observer” (or reflector) is typically the red blood cells moving through a vessel.
The Physics of Frequency Shifts
The ultrasound transducer emits high-frequency sound waves that penetrate the body. When these waves encounter stationary tissue, they bounce back at the same frequency. However, when they strike a moving object, such as blood flow, the frequency of the returning echo is either higher or lower than the transmitted pulse.
The software within the ultrasound console calculates this difference—the Doppler Shift—using a specific mathematical formula. If the blood is moving toward the transducer, the returning waves are compressed, resulting in a higher frequency. If the blood is moving away, the waves are stretched, resulting in a lower frequency. To make this data digestible for the human eye, the system’s processing unit assigns colors to these directions.
Signal Processing and Software Calibration
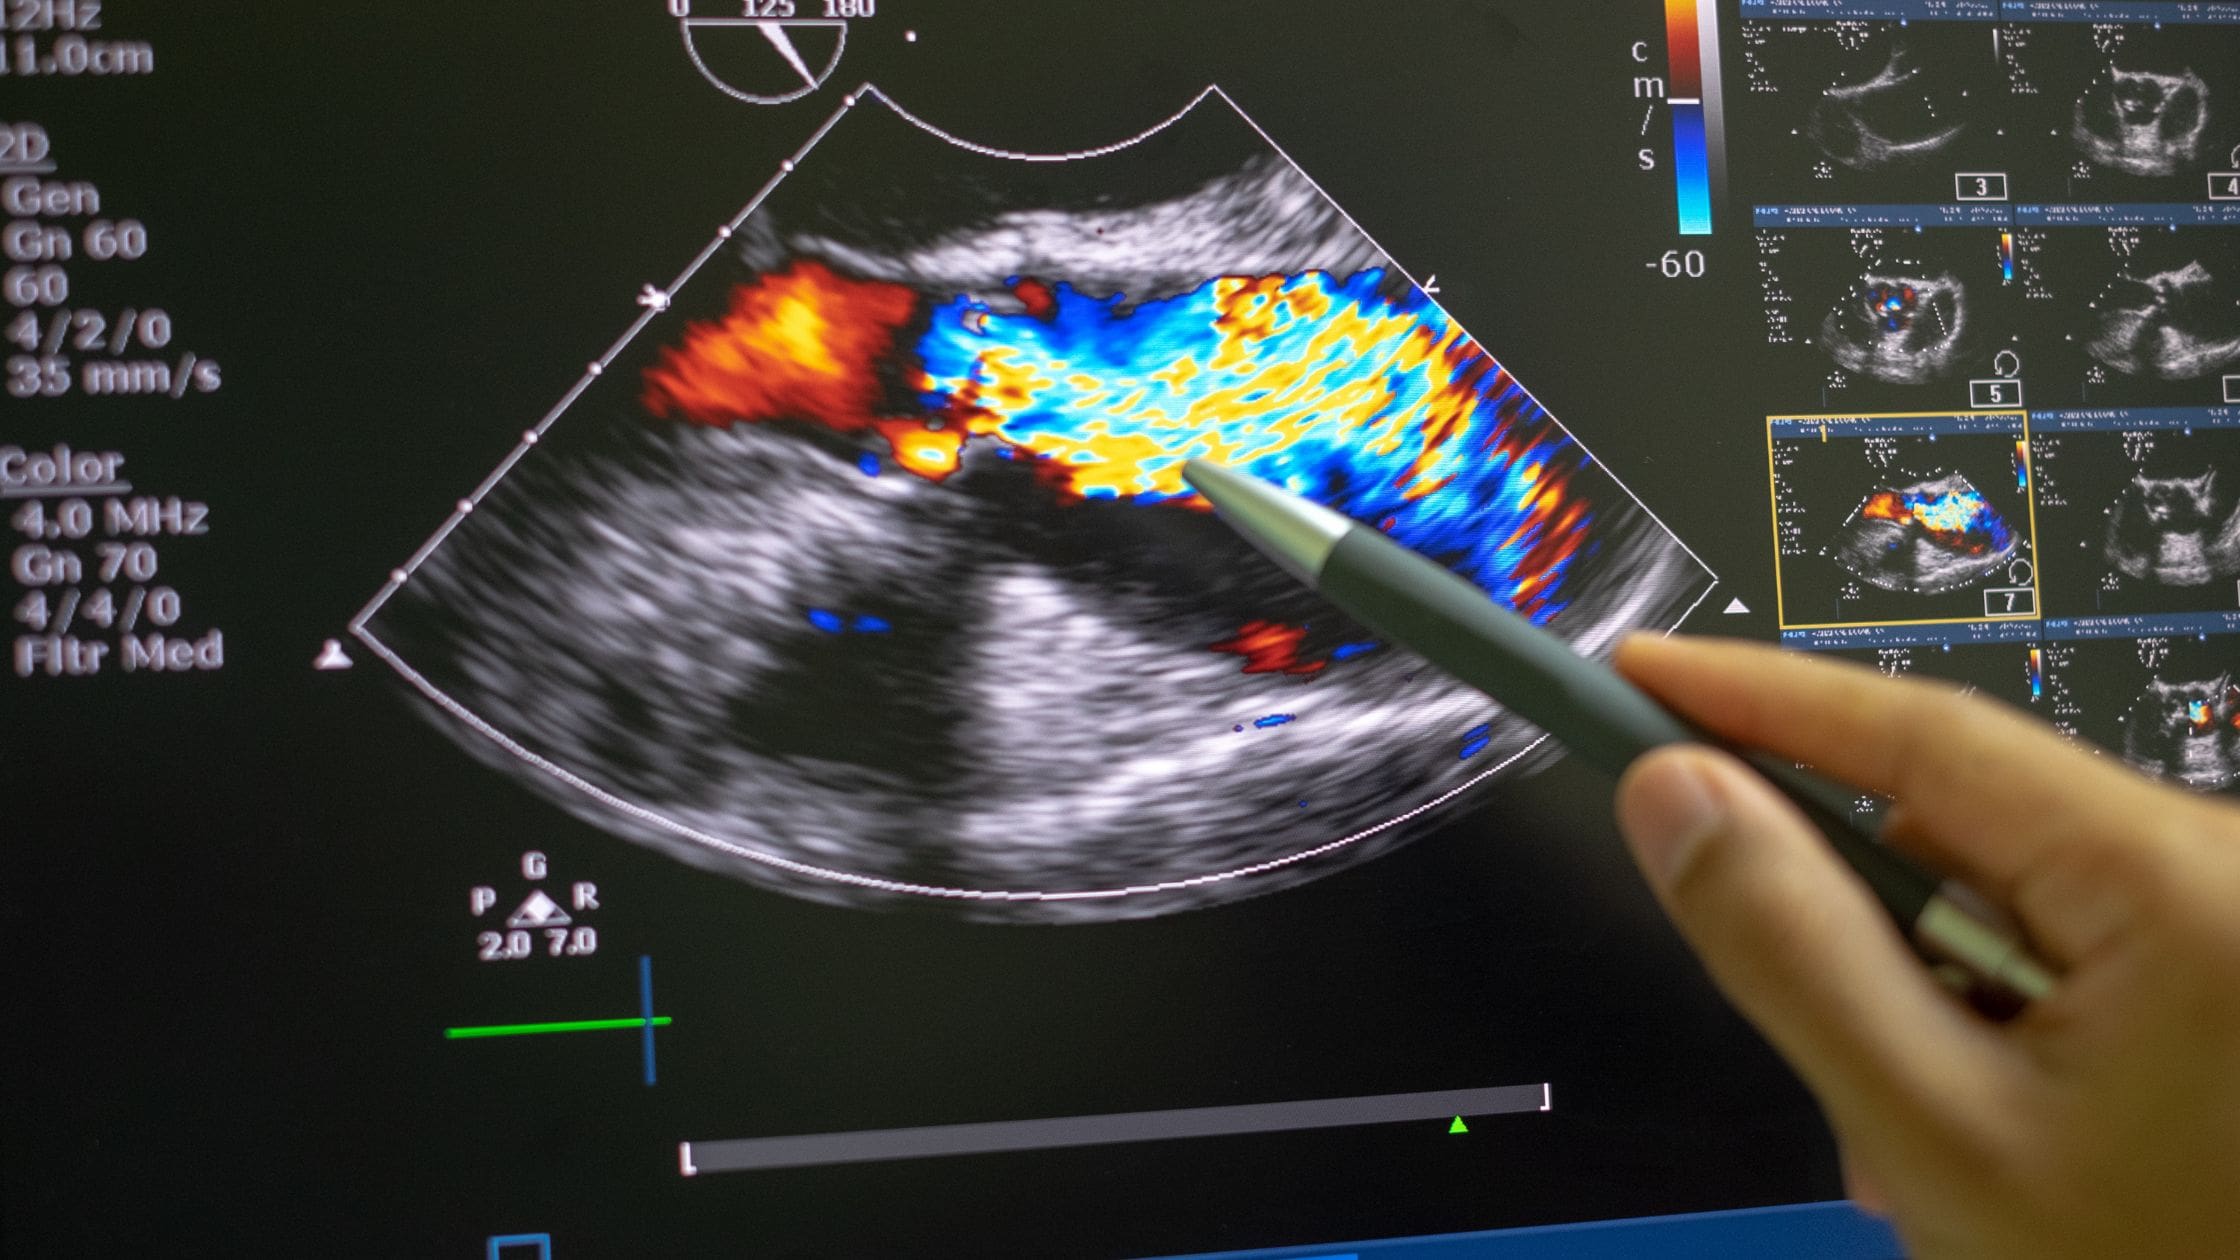
“Red” is the standardized color assigned by the software to represent flow moving toward the transducer. It is important to clarify a common misconception: red does not inherently mean “artery,” and blue does not inherently mean “vein.” Instead, these colors indicate directionality relative to the probe’s orientation.
The technology relies on an Autocorrelator, a high-speed digital signal processor that analyzes multiple pulses to determine the mean Doppler frequency shift. This processor must handle massive amounts of data in milliseconds to ensure the color overlay matches the grayscale anatomical image (B-mode) without lag. The sophistication of this tech allows for the visualization of “velocity maps,” where the intensity of the red can indicate the speed and turbulence of the flow.
Transducer Innovation: How Hardware Captures Real-Time Data
The hardware responsible for generating the “red” signals is the ultrasound transducer, a masterpiece of material science and electrical engineering. The transition from manual scanning to the high-speed color imaging we see today is largely due to advancements in piezoelectric materials and multi-element array designs.
Piezoelectric Crystals and Pulse-Wave Technology
Modern transducers utilize synthetic piezoelectric ceramics or single-crystal materials that convert electrical energy into mechanical vibrations (sound) and vice versa. To generate a Color Doppler image, the transducer must perform “duplex” or “triplex” scanning. This means the hardware is simultaneously capturing the structural B-mode image and the Doppler flow data.
This requires rapid-fire pulsing. The hardware must be capable of a high Pulse Repetition Frequency (PRF). If the PRF is too low, the system suffers from “aliasing,” a digital artifact where the flow appears to change direction or color incorrectly. The engineering challenge has been to create transducers that can maintain high sensitivity and depth penetration while firing pulses fast enough to capture rapid cardiac or arterial flow accurately.
Minimizing Noise through Digital Filtering
One of the greatest hurdles in ultrasound tech is distinguishing the movement of blood from the movement of the surrounding tissue (clutter). Tissue moves at a much higher amplitude but lower velocity than blood.
To solve this, developers integrated “Wall Filters” or high-pass filters into the software. These digital filters effectively “cull” the low-frequency shifts caused by vessel wall movement or breathing, allowing only the high-frequency signals from blood flow to be color-coded. When you see a clean red signal on an ultrasound, you are seeing the result of aggressive real-time digital noise cancellation.
The UI/UX of Diagnostic Imaging: Why Red and Blue?
The decision to use red and blue for Doppler imaging is a deliberate choice in user interface design. In the early days of medical tech, engineers needed a way to provide an intuitive “at-a-glance” understanding of complex hemodynamics.
Standardizing Color Flows for Global Interoperability
The industry adopted the BART convention: Blue Away, Red Toward. By standardizing this across all software platforms—from high-end hospital consoles to portable handheld devices—the tech industry ensured that data could be interpreted consistently by professionals regardless of the hardware manufacturer.
The UI also includes a “Color Map” or “Color Bar” on the side of the screen. This is a dynamic legend that shows the operator which color represents which direction and the maximum velocity the system is currently tuned to detect. Advanced software now allows for “Variance Mapping,” where green or yellow is added to the red to indicate turbulence—a critical data point for identifying mechanical failures in hardware like heart valves or narrowing in vascular stents.
Enhancing Resolution with Power Doppler Tech
While standard Color Doppler (which uses red and blue) is excellent for direction, it often struggles with very slow flow or tiny vessels. To address this, tech developers created Power Doppler. Unlike standard Doppler, which focuses on frequency shift (direction), Power Doppler focuses on the amplitude of the signal.
In Power Doppler mode, the “red” often takes on a more uniform, golden-orange hue. This tech is far more sensitive, allowing for the visualization of blood flow in organs where standard directionality is less important than simply knowing if perfusion is occurring. This advancement has been pivotal in the development of oncology-related tech, where detecting the microscopic blood supply of a tumor is essential.
The Future of Ultrasound: AI and Predictive Analysis
As we move deeper into the era of digital health, the technology behind the “red” on an ultrasound is being augmented by Artificial Intelligence (AI) and Machine Learning (ML). The next generation of ultrasound technology is moving beyond simple visualization and into the realm of automated quantification.
Machine Learning in Hemodynamic Monitoring
New software suites are being integrated into ultrasound hardware that can automatically identify vessels and calculate flow volumes without manual input. These AI models are trained on millions of Doppler images, allowing the system to recognize the “red” and “blue” patterns and immediately flag anomalies such as stenotic jets or regurgitant flow.
This reduces the “operator dependence” that has historically limited ultrasound. By using computer vision, the software can ensure the transducer is at the optimal “Doppler Angle” (ideally 60 degrees or less) to get the most accurate velocity reading. If the angle is off, the AI can provide real-time feedback to the user to adjust the hardware, ensuring the integrity of the data.

Cloud-Based Processing and Remote Diagnostics
The miniaturization of ultrasound hardware has led to the rise of Point-of-Care Ultrasound (POCUS). These are handheld devices that plug into a smartphone or tablet. The challenge for these gadgets is the limited processing power available on a mobile chip compared to a 500-pound hospital console.
The solution has been cloud-based signal processing. The raw acoustic data is captured by the handheld transducer, sent to a high-powered server via 5G or Wi-Fi, processed through Doppler algorithms, and returned to the screen as a color-coded image in near real-time. This allows a technician in a remote area to capture high-fidelity “red and blue” flow data that was once only possible in a specialized imaging center.
The “red” on an ultrasound is a window into the intersection of physics, hardware engineering, and advanced software. It represents decades of innovation in how we capture, process, and display the invisible movements within the human body. As transducers become more sensitive and AI becomes more integrated, the clarity and utility of these color-coded signals will continue to define the frontier of diagnostic technology.
aViewFromTheCave is a participant in the Amazon Services LLC Associates Program, an affiliate advertising program designed to provide a means for sites to earn advertising fees by advertising and linking to Amazon.com. Amazon, the Amazon logo, AmazonSupply, and the AmazonSupply logo are trademarks of Amazon.com, Inc. or its affiliates. As an Amazon Associate we earn affiliate commissions from qualifying purchases.