
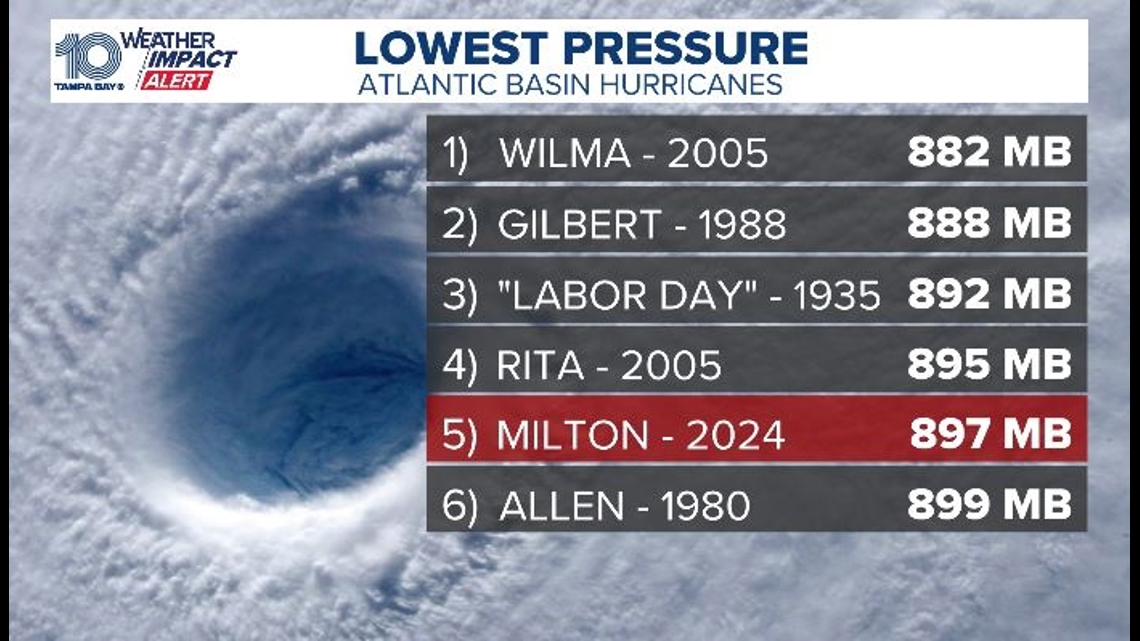
In the realm of modern meteorology, a hurricane is not merely a weather event; it is a massive, complex data set. When forecasters discuss “low pressure,” they are identifying the primary metric used by digital systems to quantify the potential energy and destructive power of a tropical cyclone. In technical terms, the lower the central pressure of a hurricane, the more intense the storm is likely to be. This relationship forms the basis for the algorithms that power our most advanced forecasting models. Understanding what low pressure means requires a deep dive into the technology of atmospheric measurement, the software used for predictive modeling, and the hardware that braves the eye of the storm to collect these critical data points.

The Mechanics of Atmospheric Data: Decoding Low Pressure
At its core, atmospheric pressure is the weight of the air above a specific point. In a standard environment, this is measured at approximately 1013.25 millibars (mb) or hectopascals (hPa). When a hurricane forms, it creates a localized area where air is rising rapidly, leaving behind a “deficit” of air at the surface—this is the low-pressure center. For tech-driven meteorological platforms, this pressure reading is the “pulse” of the storm.
From Mercury to Digital: The Evolution of Barometric Measurement
The history of measuring pressure has transitioned from physical mercury columns to high-precision digital MEMS (Micro-Electro-Mechanical Systems) sensors. Modern digital barometers utilize silicon-based pressure sensors that translate physical force into an electrical signal. These sensors are calibrated to account for temperature fluctuations and altitude, providing a level of accuracy that was impossible three decades ago. In the context of a hurricane, these sensors must be capable of operating in extreme conditions, often integrated into automated weather stations or ruggedized handheld devices used by field technicians.
Quantifying the Vacuum: The Pressure-Wind Relationship in Algorithms
The “pressure gradient” is the technological bridge between a pressure reading and a wind speed forecast. Digital models use the Pressure Gradient Force (PGF) equation to determine how quickly air will rush from high-pressure areas toward the low-pressure center. Software suites like the Weather Research and Forecasting (WRF) model ingest central pressure data to simulate the velocity of these winds. A significant drop in pressure—say, from 980 mb to 940 mb—indicates a steepening gradient, which the software interprets as an imminent spike in sustained wind speeds. This data is critical for emergency management software that triggers automated alerts based on predefined intensity thresholds.
High-Tech Reconnaissance: The Gadgets That Probe the Eye
While satellites provide a macro-view of a hurricane, the most precise pressure data comes from hardware that physically enters the storm. The technology used in “Hurricane Hunter” missions represents the pinnacle of mobile atmospheric sensing, involving a suite of specialized gadgets designed to capture a 3D snapshot of the storm’s core.
Dropsondes: The Smart Sensors Falling Through the Storm
The most vital tool for measuring low pressure is the dropsonde. This is a cylindrical instrument package, roughly the size of a cardboard tube, packed with sophisticated electronics. As it is released from an aircraft like the Lockheed WP-3D Orion, it descends via parachute, transmitting real-time data back to the plane via a radio frequency link.
The dropsonde contains a GPS receiver for tracking wind speed and direction, alongside a pressure sensor (baristor) and a thermistor. The tech inside these devices must be incredibly resilient, as they fall through the eyewall where turbulence is extreme. The data packets sent by dropsondes are ingested by the onboard “Mission Data System,” which then relays the information to the National Hurricane Center via satellite uplink (SATCOM). This real-time telemetry allows meteorologists to see exactly how low the pressure has fallen at the surface, which is often much lower than what satellite estimates suggest.
Stepped-Frequency Microwave Radiometers (SFMR)
Another key piece of hardware is the “Smurf” or SFMR. Mounted on the wing of a reconnaissance aircraft, this sensor measures the microwave radiation emitted by the sea surface. As wind speeds increase and pressure drops, the sea surface becomes a chaotic mix of foam and spray. The SFMR’s software filters through the “noise” of the rain to calculate surface wind speeds and correlates them with the central pressure readings. This creates a multi-layered digital profile of the hurricane’s intensity, allowing for more accurate categorization on the Saffir-Simpson scale.
Predictive Modeling: How AI Interprets Pressure Drops
The current frontier of hurricane analysis is the integration of Artificial Intelligence (AI) and Machine Learning (ML). Traditionally, forecasting was reliant on dynamical models that solved complex fluid dynamics equations—a process that requires massive supercomputing power. Today, AI tools are being trained to recognize the “signatures” of low pressure and what they portend for the future of the storm.
Machine Learning and Rapid Intensification Patterns
One of the most dangerous phenomena in tropical meteorology is “rapid intensification,” defined as a drop in central pressure of at least 42 mb in 24 hours. AI models, such as those developed using neural networks, are fed decades of historical satellite imagery and pressure data. These tools can identify subtle patterns in cloud temperature and rotation that precede a massive pressure drop. By training on these datasets, the AI can predict a “deepening” of the low-pressure center hours before traditional models, giving digital security and emergency platforms more time to prepare infrastructure.
High-Performance Computing (HPC) and Data Assimilation
The sheer volume of data generated by sensors, satellites, and radar during a hurricane requires High-Performance Computing (HPC) clusters. These supercomputers perform “data assimilation,” a process where real-time observations of low pressure are merged with the model’s previous predictions to create an updated forecast. This is a recursive software process that minimizes the “error covariance,” ensuring that the digital representation of the storm matches reality as closely as possible. Companies like NVIDIA and IBM are increasingly involved in creating these specialized architectures to handle the trillions of calculations per second required for high-resolution storm surge and pressure modeling.
The Digital Infrastructure of Modern Meteorology
When we talk about what low pressure means, we must also consider the digital infrastructure that transmits, stores, and protects this data. A hurricane is a threat to the very systems we use to monitor it, making tech resilience a top priority for meteorological agencies.
Satellite Constellations and Remote Sensing
In regions where aircraft cannot reach, satellite technology provides the necessary data. The GOES-R (Geostationary Operational Environmental Satellite) series uses the Advanced Baseline Imager (ABI) to monitor storms. While satellites cannot directly “weigh” the air to find pressure, they use infrared and microwave sounders to measure the temperature profile of the atmosphere. Meteorologists use the “Dvorak Technique,” which has been digitized into the Advanced Dvorak Technique (ADT), to estimate central pressure based on the cloud patterns and the temperature difference between the warm eye and the cold cloud tops. This software-driven estimation is vital for tracking storms in the open ocean where physical sensors are absent.
Edge Computing and Data Resilience in Extreme Conditions
As a hurricane makes landfall, the infrastructure for transmitting pressure data faces physical destruction. This is where edge computing becomes essential. Automated Surface Observing Systems (ASOS) are designed with “edge” capabilities, meaning they can process and store data locally even if their connection to the central cloud is severed. These systems utilize low-power wide-area networks (LPWAN) and satellite backups to ensure that the “bottoming out” of the pressure—the moment the eye passes over—is recorded and transmitted.
Furthermore, the cybersecurity of this data is paramount. Meteorological data is a critical national asset. Digital security protocols ensure that the feeds from weather stations and satellites are protected from spoofing or unauthorized access, which could lead to false alarms or the manipulation of public safety information.

Conclusion: The Synthesis of Pressure and Technology
Ultimately, low pressure in a hurricane is the digital signal of an atmospheric engine working at high capacity. To the technologist, it is a variable in a complex equation of fluid dynamics and thermodynamics. Through the use of MEMS sensors, dropsonde hardware, AI-driven predictive modeling, and resilient satellite networks, we have moved from simply reacting to a storm to digitally deconstructing it.
The lower the pressure, the higher the demand on our technological systems to provide accurate, timely, and actionable data. As AI continues to evolve and sensors become even more precise, our ability to interpret what low pressure means will only improve, turning the chaos of a hurricane into a manageable stream of information that saves lives and protects infrastructure. Understanding this data point is not just about the weather—it is about the sophisticated technological ecosystem that monitors the pulse of our planet.
aViewFromTheCave is a participant in the Amazon Services LLC Associates Program, an affiliate advertising program designed to provide a means for sites to earn advertising fees by advertising and linking to Amazon.com. Amazon, the Amazon logo, AmazonSupply, and the AmazonSupply logo are trademarks of Amazon.com, Inc. or its affiliates. As an Amazon Associate we earn affiliate commissions from qualifying purchases.