In an increasingly data-driven world, terms like “big data,” “data analytics,” and “machine learning” are commonplace. At the heart of many of these advanced technological concepts lies a foundational principle: aggregate data. Far from being a niche technical jargon, understanding what aggregate data means is crucial for anyone navigating or contributing to the digital landscape. It’s the process of transforming scattered, granular pieces of information into cohesive, digestible, and actionable insights, underpinning everything from personalized recommendations to critical business decisions and scientific breakthroughs.
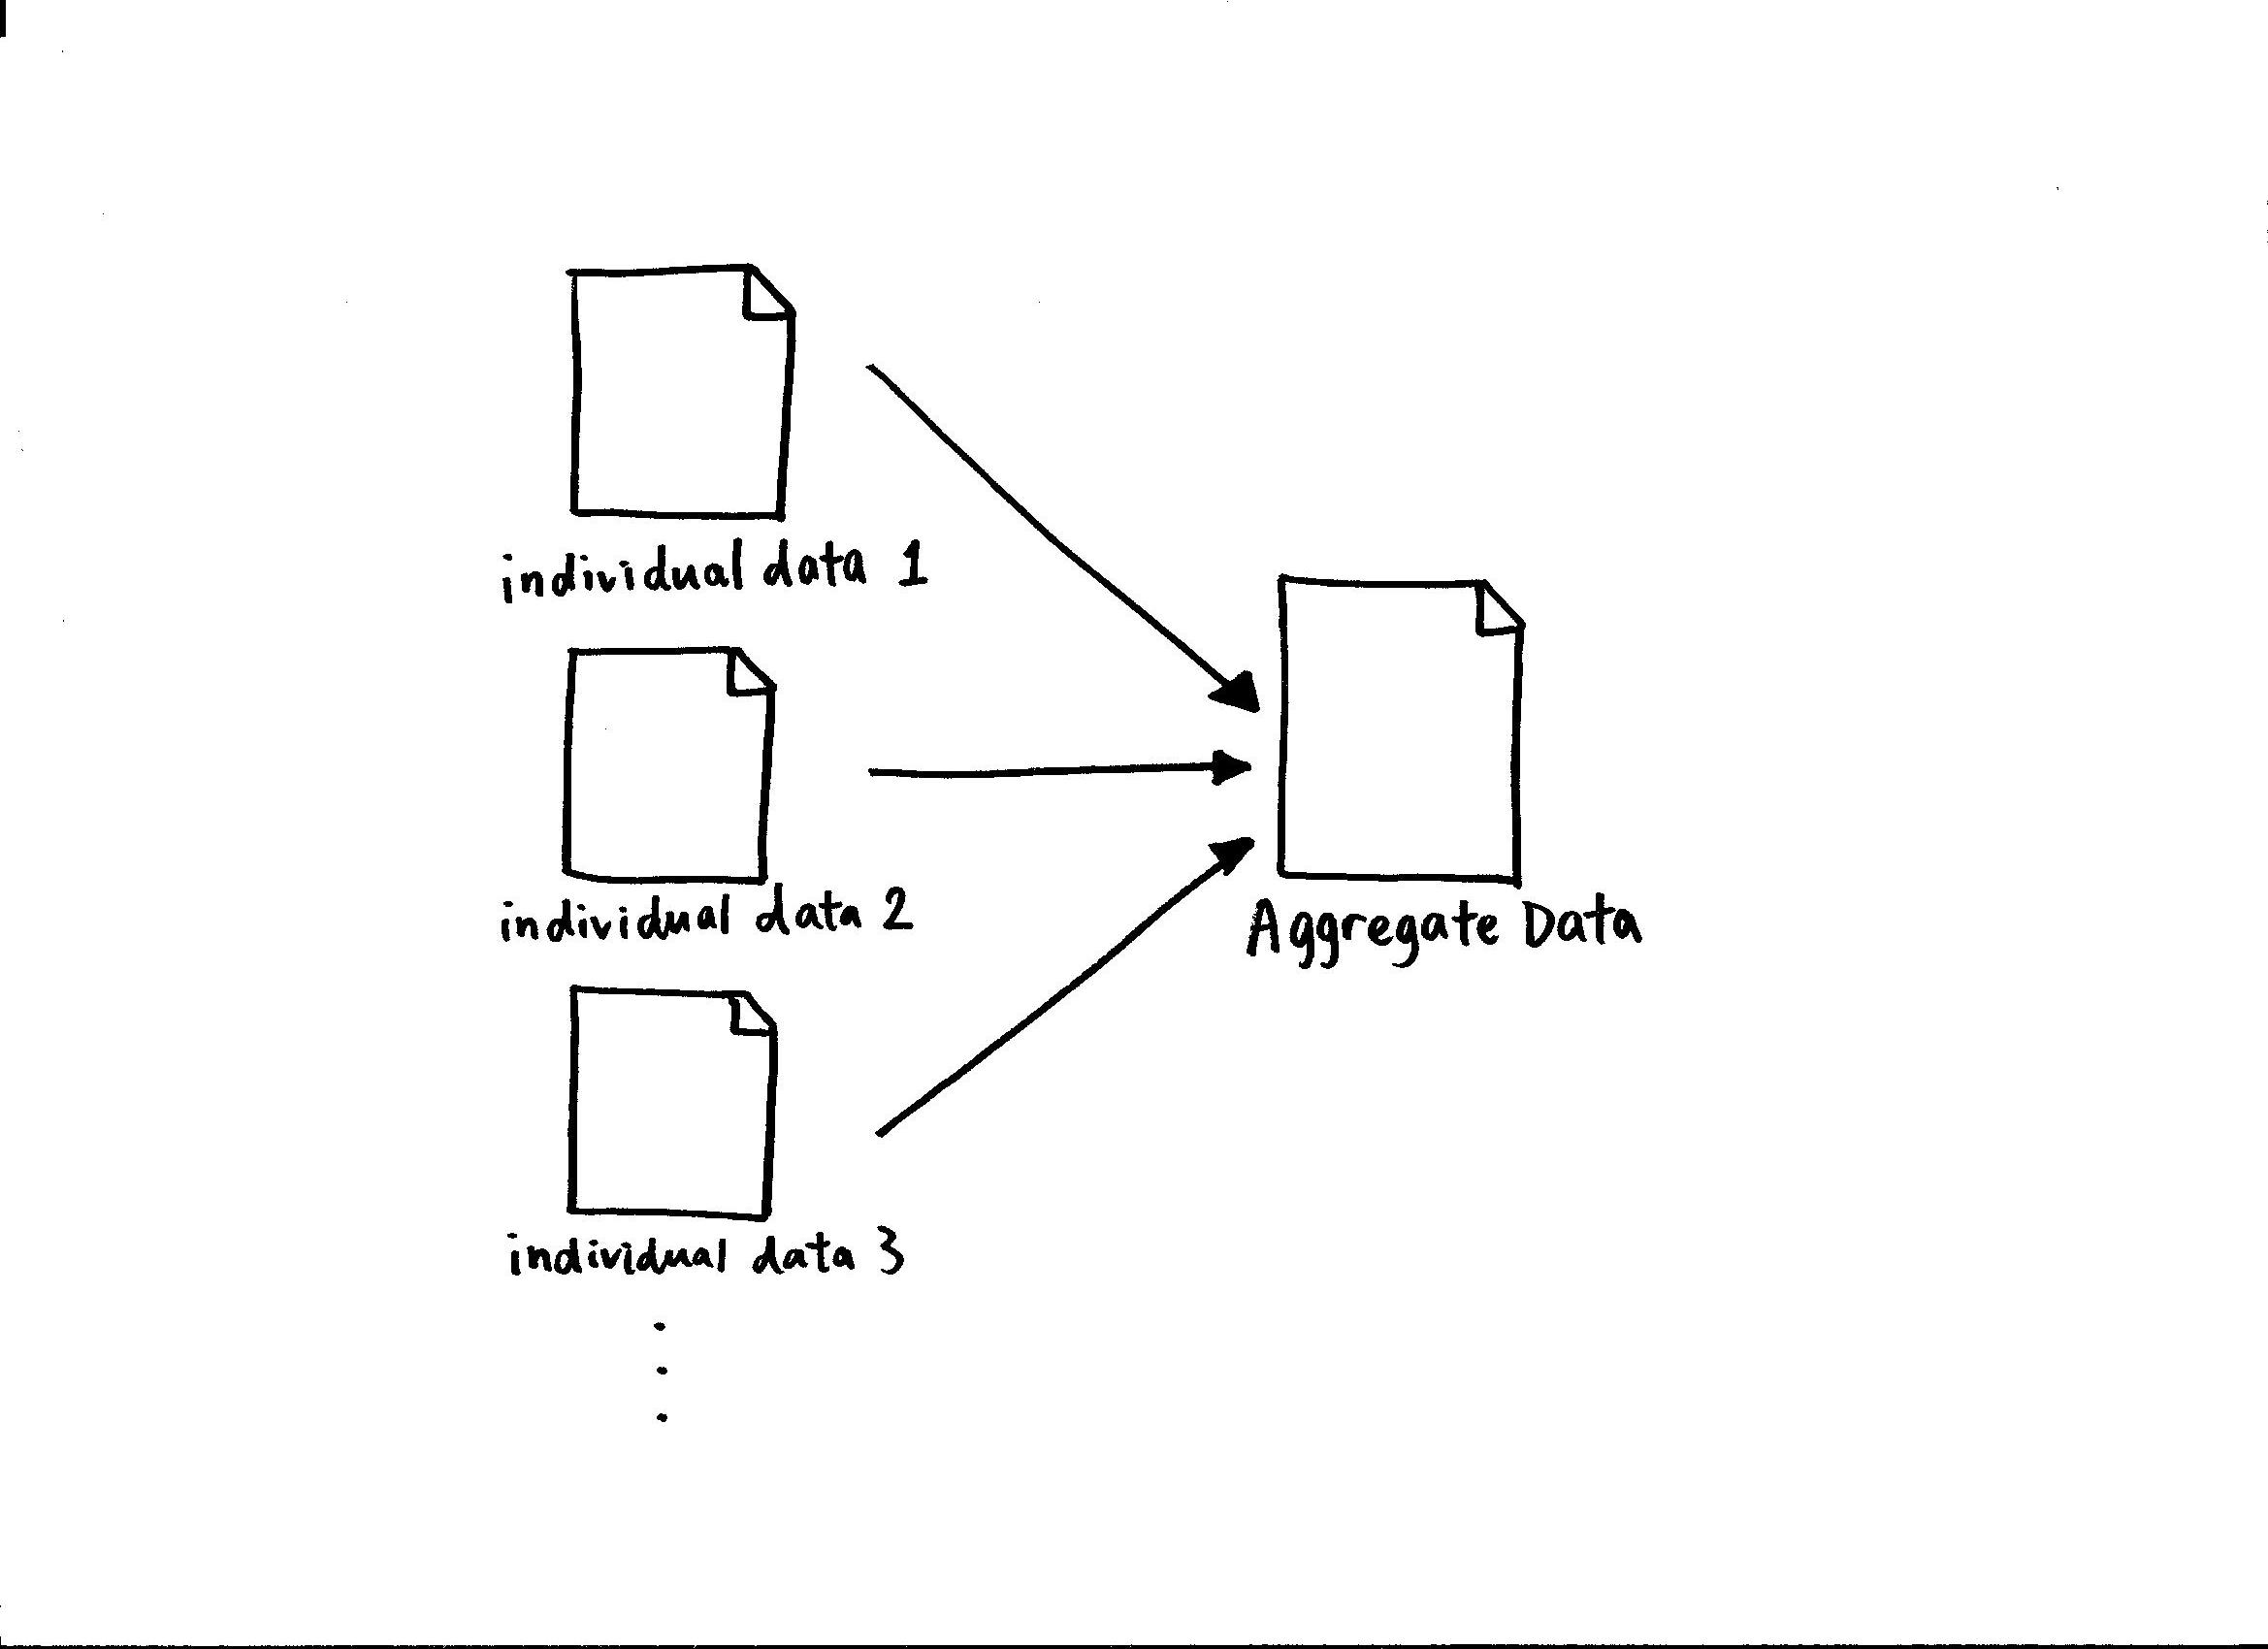
At its core, aggregate data refers to information that has been collected from multiple individual sources and compiled into a summary or a single, unified unit. Instead of looking at each individual data point separately, aggregation involves grouping these points and performing calculations or operations (like sum, average, count, minimum, or maximum) to reveal broader trends, patterns, and overarching characteristics. This transformation is not merely a simplification; it’s an essential step in making data meaningful, manageable, and useful for analysis and strategic planning in virtually every technological domain.
The Core Concept of Aggregate Data
To truly grasp the significance of aggregate data, one must first understand its fundamental definition and the transformative journey it facilitates, moving from raw, individual records to powerful, summarized insights. This process is a cornerstone of modern data management and analytics.
Defining Aggregation in Data Science
Aggregation, in the context of data science and technology, is the process of collecting and compiling information from various sources to produce a summarized dataset. Imagine a vast collection of individual sales transactions from a global e-commerce platform. Each transaction represents a single data point: a specific product bought by a specific customer at a specific time for a specific price. While valuable on its own, examining millions or billions of such individual transactions makes it impossible to discern overall performance or identify trends.
This is where aggregation comes in. By applying aggregation functions, we can transform this raw data. For instance:
- Sum: Calculating the total revenue generated from all sales in a particular region.
- Average: Determining the average order value across all customers.
- Count: Identifying the total number of unique customers who made a purchase.
- Minimum/Maximum: Finding the lowest or highest price paid for a specific product.
- Group By: Grouping sales data by product category to see which categories are most popular, then applying aggregation functions to each group (e.g., sum of sales per category).
These operations condense large volumes of detailed data into concise, interpretable metrics. The resulting aggregate data doesn’t tell you about a single customer’s purchase, but it reveals the collective behavior and performance of the entire customer base or a specific segment.
From Raw Data to Actionable Insights
The journey from raw data to actionable insights is often spearheaded by aggregation. Raw data, in its most granular form, can be overwhelming and, paradoxically, less informative for strategic decision-making because of its sheer volume and lack of context. It’s like having every single brick that built a house scattered on the ground – you have all the components, but no understanding of the structure or purpose.
Aggregation acts as the architect, assembling these individual bricks into discernible walls, rooms, and ultimately, a complete structure. By summarizing data, analysts and decision-makers can:
- Identify Trends: Spot patterns over time (e.g., seasonal sales peaks, declining customer engagement).
- Compare Performance: Benchmark different products, regions, or marketing campaigns against each other.
- Detect Anomalies: Pinpoint deviations from expected aggregate behavior, which might indicate fraud, system errors, or emerging issues.
- Simplify Reporting: Create concise dashboards and reports that convey key performance indicators (KPIs) without drowning stakeholders in detail.
Without aggregation, the vast oceans of data generated daily would remain largely untapped, rendering many sophisticated analytical tools and AI models significantly less effective. It’s the essential first step in refining data to extract its inherent value.
Why Aggregate Data Matters in Technology
Aggregate data is not just a statistical curiosity; it’s a foundational pillar upon which much of modern technology operates. Its impact ripples across various tech disciplines, enhancing efficiency, driving intelligence, ensuring privacy, and powering sophisticated algorithms.
Enhanced Performance and Efficiency
One of the most immediate benefits of data aggregation in a technological context is the significant improvement in performance and efficiency. Dealing with petabytes of raw, granular data for every query or analysis is computationally intensive and slow. By aggregating data, the volume of information that needs to be processed, stored, and transmitted is drastically reduced.
- Faster Querying: Database queries on aggregated tables or materialized views execute much quicker than queries scanning billions of raw records.
- Reduced Storage Costs: Storing summarized data requires less space than storing every single transaction or event log.
- Optimized Network Traffic: Less data needs to be moved across networks for reporting or dashboard updates, improving application responsiveness.
This efficiency is critical for real-time analytics, large-scale data processing, and maintaining responsive applications that serve millions of users.
Driving Business Intelligence and Analytics
Business Intelligence (BI) and data analytics platforms rely heavily on aggregate data. These systems are designed to help organizations make informed decisions by providing insights into their operations.
- Dashboards and Reports: Most BI dashboards display KPIs like total sales, average customer lifetime value, or website traffic, all of which are aggregate metrics.
- Trend Analysis: By aggregating data over time (e.g., daily, weekly, monthly sales totals), businesses can identify growth patterns, seasonal fluctuations, and long-term trends.
- Performance Monitoring: Teams monitor aggregated metrics against targets to assess progress and identify areas needing intervention.
From sales forecasting to supply chain optimization and customer segmentation, aggregate data provides the bird’s-eye view necessary for strategic business moves.
Fueling Machine Learning and AI
Machine Learning (ML) and Artificial Intelligence (AI) models frequently utilize aggregate data, both in their training phases and for real-time predictions.
- Feature Engineering: Aggregation is often a crucial step in feature engineering, where raw data is transformed into features (variables) that ML models can learn from. For example, instead of feeding a model every single website click, it might be more useful to aggregate clicks per user per session to represent user engagement.
- Pattern Recognition: AI systems designed to detect anomalies or predict outcomes often work with aggregated patterns. In fraud detection, for instance, a sequence of individually small, rapid transactions might be less suspicious than an aggregated sum exceeding a threshold within a short period.
- Summarization for Context: For natural language processing (NLP) models, aggregating sentiment scores from multiple reviews can give an overall product rating.
While deep learning can sometimes work directly with raw data, aggregation provides a powerful method to simplify complex inputs and highlight high-level patterns relevant for model training and inference.
Privacy and Anonymity Considerations
One of the most critical aspects where aggregate data plays a significant role is in protecting individual privacy. When data is aggregated, individual identities are often obscured or completely removed, as the focus shifts from specific persons to collective behaviors.
- GDPR and CCPA Compliance: Aggregated data, especially when properly anonymized and de-identified, can often be used for analytical purposes without triggering the same stringent privacy regulations that apply to personal identifiable information (PII).
- Public Reporting: Governments and research institutions frequently release aggregated demographic or health data to the public for statistical analysis, ensuring individual privacy while providing valuable insights into populations.
- Market Research: Companies can analyze aggregated consumer preferences and purchasing patterns to develop new products or marketing strategies without tracking or profiling individual customers explicitly.
This privacy-by-design approach makes aggregated data a powerful tool for ethical data utilization in an era of heightened privacy concerns, enabling insights without compromising individual rights.
Common Techniques and Tools for Data Aggregation
The process of data aggregation is not a monolithic operation; it involves a variety of techniques and utilizes a diverse ecosystem of tools, each suited for different scales and complexities of data. Mastering these is key to effective data management in tech.

Database Operations (SQL)
For structured data stored in relational databases, SQL (Structured Query Language) is the workhorse for aggregation. Its powerful built-in functions allow for flexible and efficient data summarization.
GROUP BYClause: This fundamental SQL clause is used to group rows that have the same values in specified columns into summary rows. For example,GROUP BY product_categorywill group all sales records for a specific product category.- Aggregation Functions: Once grouped, functions like
SUM(),AVG(),COUNT(),MIN(), andMAX()are applied to calculate aggregated values for each group. For instance,SELECT product_category, SUM(sales_amount) FROM orders GROUP BY product_category;would give total sales for each product category. HAVINGClause: Used in conjunction withGROUP BY,HAVINGfilters the groups based on aggregate conditions, similar to howWHEREfilters individual rows.
SQL remains an indispensable tool for data professionals, providing precise control over how data is aggregated and analyzed within a database.
Data Warehousing and ETL Processes
For large-scale business analytics, data is often moved from operational databases into a data warehouse – a central repository optimized for querying and reporting. This movement involves an ETL (Extract, Transform, Load) process, where aggregation plays a critical role in the ‘Transform’ stage.
- Extraction: Data is pulled from various source systems (CRM, ERP, transaction systems).
- Transformation: This is where data quality checks, standardization, and crucially, aggregation occur. Raw transaction data might be aggregated into daily or monthly summaries before being loaded. This pre-aggregation dramatically improves query performance in the data warehouse.
- Loading: The transformed and often aggregated data is then loaded into the data warehouse, typically into fact tables and dimension tables designed for analytical queries.
Data warehousing, with its emphasis on pre-aggregated and summarized data, is a cornerstone for robust Business Intelligence architectures, providing a historical and integrated view of an organization’s data.
Big Data Frameworks
When data volumes exceed the capabilities of traditional relational databases and data warehouses, big data frameworks come into play. These distributed computing platforms are designed to process massive datasets across clusters of machines.
- Apache Hadoop: Its MapReduce programming model is inherently aggregation-oriented. The “Map” phase processes individual records, and the “Reduce” phase aggregates the results across the cluster.
- Apache Spark: A faster and more versatile alternative to MapReduce, Spark’s RDD (Resilient Distributed Datasets) and DataFrame APIs offer powerful aggregation capabilities, including
groupByand various aggregate functions, allowing for complex analytics on petabyte-scale data. - NoSQL Databases: Databases like MongoDB or Cassandra, while not primarily for complex analytical aggregation, can store vast amounts of raw data that can then be processed and aggregated using other big data tools or their own aggregation pipelines (e.g., MongoDB’s Aggregation Pipeline).
These frameworks enable organizations to extract value from truly immense and diverse datasets that would be impossible to handle with conventional methods, making large-scale aggregation feasible.
Business Intelligence Platforms
Tools like Tableau, Microsoft Power BI, Looker, and Qlik Sense are designed to visualize and interact with data, often leveraging pre-aggregated data from data warehouses or performing on-the-fly aggregation.
- Interactive Dashboards: These platforms allow users to drag-and-drop dimensions and measures, automatically performing aggregations (sums, averages) to create charts and tables instantly.
- Drill-Down Capabilities: Users can often “drill down” from an aggregated view (e.g., total sales by year) to more granular details (sales by month, then by day) if the underlying data supports it, demonstrating the interplay between different levels of aggregation.
- Self-Service Analytics: By providing intuitive interfaces for data exploration and aggregation, BI platforms empower business users to answer their own questions without needing deep technical expertise in SQL or big data frameworks.
These tools are the front-end for making aggregate data accessible and understandable to a wide range of users, transforming complex datasets into actionable visualizations.
Real-World Applications Across Tech Sectors
The power of aggregate data is best illustrated by its ubiquitous application across various tech sectors, where it provides the crucial insights needed for innovation, optimization, and problem-solving.
E-commerce and Retail Analytics
E-commerce giants and modern retailers are arguably some of the heaviest users of aggregate data.
- Sales Trend Analysis: Aggregating daily, weekly, or monthly sales figures helps identify popular products, peak shopping seasons, and the impact of marketing campaigns.
- Customer Behavior Insights: Aggregating website clicks, page views, and conversion rates allows retailers to understand user journeys, identify drop-off points, and optimize website design.
- Inventory Management: By aggregating sales data with inventory levels, businesses can forecast demand, prevent stockouts, and optimize warehouse logistics.
- Personalized Recommendations (indirectly): While recommendations are often individual, the underlying models are trained on aggregated data of what groups of users with similar profiles have purchased or viewed.
Healthcare and Public Health
In healthcare, aggregate data is vital for improving patient outcomes, managing resources, and tracking public health trends.
- Disease Surveillance: Aggregating anonymized patient data (symptoms, diagnoses, locations) allows public health agencies to track the spread of diseases, identify outbreaks, and allocate resources effectively (e.g., during pandemics).
- Treatment Efficacy: Researchers aggregate data from clinical trials to determine the effectiveness and side effects of new drugs or therapies across patient populations.
- Hospital Resource Allocation: Aggregating patient admissions, bed occupancy, and staff schedules helps hospitals optimize resource allocation, reduce wait times, and improve operational efficiency.
Smart Cities and IoT
The proliferation of IoT devices generates vast amounts of data, which when aggregated, forms the backbone of smart city initiatives.
- Traffic Management: Aggregating data from traffic sensors helps optimize traffic light timings, identify congestion hotspots, and improve urban mobility.
- Energy Consumption: Smart meters aggregate energy usage data, allowing utilities to manage grids more efficiently, detect anomalies, and encourage energy conservation.
- Environmental Monitoring: Aggregating data from air quality sensors, weather stations, and waste management systems helps cities identify environmental issues and implement sustainable policies.
Cybersecurity and Fraud Detection
In the realm of digital security, aggregate data plays a crucial role in identifying and mitigating threats.
- Anomaly Detection: By aggregating network traffic logs, system access attempts, and user behaviors, security systems can establish baselines of “normal” activity. Deviations from these aggregated baselines can signal potential cyber threats or intrusions.
- Fraud Pattern Recognition: Financial institutions aggregate transaction data from millions of users to identify common patterns of fraudulent activity. For example, a sudden increase in the number of small, international transactions from an account might trigger a flag based on aggregated risk profiles.
- Threat Intelligence: Cybersecurity firms aggregate threat data from various sources (e.g., malware samples, attack vectors) to build comprehensive threat intelligence platforms, helping organizations anticipate and defend against new attacks.
Challenges and Best Practices in Data Aggregation
While incredibly powerful, data aggregation is not without its challenges. Overcoming these requires careful planning, robust data governance, and a clear understanding of best practices to ensure the aggregated insights are accurate, meaningful, and ethically sound.
Data Granularity vs. Summarization
One of the primary challenges is finding the right balance between data granularity and summarization.
- Too Granular: Keeping data too granular can lead to overwhelming datasets that are slow to process and difficult to interpret.
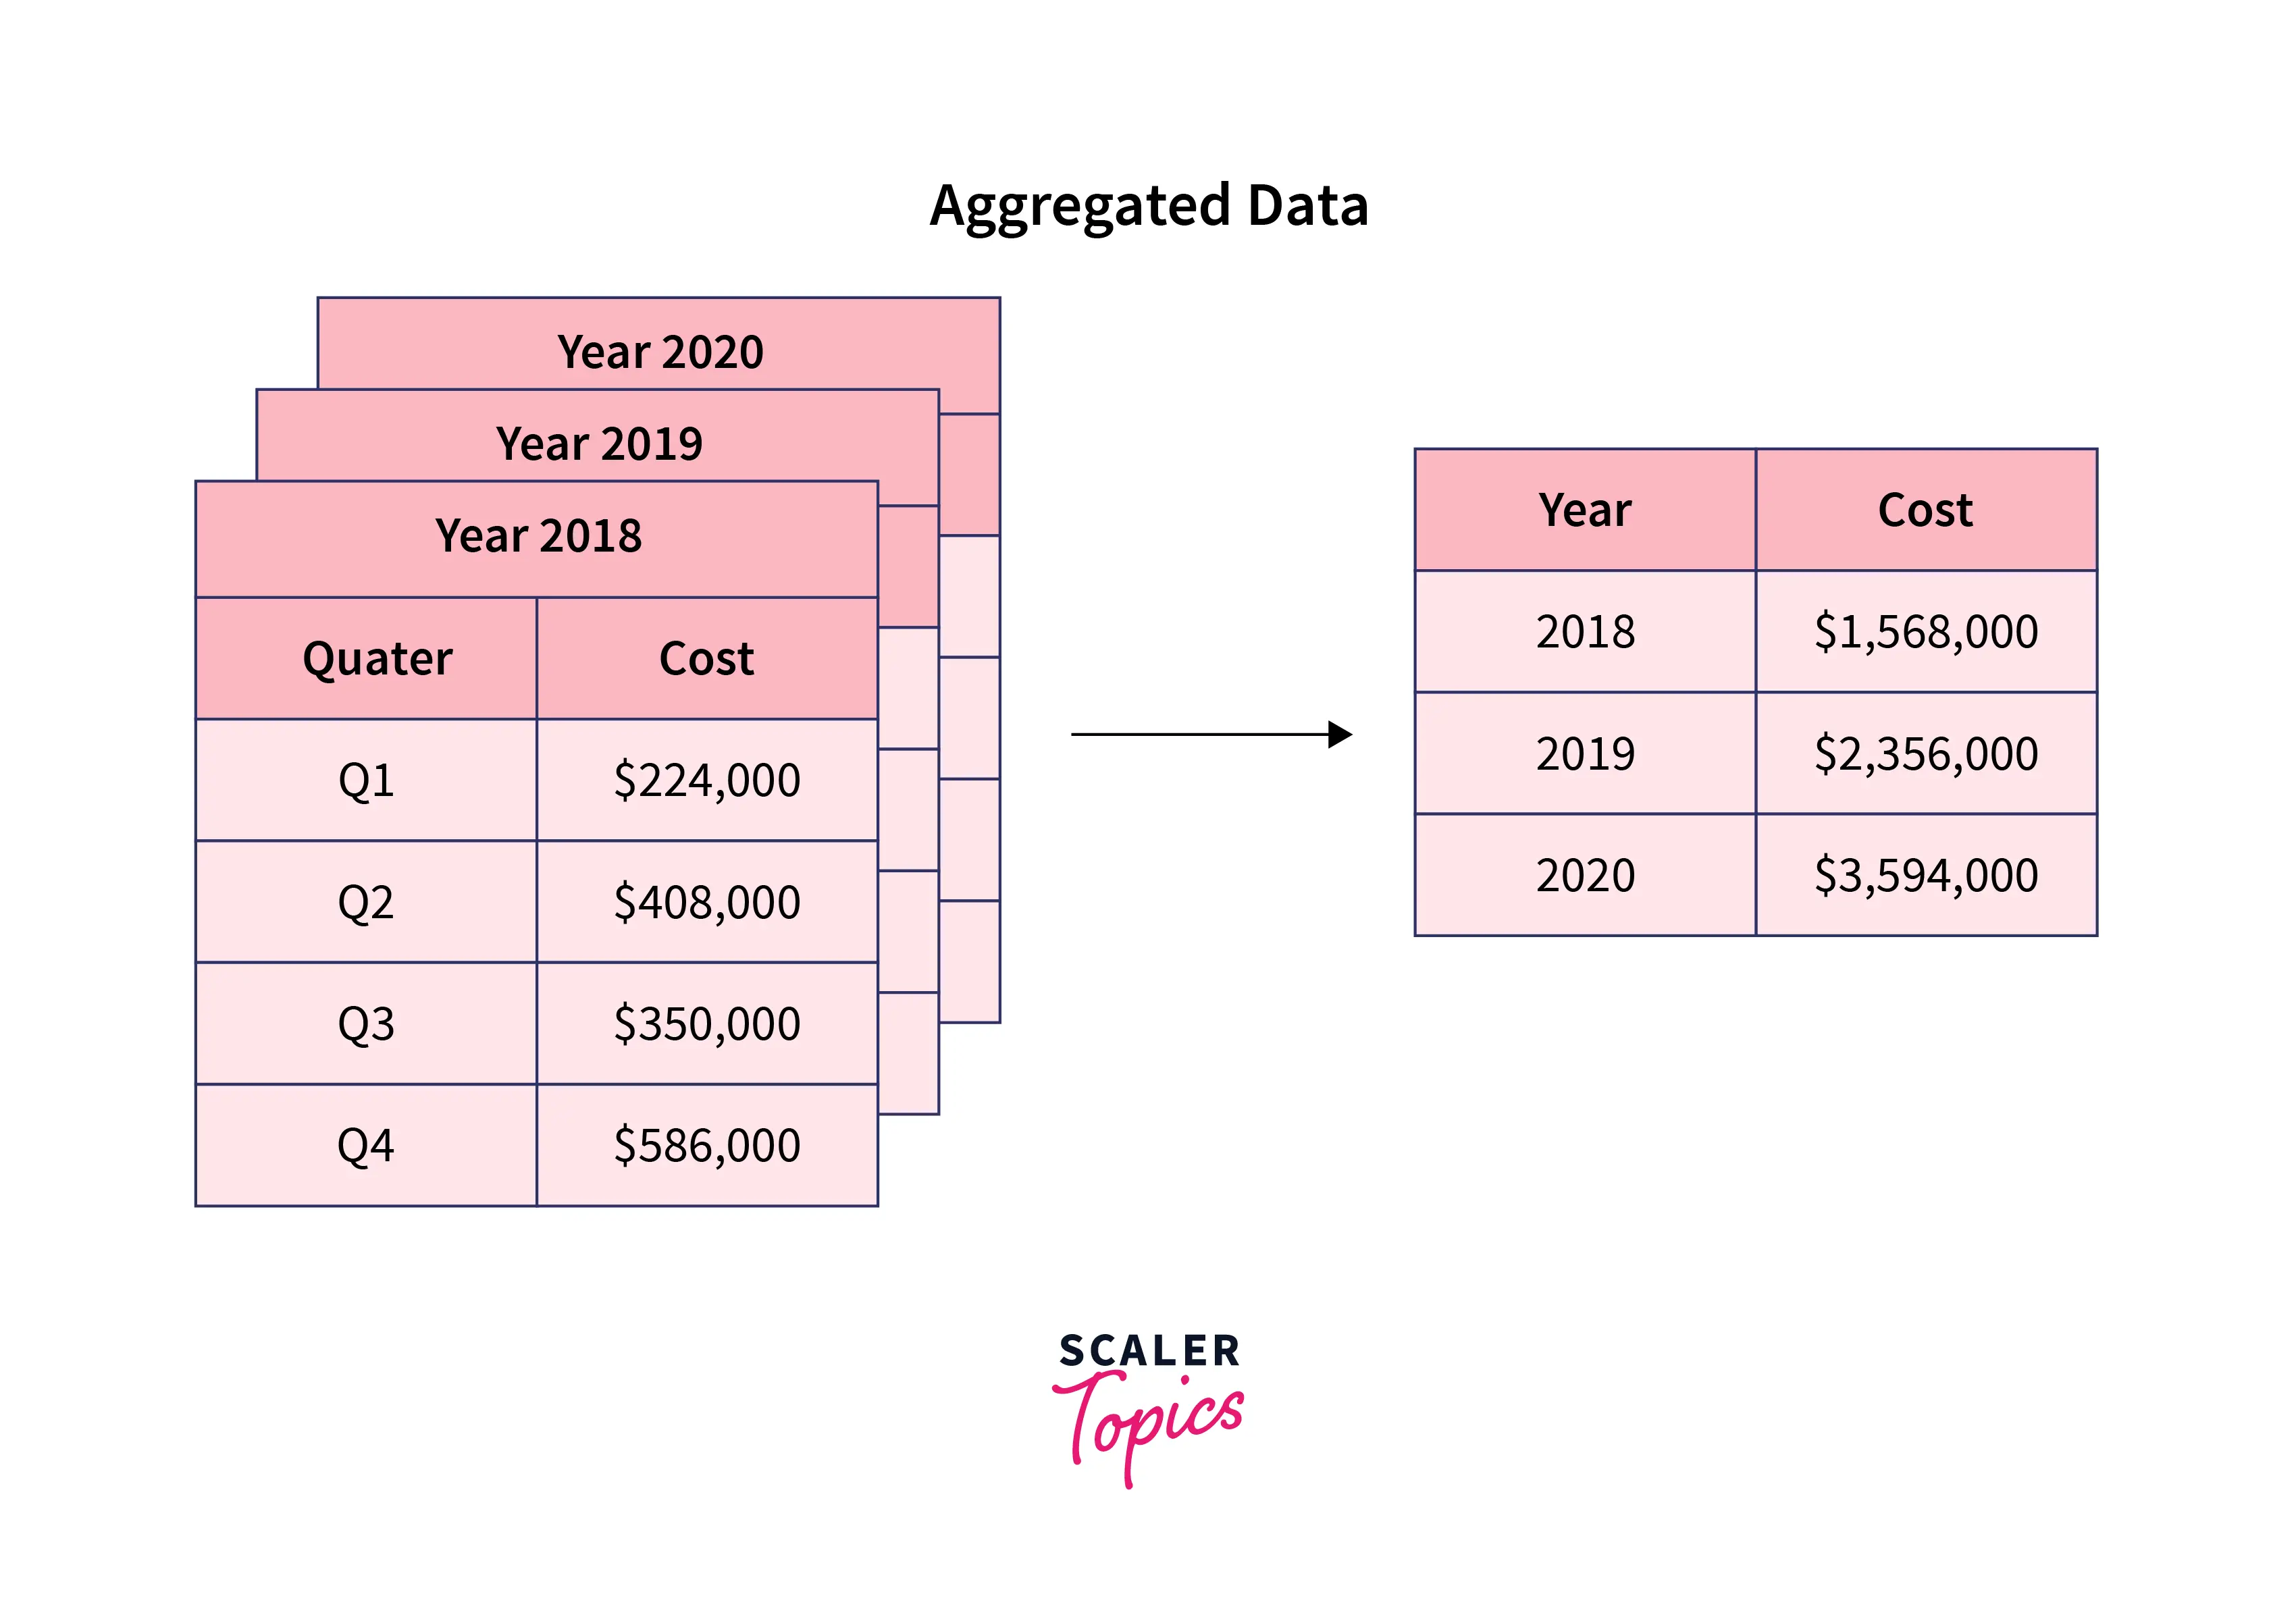
- Too Summarized: Over-aggregating can lead to a loss of critical detail, making it impossible to answer specific, nuanced questions or detect fine-grained patterns. For instance, aggregating all sales to just a yearly total might obscure important monthly trends.
Best Practice: Define clear analytical objectives. Design aggregation strategies that support various levels of detail, allowing for both high-level overviews and the ability to drill down to specific dimensions when needed. Often, data warehouses store data at different levels of aggregation to serve diverse analytical needs.
Ensuring Data Quality and Consistency
The principle of “garbage in, garbage out” is particularly relevant for data aggregation. If the underlying raw data is flawed, inconsistent, or incomplete, the aggregated results will be misleading.
- Inconsistent Formats: Dates, currencies, or categorical values may be stored in different formats across source systems.
- Missing Values: Gaps in data can skew averages and counts.
- Duplicates: Duplicate records can inflate sums and counts.
Best Practice: Implement robust data quality checks and data cleansing processes before aggregation. This includes standardization, de-duplication, handling missing values, and validating data types. Establishing clear data governance policies and maintaining data dictionaries are also crucial.
Ethical Considerations and Data Governance
The power of aggregate data comes with significant ethical responsibilities, particularly regarding bias, privacy, and responsible use.
- Bias Amplification: If the underlying data contains biases (e.g., historical discrimination in loan applications), aggregation can amplify and perpetuate these biases in models trained on the data.
- Re-identification Risk: While aggregation aims to protect privacy, sophisticated techniques (like linking with external datasets) can sometimes “re-identify” individuals from seemingly anonymized aggregate data.
- Misinterpretation: Aggregate statistics, especially averages, can mask significant variations or outliers within a group, leading to flawed conclusions.
Best Practice: Implement strong data governance frameworks, including ethical guidelines, privacy-preserving techniques (like differential privacy), and regular audits. Ensure transparency about data sources and aggregation methods. Train analysts to critically interpret aggregate data and be aware of potential biases and limitations.
Scalability and Performance Optimization
As data volumes continue to explode, ensuring that aggregation processes remain scalable and performant is a constant challenge.
- Processing Time: Aggregating petabytes of data can take hours or even days on inefficient systems.
- Resource Consumption: Large-scale aggregation demands significant computational resources (CPU, memory, storage).
- Concurrency: Multiple users or applications simultaneously requesting aggregated data can strain systems.
Best Practice: Leverage distributed computing frameworks (like Spark), optimize database queries and indexes, implement data partitioning, and utilize in-memory processing where feasible. Design data pipelines to incrementally aggregate new data rather than re-processing everything from scratch. Employ materialized views or pre-aggregated tables in data warehouses to serve frequently requested aggregate data.
Conclusion
Aggregate data is far more than a technical term; it is the lens through which modern technology understands, interprets, and acts upon the vast torrent of information generated every second. From enhancing the efficiency of our software applications to providing the bedrock for cutting-edge AI, enabling vital business intelligence, and safeguarding individual privacy, its role is indispensable.
By transforming raw, disparate data points into coherent summaries and meaningful insights, aggregation empowers individuals and organizations to identify patterns, make informed decisions, and innovate faster. While challenges related to granularity, quality, ethics, and scalability persist, a commitment to best practices ensures that the power of aggregate data can be harnessed responsibly and effectively. As our digital world continues to expand, a deep understanding of what aggregate data means will remain a fundamental requirement for anyone looking to build, analyze, or navigate the future of technology.
aViewFromTheCave is a participant in the Amazon Services LLC Associates Program, an affiliate advertising program designed to provide a means for sites to earn advertising fees by advertising and linking to Amazon.com. Amazon, the Amazon logo, AmazonSupply, and the AmazonSupply logo are trademarks of Amazon.com, Inc. or its affiliates. As an Amazon Associate we earn affiliate commissions from qualifying purchases.