
To the naked eye, a hurricane making landfall is a chaotic blur of grey horizontal rain, swaying structures, and debris. However, in the realm of modern technology, “what a hurricane looks like” is a vastly different story. Through the integration of advanced satellite arrays, hyper-local IoT sensors, and sophisticated artificial intelligence, technology has allowed us to see through the storm. We no longer rely on grainy footage; instead, we visualize hurricanes through high-fidelity data streams that map pressure, wind velocity, and moisture content in real-time.
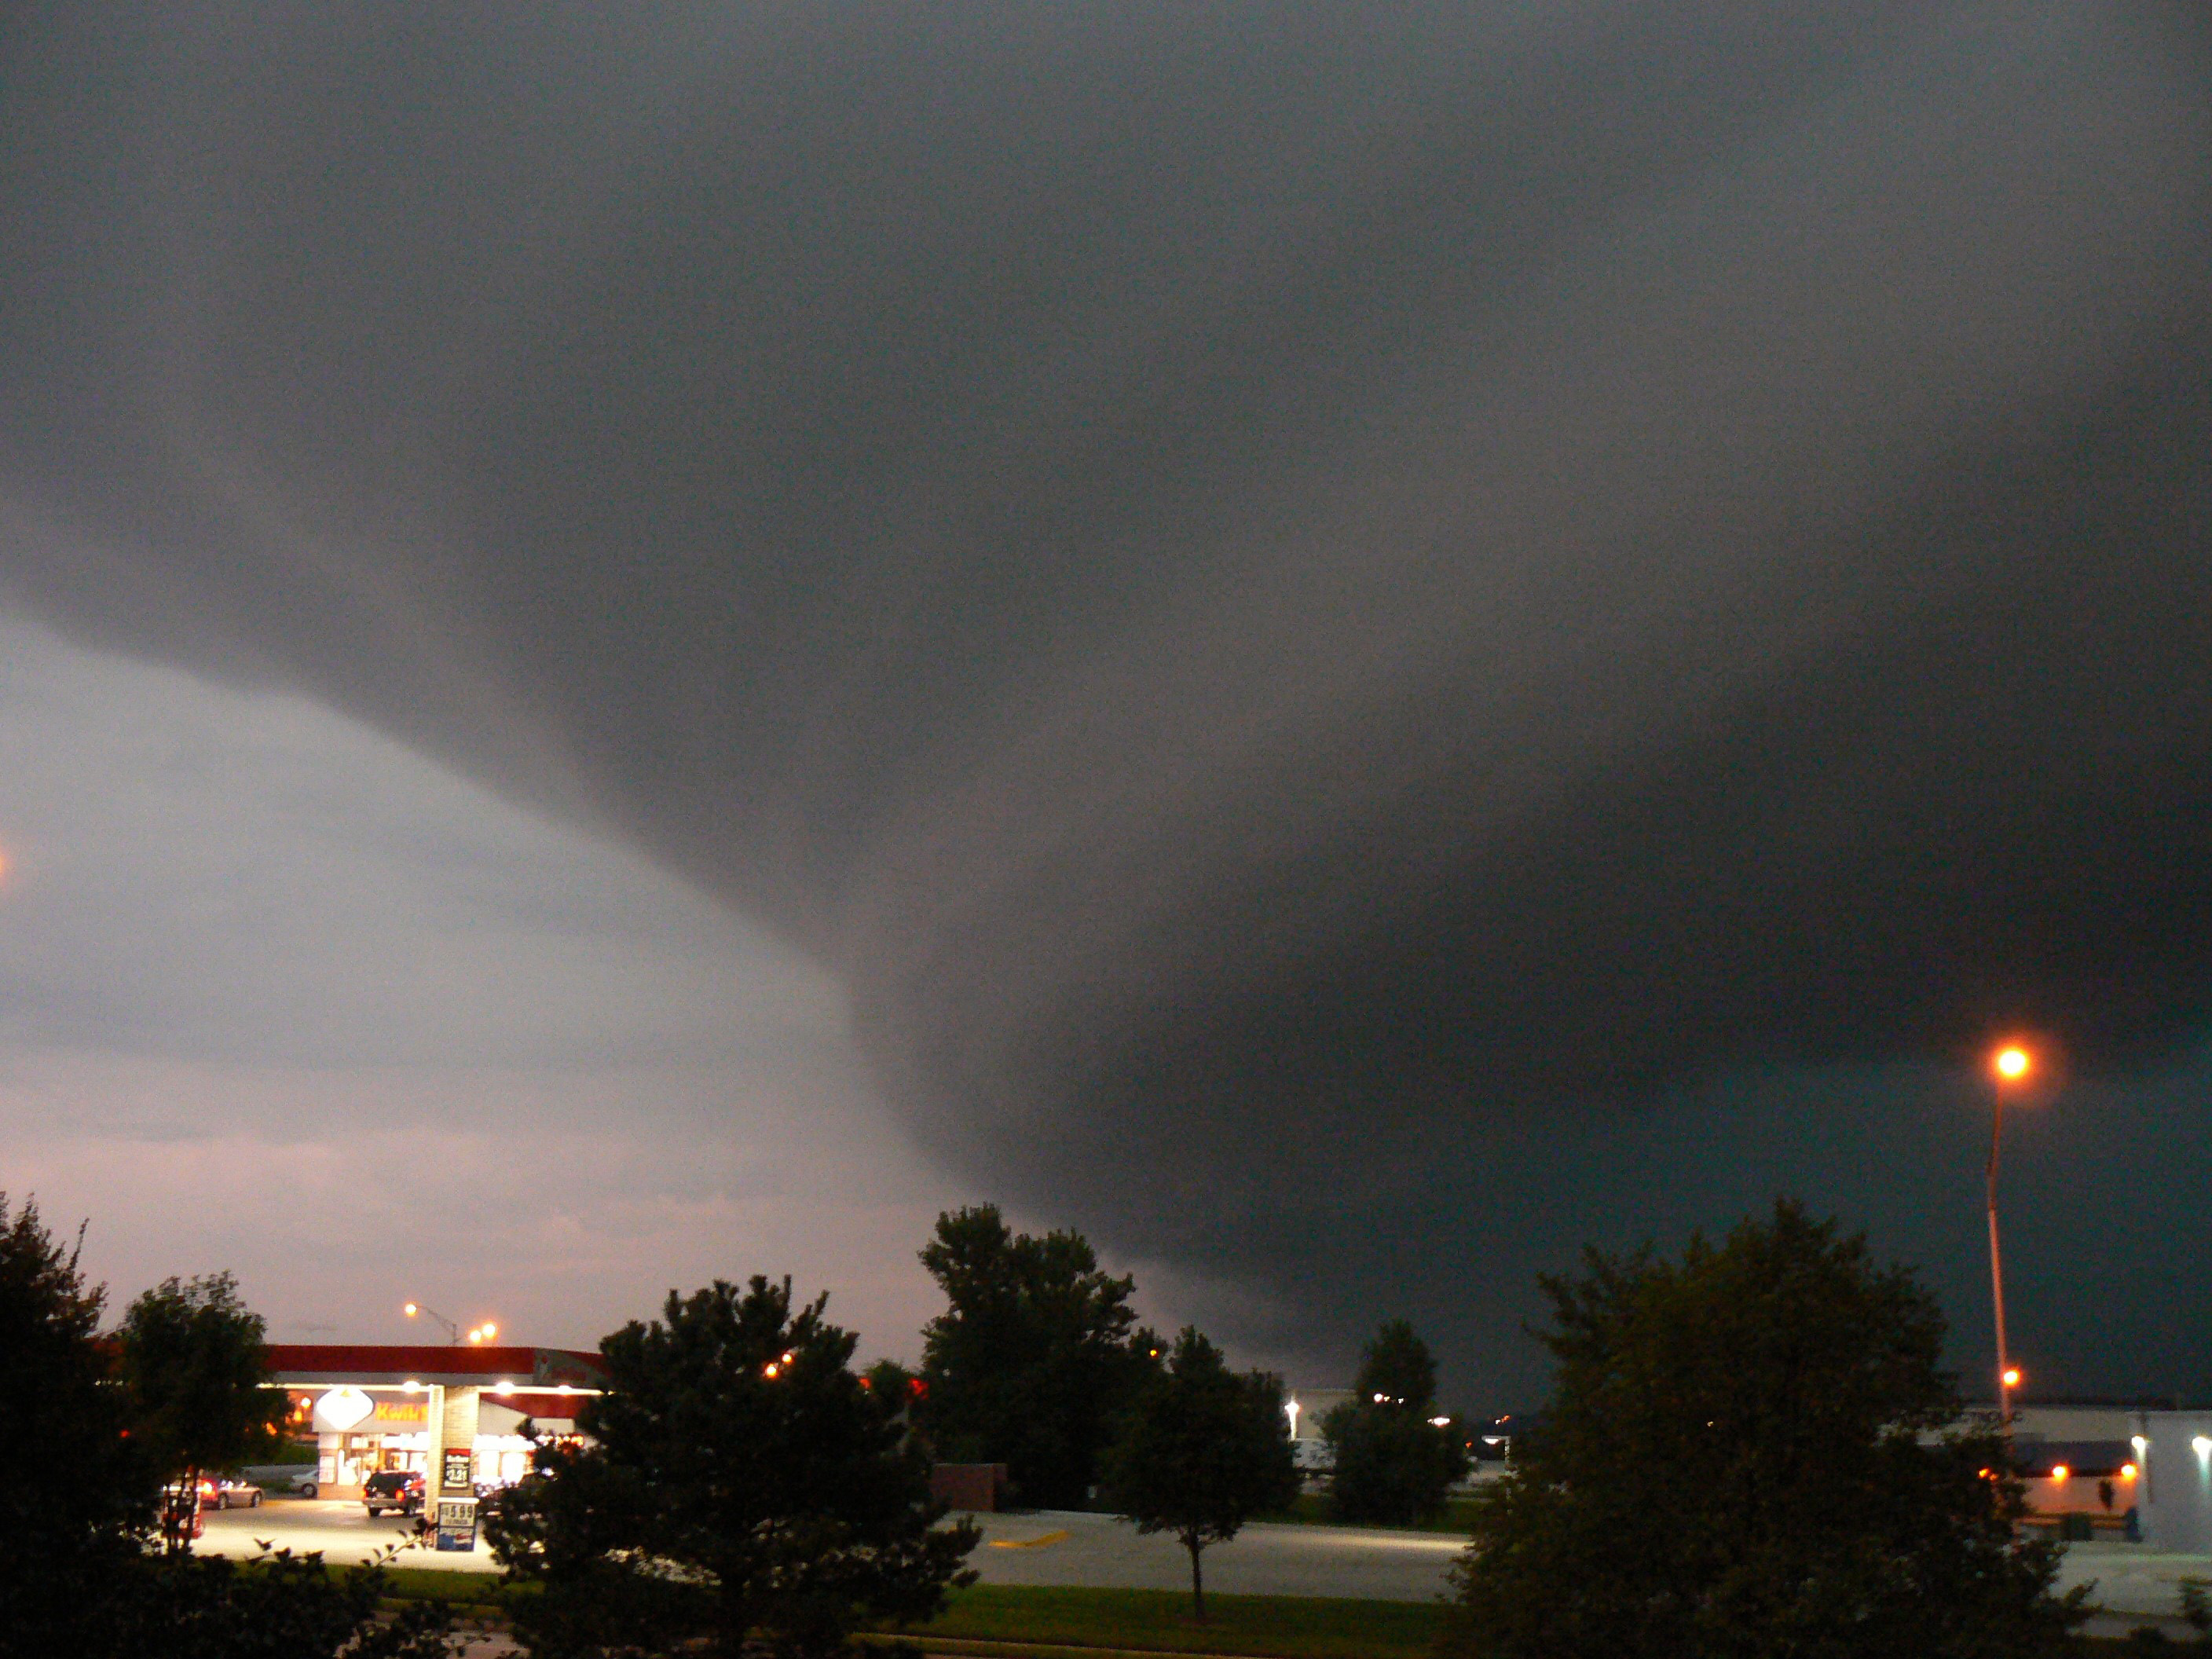
Understanding what a hurricane looks like on land today requires looking past the physical destruction and into the digital infrastructure that monitors these atmospheric giants. From the moment a tropical depression forms to the second its eye crosses a coastline, a symphony of tech tools works to render a visible, actionable image of the storm’s anatomy.
Digital Visualization: From Satellite Arrays to Ground-Level Data
The primary way we visualize a hurricane before and during landfall is through remote sensing. While early meteorology relied on ship reports and basic barometers, contemporary technology utilizes the “eyes in the sky”—satellites that provide a multi-spectral view of the storm’s structure.
High-Resolution Satellite Imaging and the GOES-R Series
The Geostationary Operational Environmental Satellite (GOES-R) series, operated by NOAA, represents a quantum leap in how we see hurricanes. Unlike older tech that provided intermittent updates, the Advanced Baseline Imager (ABI) on these satellites allows scientists to view a hurricane in 16 different spectral bands. This “look” includes visible light (what we see), infrared (to track heat and cloud heights), and water vapor.
On land, this tech allows us to visualize the “convective bursts” within the eyewall. These are the engines of the storm. By seeing these in high-definition—often with updates every 30 to 60 seconds—emergency responders can identify which side of the storm is intensifying as it hits the coast, providing a “look” at the storm that is invisible to a person standing in its path.
The Evolution of Dual-Polarization Doppler Radar
As a hurricane moves onto land, ground-based radar takes over the visual heavy lifting. Dual-Polarization (Dual-Pol) Radar has revolutionized our perspective. Traditional radar sent out horizontal pulses, but Dual-Pol sends both horizontal and vertical pulses.
This tech allows meteorologists to see the shape of the precipitation. Why does this matter? It lets us distinguish between heavy rain, hail, and “debris balls.” When a hurricane-spawned tornado touches down on land, Dual-Pol radar visualizes the debris being lofted into the air. This digital “look” at the storm is what saves lives, providing a visual confirmation of structural damage even when visibility is zero due to rain-fade.
IoT and Sensor Networks: Capturing the Micro-Realities of Landfall
While satellites and radar provide a macro view, the Internet of Things (IoT) provides the micro-view. To truly understand what a hurricane looks like on land, we must look at the data points generated by thousands of connected devices that endure the storm’s brunt.
Hyper-Local Weather Stations and Crowdsourced Data
Companies like Weather Underground and platforms using Netatmo sensors have created a mesh network of weather data. During a hurricane, these IoT devices provide a granular look at “micro-climates” within the storm. One neighborhood might experience 90 mph gusts while another, shielded by topography, sees only 60 mph.
This network transforms the hurricane from a monolithic “red blob” on a map into a complex, vibrating grid of data. Software interfaces now aggregate these thousands of pings per second, allowing us to see the exact moment the pressure drops in a specific zip code, providing a digital signature of the eye’s passage over land.
Smart Grids and Utility Monitoring
What does a hurricane look like to a power company? It looks like a cascading failure of nodes on a digital map. Smart grid technology uses sensors on transformers and substations to visualize the storm’s impact on infrastructure.
As the hurricane moves across the land, utility “Visual Command Centers” watch a digital twin of the city. Green lights turn red as lines go down. This technological visualization allows for “self-healing” grids to reroute power automatically, but more importantly, it provides a real-time heatmap of where the storm is most destructive. By tracking where the grid is failing, tech enables a secondary visualization of the storm’s path of greatest impact.

AI and Predictive Modeling: Visualizing the Unseen Forces
The most impressive way we “see” a hurricane on land today is through the lens of predictive modeling. We are no longer just looking at what is happening; we are using AI to visualize what will happen.
Machine Learning in Storm Surge Mapping
The deadliest part of a hurricane is often not the wind, but the water. Visualizing storm surge on land is notoriously difficult because it depends on complex variables like bathymetry (ocean floor shape), tide timing, and local topography.
Advanced AI algorithms now ingest terra-bytes of data to produce “Probabilistic Storm Surge” models. These tools provide a visual representation of the land being “inundated” hours before the first wave arrives. By using AI to process historical data and current storm physics, software can render a 3D visualization of a city, showing exactly which streets will be under five feet of water. This is “seeing” the hurricane through the eyes of a computer, predicting the physical reality before it manifests.
Digital Twins and Urban Impact Simulations
The concept of a “Digital Twin”—a virtual replica of a physical city—is becoming a cornerstone of hurricane tech. Cities like Miami and Singapore use these models to simulate how wind flows between skyscrapers.
When a hurricane hits a dense urban environment, the “Venturi effect” can cause wind speeds to accelerate between buildings. Through computational fluid dynamics (CFD) software, engineers can visualize these invisible wind tunnels. This tech allows us to see how a hurricane “looks” as it interacts with the built environment, identifying which glass facades are most likely to fail based on the storm’s specific angle of approach.
The Future of Remote Sensing: Drones and Robotics
The most dangerous part of a hurricane is the “Triple Point”—the area where the eyewall meets the land. Historically, this was a visual black hole because it was too dangerous for human observation. Today, robotics and autonomous systems are filling that gap.
UAVs and Drones in Post-Storm Assessment
Immediately after the eye passes, or even during the “tail” of the storm, Unmanned Aerial Vehicles (UAVs) are deployed. Equipped with LiDAR (Light Detection and Ranging), these drones can “see” through the canopy of fallen trees to map the ground below.
LiDAR technology uses laser pulses to create a high-resolution 3D map of the land. By comparing a pre-storm LiDAR scan with a post-storm scan, software can automatically identify every downed power line, every breached levee, and every structural failure. This tech gives us a definitive “look” at the hurricane’s handiwork with a level of precision that human eyes could never achieve.
Autonomous Sensors and Ocean Gliders
While our focus is on land, what a hurricane looks like on land is determined by its behavior just offshore. Autonomous “Saildrones” and underwater gliders are now steered directly into the path of hurricanes. These robots capture the exchange of energy between the warm ocean and the cooling atmosphere.
The data they transmit is visualized in “Dashboard” software that shows the “heat engine” of the storm. By seeing the hurricane as a thermodynamic process rather than just a weather event, technology provides a deeper, more scientific look at the forces that dictate how the storm will behave once it crosses the coastline.

Conclusion: A Multi-Dimensional View
What does a hurricane look like on land? Thanks to the current state of technology, it is no longer just a storm; it is a multi-dimensional data event. We see it through the infrared sensors of a satellite 22,000 miles away, the dual-polarized pulses of a Doppler radar on a nearby hill, the frantic pings of IoT sensors in our homes, and the predictive simulations of AI in a data center.
As we continue to refine these tools—moving toward more integrated “smart cities” and even more powerful machine learning models—our visual understanding of these storms will only sharpen. We are moving from a reactive “observation” of hurricanes to a proactive “visualization” that allows us to see the invisible forces of nature before they even arrive. In the tech-driven world of modern meteorology, seeing is no longer just believing—it is the key to resilience.
aViewFromTheCave is a participant in the Amazon Services LLC Associates Program, an affiliate advertising program designed to provide a means for sites to earn advertising fees by advertising and linking to Amazon.com. Amazon, the Amazon logo, AmazonSupply, and the AmazonSupply logo are trademarks of Amazon.com, Inc. or its affiliates. As an Amazon Associate we earn affiliate commissions from qualifying purchases.