In the complex world of business finance and investing, profitability often takes center stage. While revenue growth and net income are vital metrics, they do not tell the whole story of a company’s health. A company can be profitable on paper yet still face bankruptcy if it cannot meet its immediate financial obligations. This is where liquidity ratios come into play, and among them, the current ratio is arguably the most fundamental.
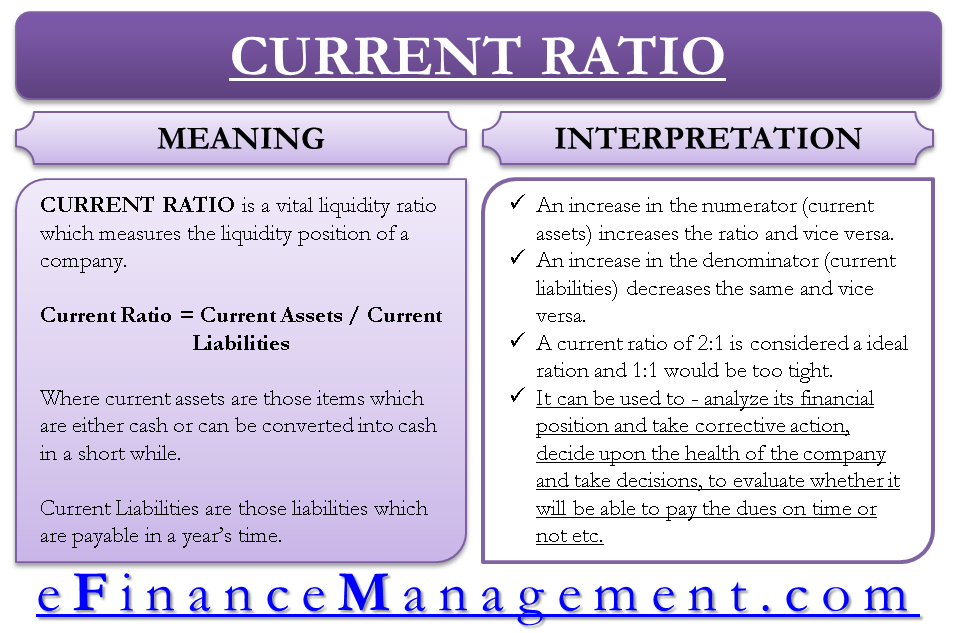
The current ratio is a liquidity metric that measures a company’s ability to pay short-term obligations or those due within one year. It tells investors and analysts how a company can maximize the current assets on its balance sheet to satisfy its current debt and other payables. Understanding what a current ratio means is essential for anyone looking to evaluate the stability, efficiency, and risk profile of a business.
The Fundamentals of the Current Ratio: Definition and Calculation
To understand the current ratio, one must first understand the components of a balance sheet. The ratio is a simple comparison between what a company owns in the short term versus what it owes in the short term.
Defining Current Assets
Current assets are resources that a company reasonably expects to convert into cash, sell, or consume within one year or one operating cycle. These are the most liquid assets available to a business. The primary components include:
- Cash and Cash Equivalents: This is the most liquid form of asset, including physical currency, bank deposits, and highly liquid investments like Treasury bills.
- Accounts Receivable: Money owed to the company by customers who have purchased goods or services on credit.
- Inventory: Raw materials, work-in-progress goods, and finished products ready for sale.
- Prepaid Expenses: Payments made in advance for services or goods to be received in the future, such as insurance premiums or rent.
Understanding Current Liabilities
Current liabilities are a company’s debts or obligations that are due within one year. These must be paid using current assets or by creating new current liabilities. Key components include:
- Accounts Payable: Money the company owes to its suppliers for goods or services purchased on credit.
- Short-term Debt: Loans or notes payable that are due within the next twelve months.
- Accrued Liabilities: Expenses incurred but not yet paid, such as wages, interest, or taxes.
- Current Portion of Long-term Debt: The specific amount of a long-term loan that is due to be paid within the current year.
The Current Ratio Formula
The mathematical representation of the current ratio is straightforward:
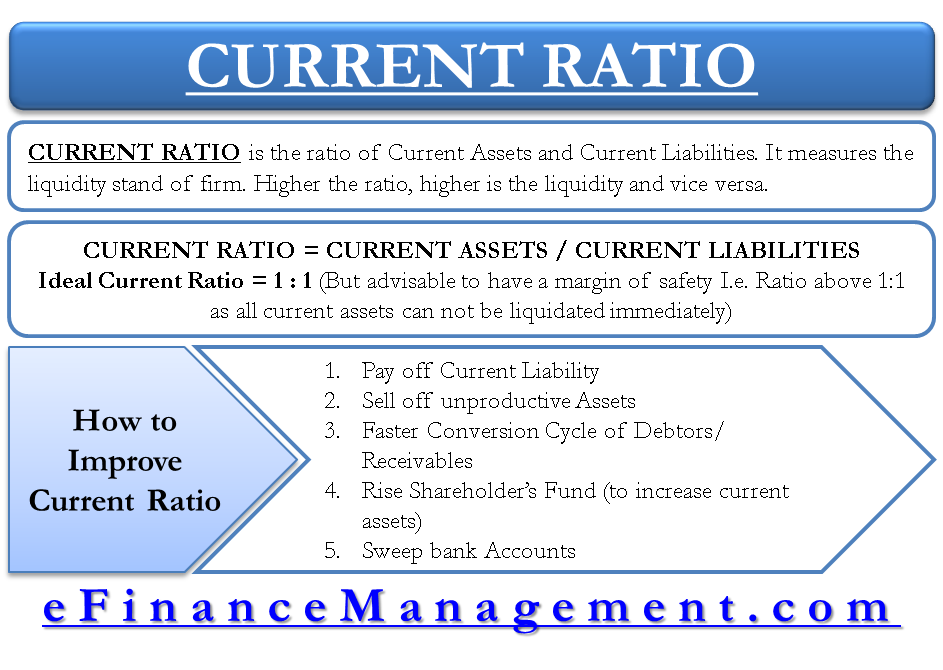
Current Ratio = Total Current Assets / Total Current Liabilities
For example, if a corporation has $500,000 in current assets and $250,000 in current liabilities, its current ratio is 2.0. This means the company has two dollars in liquid assets for every one dollar of short-term debt.
Interpreting the Results: What the Numbers Tell You
The resulting number from the calculation provides a snapshot of financial health, but the “meaning” of that number depends heavily on the context of the business and its operational history.
The Ideal Ratio: Finding the “Sweet Spot”
In many industries, a current ratio between 1.5 and 2.5 is considered healthy. A ratio in this range suggests that the company is in good financial standing to cover its short-term debts while still maintaining enough cushion to fund its daily operations. A ratio of 2.0 is often cited as a “standard” of excellence, indicating that the company has twice as many assets as liabilities. This provides a safety margin against unexpected financial shocks or downturns in the market.
When the Ratio is Below 1: Red Flags for Solvency
If the current ratio is less than 1.0, it means the company has more short-term liabilities than current assets. This is often a red flag for investors and creditors. It suggests that the company may struggle to meet its upcoming financial obligations if it cannot quickly generate more cash or secure additional financing. While a ratio below 1.0 does not guarantee bankruptcy, it indicates a high level of financial risk and potential liquidity problems. It may force the company to sell off long-term assets or take on expensive debt to stay afloat.
When the Ratio is Too High: Inefficiency and Stagnation
While it might seem that a higher ratio is always better, an excessively high current ratio (e.g., above 3.0 or 4.0) can be a sign of inefficiency. It may indicate that the company is not using its current assets or its short-term financing facilities effectively. For instance, a very high ratio might suggest that the company is sitting on too much idle cash that could be reinvested in the business, or that it has an excessive amount of unsold inventory or uncollected receivables. From an investor’s perspective, this could mean the company is missing out on growth opportunities.
Why Industry Context Matters
One of the most important rules in financial analysis is that the current ratio should never be viewed in a vacuum. What is considered a “good” ratio varies significantly across different sectors due to varying business models and capital requirements.
Retail vs. Manufacturing
In the retail sector, companies often have lower current ratios. This is because retailers—especially those with high turnover like grocery stores—can move their inventory very quickly and collect cash immediately at the point of sale. They may also negotiate long payment terms with suppliers (high accounts payable), which keeps their current liabilities high compared to their assets. In contrast, a manufacturing company may require a higher current ratio because its production cycle is longer, meaning its capital is tied up in raw materials and work-in-progress inventory for months before it can be converted back into cash.
The Tech and Service Sector Perspective
Tech companies, particularly software-as-a-service (SaaS) providers, often operate with very different liquidity profiles. Since they do not carry physical inventory, their current assets are primarily composed of cash and accounts receivable. Because their overhead might be lower and their billing cycles predictable, they may operate comfortably with a current ratio that would seem dangerously low for a capital-intensive industry like heavy machinery or construction.
The Limitations of the Current Ratio
While the current ratio is a valuable tool, it is a “blunt instrument” that can sometimes hide underlying financial issues. Experienced financial analysts look beyond the surface number to understand the quality of the assets involved.
The Inventory Trap
The biggest weakness of the current ratio is that it includes inventory in the calculation. Inventory is not always easily convertible to cash. If a company has a current ratio of 2.0, but 70% of its current assets are comprised of slow-moving or obsolete inventory, its actual liquidity is much lower than the ratio suggests. If the company cannot sell that inventory, it cannot use it to pay its bills. This is why many analysts also use the Quick Ratio (or Acid-Test Ratio), which excludes inventory from the assets to provide a more conservative view of liquidity.
Timing and Seasonality Issues
The current ratio is a “point-in-time” metric, meaning it only reflects the company’s position on the day the balance sheet was produced. For seasonal businesses, this can be misleading. A toy retailer will have a vastly different current ratio in October (when it is stocked with inventory for the holidays) compared to January (when it has high cash reserves and low inventory). To get a true sense of a company’s health, it is necessary to look at the current ratio trends over several quarters rather than a single snapshot.
Strategic Financial Management: Improving Your Liquidity Position
For business owners and financial managers, the current ratio is a vital KPI (Key Performance Indicator). Managing this ratio effectively is a delicate balancing act between maintaining safety and maximizing growth.
Optimizing Accounts Receivable
One of the most effective ways to improve a current ratio without taking on more debt is to manage receivables more efficiently. By shortening credit terms, offering early payment discounts, or being more aggressive in collections, a company can convert its receivables into cash faster. This increases the liquidity “quality” of the current assets, ensuring that the company has the actual cash on hand to meet its obligations.

Managing Debt Obligations
Strategic debt management also plays a role in the current ratio. If a company has a large amount of short-term debt that is suppressing its current ratio, it might consider refinancing that debt into long-term loans. By moving a debt obligation from “current liabilities” to “long-term liabilities,” the company immediately improves its current ratio. While the total debt remains the same, the immediate pressure on liquidity is reduced, giving the business more breathing room to operate and grow.
In conclusion, the current ratio is a foundational element of financial analysis in the “Money” niche. It serves as a vital barometer for a company’s short-term solvency and operational efficiency. However, to truly understand what a current ratio means, one must look beneath the surface—considering industry benchmarks, asset quality, and historical trends. Whether you are an investor looking for a stable addition to your portfolio or a business owner managing daily operations, mastering the nuances of the current ratio is a non-negotiable skill in the pursuit of financial success.
aViewFromTheCave is a participant in the Amazon Services LLC Associates Program, an affiliate advertising program designed to provide a means for sites to earn advertising fees by advertising and linking to Amazon.com. Amazon, the Amazon logo, AmazonSupply, and the AmazonSupply logo are trademarks of Amazon.com, Inc. or its affiliates. As an Amazon Associate we earn affiliate commissions from qualifying purchases.