
In the world of finance, certainty is a luxury that few can afford. Whether you are a seasoned portfolio manager, a retail investor, or a small business owner, every decision you make is an exercise in managing uncertainty. When we look at stock market projections, interest rate forecasts, or revenue estimates for a new side hustle, we are rarely given a single, immutable number. Instead, we are presented with ranges and probabilities. Among the most critical of these statistical tools is the “95% confidence interval.”
While it sounds like academic jargon relegated to the halls of mathematics departments, the 95% confidence interval is actually one of the most practical tools for anyone looking to build wealth or manage a business. It provides a mathematical framework for answering the question: “How much of this financial projection can I actually trust?” Understanding this concept allows an investor to move beyond guesswork and into a realm of calculated risk management.
The Mechanics of Uncertainty: Defining the 95% Confidence Interval for Investors
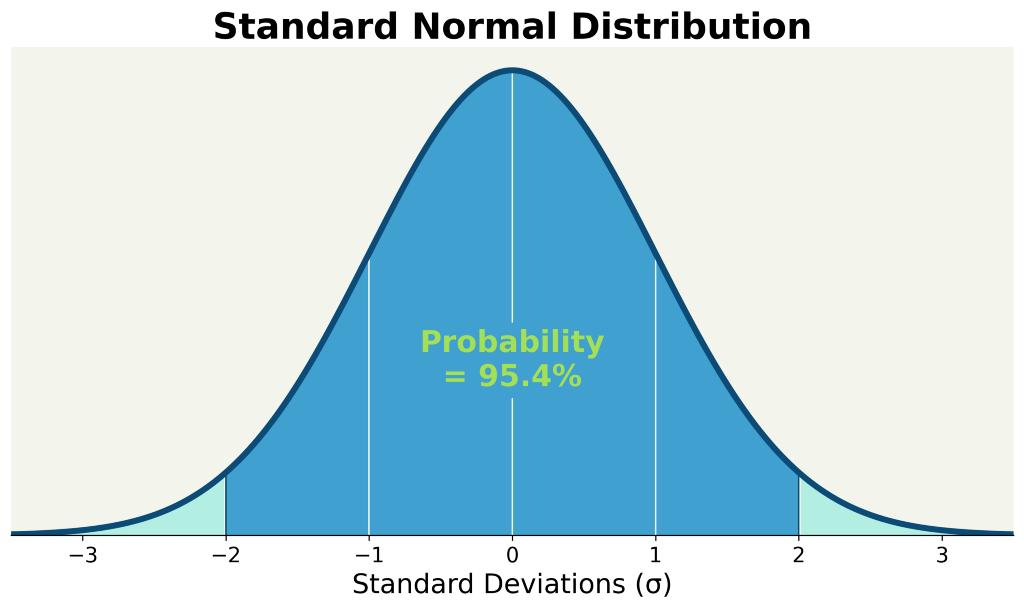
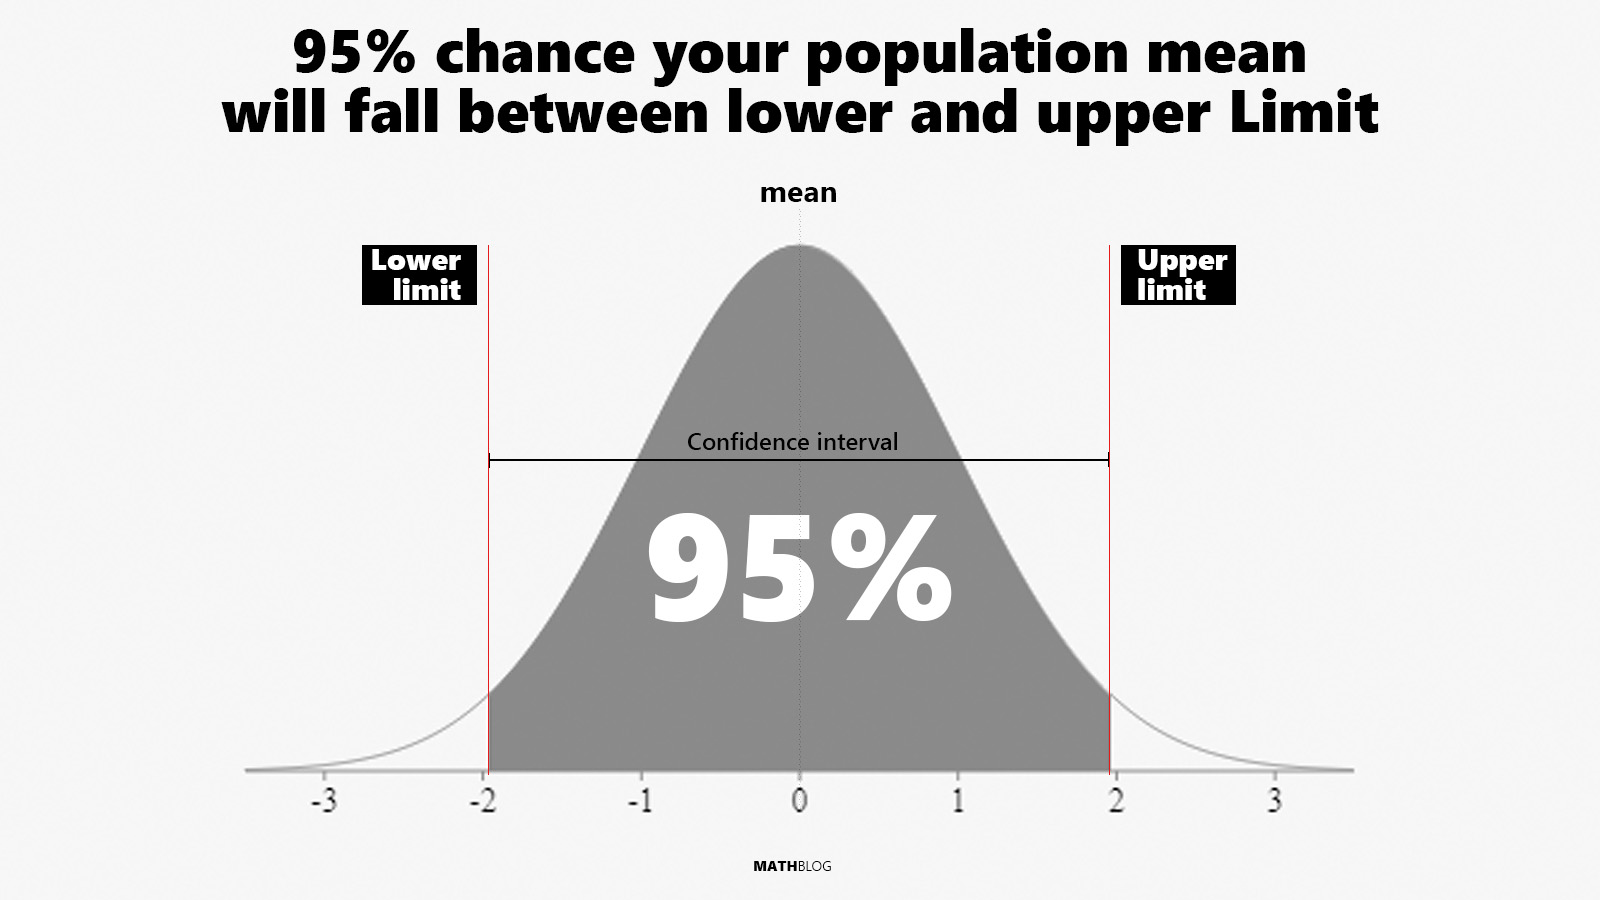
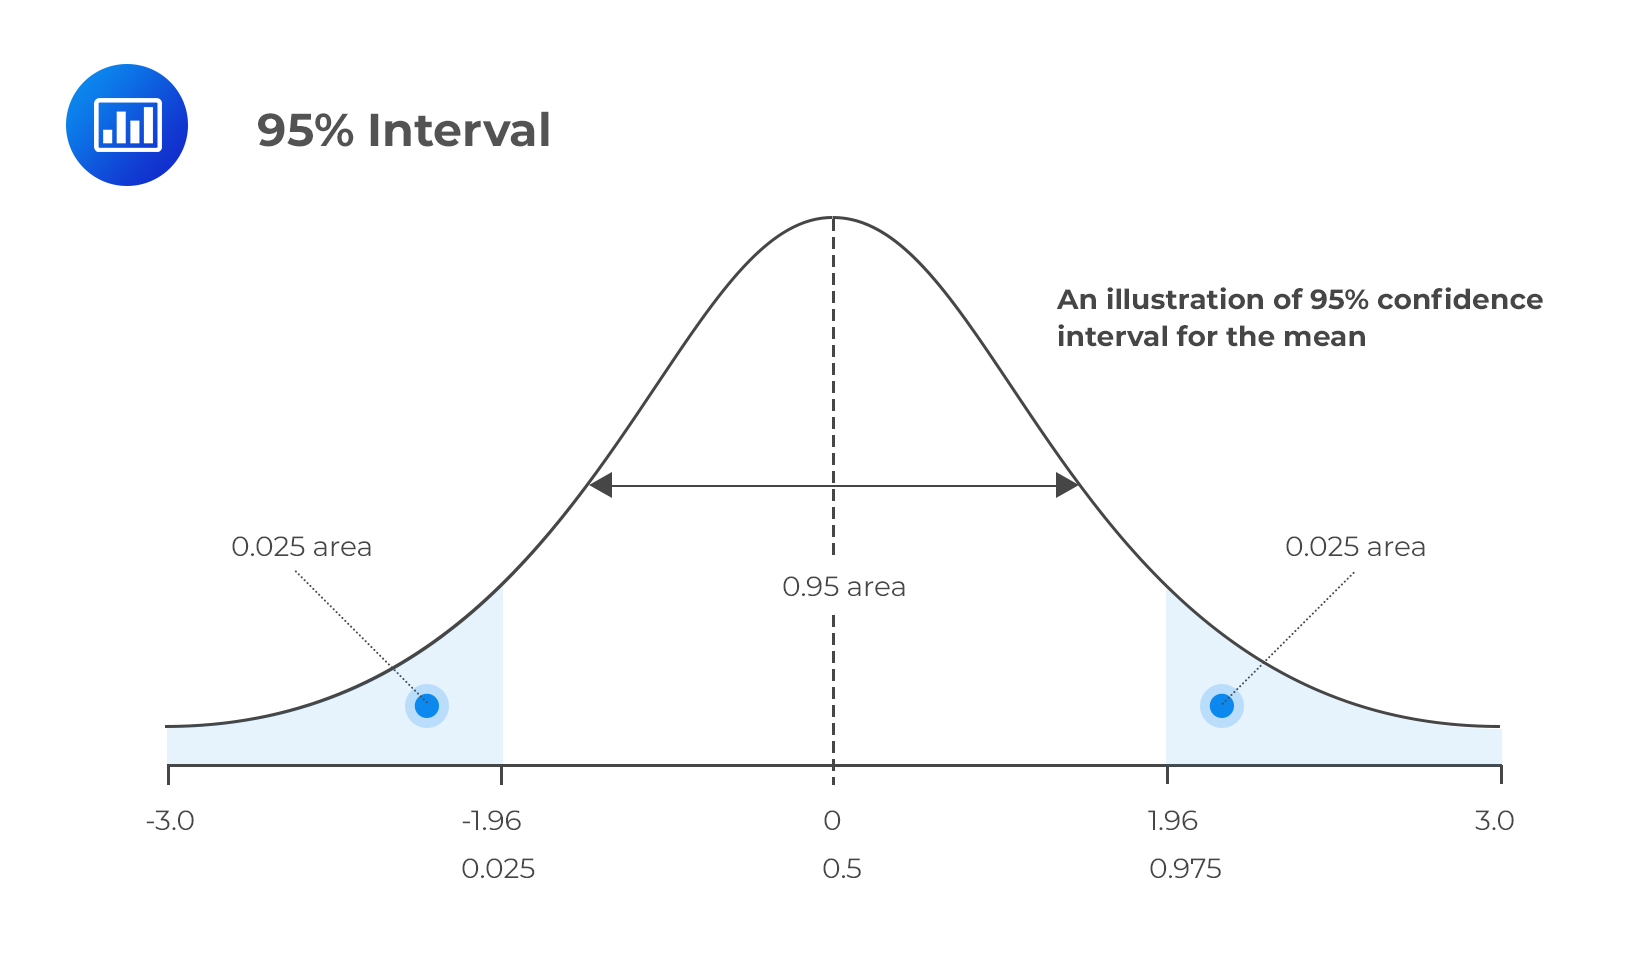
To understand the 95% confidence interval in a financial context, we must first strip away the complex equations and look at what it represents: a range of values that is likely to contain the true “population parameter” based on a sample of data.
Probability vs. Certainty in Market Returns
When a financial analyst states that the expected return on a specific index fund is 8% with a 95% confidence interval of 6% to 10%, they are not saying there is a 95% chance the market will return exactly 8%. Rather, they are saying that if we were to repeat the data collection and analysis process 100 times, we would expect the calculated interval to capture the true average return in 95 of those instances.
In money management, this distinction is vital. It acknowledges that the future is not a single point but a spectrum of possibilities. A narrow interval suggests high precision and lower volatility, while a wide interval suggests that the data is noisy and the future is much harder to pin down. For an investor, the confidence interval is the “safety net” around a projection.
The Statistical Foundation: Margin of Error and Sample Size
The width of a confidence interval in financial modeling is determined by three main factors: the sample size (how much historical data we have), the variability (how volatile the asset is), and the chosen confidence level (in this case, 95%).
In personal finance, if you are tracking your monthly spending to create a budget, a 95% confidence interval based on only three months of data will be incredibly wide because the “sample size” is small. However, if you have five years of categorized spending data, your 95% confidence interval for next month’s expenses will be much tighter. This allows for more precise financial planning and less “buffer” capital sitting idle in low-interest savings accounts.
Risk Management and the “Safe” Range of Returns
The primary reason investors use the 95% confidence interval is to mitigate risk. In the pursuit of online income or stock market gains, the “average” return is often a distraction. What matters most is the range of outcomes you are likely to experience, especially the ones that could jeopardize your financial solvency.
Using Confidence Intervals to Set Realistic Expectations
Imagine you are looking at a real estate investment trust (REIT). The historical data suggests a mean return of 7%. However, calculating the 95% confidence interval reveals a range between -2% and +16%.
This insight changes the investment thesis. If your financial goal requires a minimum of 5% return to meet your mortgage obligations, the fact that the 95% confidence interval includes negative territory (-2%) is a major red flag. It tells you that while the average is good, the reliability of that average is insufficient for your specific needs. By focusing on the lower bound of the 95% interval, conservative investors can ensure they are not over-leveraging themselves based on optimistic “mean” projections.
Portfolio Stress Testing: Beyond the Average
Modern financial tools often use Monte Carlo simulations—running thousands of “what-if” scenarios—to generate confidence intervals for retirement portfolios. If a financial tool tells you that you have a 95% confidence interval of retiring with between $1.2 million and $2.5 million, it allows you to plan for the “worst-case” scenario within that 95% bracket.
This is the cornerstone of the “Safe Withdrawal Rate” theory. Financial planners don’t just look at what a portfolio might do; they look at what it is 95% likely to stay above. This provides the peace of mind necessary to stay invested during market downturns, knowing that the volatility was already accounted for within the statistical model.
Applying Confidence Intervals to Business Finance and Side Hustles
For entrepreneurs and those seeking online income, the 95% confidence interval is an essential tool for validating business models. When launching a new product or service, you are often working with “noisy” data from small test groups or initial advertising runs.
Forecasting Revenue for New Ventures
Suppose you launch a side hustle selling digital products. You run an initial ad campaign that results in a 3% conversion rate. Before you quit your day job, you need to know if that 3% is a fluke or a sustainable metric.
By calculating a 95% confidence interval for your conversion rate based on your initial 1,000 visitors, you might find the range is actually between 0.5% and 5.5%. This tells you that your business is still in a high-uncertainty phase. Scaling your ad spend based on the 3% “average” could be disastrous if the true long-term conversion rate is closer to 0.5%. The confidence interval forces the entrepreneur to wait for more data or to build a more robust financial cushion.
Evaluating the Success of Marketing Spend
In digital marketing and e-commerce, “A/B testing” is the standard. If Version A of a landing page earns $500 and Version B earns $550, is Version B actually better? Without a confidence interval, you might be chasing a “phantom” gain caused by random chance.
A 95% confidence interval helps you determine “statistical significance.” If the intervals for the two versions overlap significantly, you cannot be confident that Version B is truly a better money-maker. In the world of business finance, this prevents “pivot fatigue,” where owners constantly change strategies based on data that isn’t actually statistically reliable.
Common Pitfalls: Misinterpreting Data in Financial Decision Making
While the 95% confidence interval is powerful, it is frequently misunderstood, leading to “overconfidence bias” and catastrophic financial errors.
The Overconfidence Bias in Trading
A common mistake among retail traders is believing that a 95% confidence interval means there is a 95% chance the price of a stock will stay within that range. This is a subtle but dangerous misunderstanding. The interval is about the accuracy of the estimate, not the movement of the price.
Furthermore, many financial models assume a “Normal Distribution” (the classic bell curve). However, financial markets are famous for “Fat Tails”—events that occur far more often than a normal distribution would predict. If you bet your entire portfolio on the assumption that a 95% confidence interval covers almost all possibilities, you may be wiped out by a “Black Swan” event that falls in the remaining 5%.
When the 5% Tail Risk Becomes a Reality
The most important thing to remember about a 95% confidence interval is the 5% that is not included. In finance, this 5% usually represents extreme market crashes or unexpected economic collapses.
Professional risk managers use a metric called “Value at Risk” (VaR), which is closely related to confidence intervals. If a firm’s 95% VaR is $1 million, it means that on 95 out of 100 days, they expect to lose no more than $1 million. But it also means that on 5 out of every 100 days (about once a month), they should expect to lose more than that. Investors who ignore the 5% “tail” often find themselves unprepared for the very volatility that the 95% interval was designed to contextualize.
Conclusion: Integrating Statistical Confidence into Long-Term Wealth Building
The 95% confidence interval is more than just a statistical calculation; it is a philosophy of prudent money management. It encourages an investor to look past the headlines and the “average” returns to see the underlying uncertainty of the market.
By utilizing this tool, you can build a more resilient financial life. You can set retirement goals based on the lower bound of an interval rather than the peak, ensuring you are never caught short. You can evaluate side hustles with a skeptical eye, waiting for the data to show a tight and positive interval before committing significant capital. And most importantly, you can recognize that while we can never predict the future with 100% certainty, we can certainly be 95% confident in our path forward.
In the pursuit of financial independence, the goal isn’t to be right all the time—it’s to be right often enough, and to have a wide enough margin of error to survive when the data falls into that unpredictable 5%.
aViewFromTheCave is a participant in the Amazon Services LLC Associates Program, an affiliate advertising program designed to provide a means for sites to earn advertising fees by advertising and linking to Amazon.com. Amazon, the Amazon logo, AmazonSupply, and the AmazonSupply logo are trademarks of Amazon.com, Inc. or its affiliates. As an Amazon Associate we earn affiliate commissions from qualifying purchases.