
In the fast-paced world of global finance, the question “what did the stock market do today live?” is more than just an inquiry into price fluctuations; it is a search for narrative. Every trading day is a complex interplay of human psychology, geopolitical events, corporate performance, and algorithmic execution. For the modern investor, tracking the market in real-time offers a window into the collective expectations of the world’s most powerful financial institutions and individual traders alike. Understanding these movements requires looking beyond the green and red tickers to the underlying mechanics that drive value in the digital age.

Deciphering Today’s Market Movements: The Key Indicators
To understand what the stock market is doing at any given moment, one must first identify which “market” is being discussed. While the media often speaks of the stock market as a monolithic entity, it is actually a collection of various indices, each representing a different segment of the economy.
Major Indices Performance: S&P 500, Nasdaq, and the Dow
The S&P 500 is widely considered the most accurate barometer of the overall U.S. stock market. Because it is market-capitalization weighted, it reflects the performance of the 500 largest publicly traded companies. When you check the market live, the S&P 500 tells you how the “big picture” is unfolding.
Conversely, the Nasdaq Composite is heavily weighted toward the technology and biotechnology sectors. If the Nasdaq is outperforming the S&P 500 on a live basis, it often indicates a “risk-on” sentiment where investors are hungry for growth. The Dow Jones Industrial Average (DJIA), meanwhile, consists of only 30 blue-chip companies. It is price-weighted, meaning stocks with higher share prices have a greater impact on the index, often making it a reflection of industrial stability rather than speculative growth.
Sector Rotations and Market Breadth
Monitoring the market live involves observing sector rotation. On any given day, technology might be down while energy or utilities are up. This internal movement suggests that investors are shifting capital from growth-oriented assets to defensive ones, perhaps in anticipation of economic slowing.
Market breadth is another critical factor. It isn’t enough to see the indices in the green; an insightful investor looks at the “advance-decline line.” If the S&P 500 is up, but more individual stocks are falling than rising, the rally is considered “thin” and potentially unsustainable, driven only by a few mega-cap names like Apple or Nvidia.
The Catalysts Behind Live Market Fluctuations
Stock prices do not move in a vacuum. Every intraday swing is usually a reaction to specific data points or news cycles that alter the perceived value of future cash flows.
Economic Reports and Federal Reserve Sentiment
The most significant drivers of live market volatility are often the “macro” data releases. Reports such as the Consumer Price Index (CPI), which measures inflation, or the monthly Non-Farm Payrolls (NFP) report, can cause hundreds of points of movement in seconds.
Investors watch these numbers because of their influence on the Federal Reserve. If inflation comes in higher than expected, the market “lives” the reality of potential interest rate hikes. Higher rates increase the cost of borrowing for companies and decrease the present value of future earnings, typically leading to a live sell-off in equities. Conversely, a “dovish” tone from a Fed official during a live midday speech can ignite a rally as investors anticipate cheaper capital.
Corporate Earnings and Guidance
During “earnings season,” the live market is dominated by individual company reports. When a bellwether company like Microsoft or JPMorgan Chase releases its quarterly results, the impact ripples across the entire sector. However, the market’s live reaction is rarely about what the company did in the past quarter; it is about “guidance.” If a company beats earnings expectations but lowers its outlook for the next six months, the stock will often plummet in real-time. This illustrates the forward-looking nature of the stock market, where today’s price is always a reflection of tomorrow’s expectations.
How to Monitor the Stock Market Live Like a Professional
For the retail investor, the tools used to track live data have become increasingly sophisticated, narrowing the gap between the “pro” and the individual. However, the sheer volume of data can be overwhelming without a structured approach.
Essential Tools and Platforms
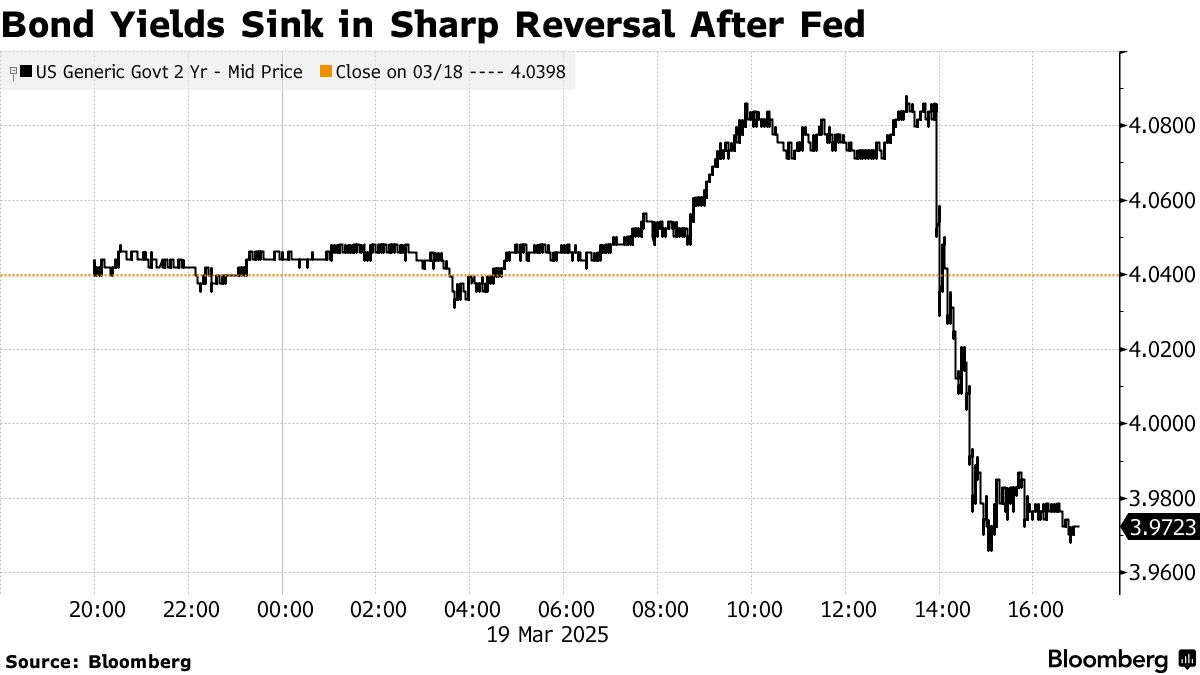
Professional-grade platforms provide “Level 2” market data, which shows the “bid” and “ask” prices as well as the size of the orders waiting to be filled. This gives a live view of the “depth” of the market. While a standard news site might show that a stock is at $150, Level 2 data shows exactly how much selling pressure exists at $150.10.
Additionally, tools like heat maps offer a visual representation of the market. A heat map organizes stocks by sector and uses color (shades of red and green) and box size (market cap) to show where the money is flowing. This allows an investor to see instantly if a market rally is broad-based or concentrated in a single niche.
Reading Candlestick Charts and Volume
When watching the market live, price action is best viewed through candlestick charts rather than simple line graphs. A candlestick shows the opening, closing, high, and low prices for a specific timeframe (e.g., 1 minute, 5 minutes, or 1 hour).
Volume is the “gasoline” of the market. If a stock’s price is rising on low volume, the move lacks conviction and may quickly reverse. If the price is crashing on massive volume, it indicates institutional liquidation. Monitoring the relationship between price and volume in real-time is the primary way traders distinguish between a “head fake” and a genuine trend change.
The Psychological Aspect of Real-Time Trading
Perhaps the most difficult part of following the stock market live is managing the psychological toll. The “ticking” of prices can trigger biological “fight or flight” responses that lead to poor financial decision-making.
Managing F.O.M.O. and Emotional Volatility
The “Fear Of Missing Out” (FOMO) is most potent when the market is climbing rapidly in a live session. Seeing a “green” screen can tempt investors to abandon their long-term strategies and chase a hot stock at its peak. Similarly, “loss aversion” causes significant stress during live downturns. Behavioral finance suggests that the pain of a loss is twice as powerful as the pleasure of a gain. Watching your portfolio value drop in real-time can lead to “panic selling,” often at the very moment the market is bottoming out.
Avoiding the Noise of Financial News Cycles
The 24-hour financial news cycle is designed to keep viewers engaged, which often means exaggerating the significance of minor intraday moves. A 1% drop in the Dow might be headlined as a “Plunge” or “Market Turmoil.” To navigate the live market effectively, one must learn to filter out this “noise.” Successful investors often focus on the “signal”—the fundamental economic shifts—rather than the “narrative” created by pundits to explain every 15-minute fluctuation.
Strategies for Acting on Daily Market Data
Knowing what the market is doing live is only useful if you have a framework for how to act (or not act) on that information. The strategy should always be dictated by your time horizon and risk tolerance.
Intraday Trading vs. Long-Term Positioning
For day traders, the live market is their office. They profit from small price discrepancies and intraday volatility, usually closing all positions before the market bell rings at 4:00 PM EST. This requires intense focus, technical analysis skills, and strict discipline.
For the long-term investor, however, the live market is often best used as a tool for “entry and exit optimization” rather than a daily call to action. If you have decided to invest in a particular index fund, watching the live market might help you wait for a “dip” or a period of consolidation to get a better price. However, for most people, the strategy of “Dollar Cost Averaging” (investing a set amount at regular intervals) is superior to trying to time the live market, as it removes the emotional component entirely.
The Importance of Post-Market Analysis
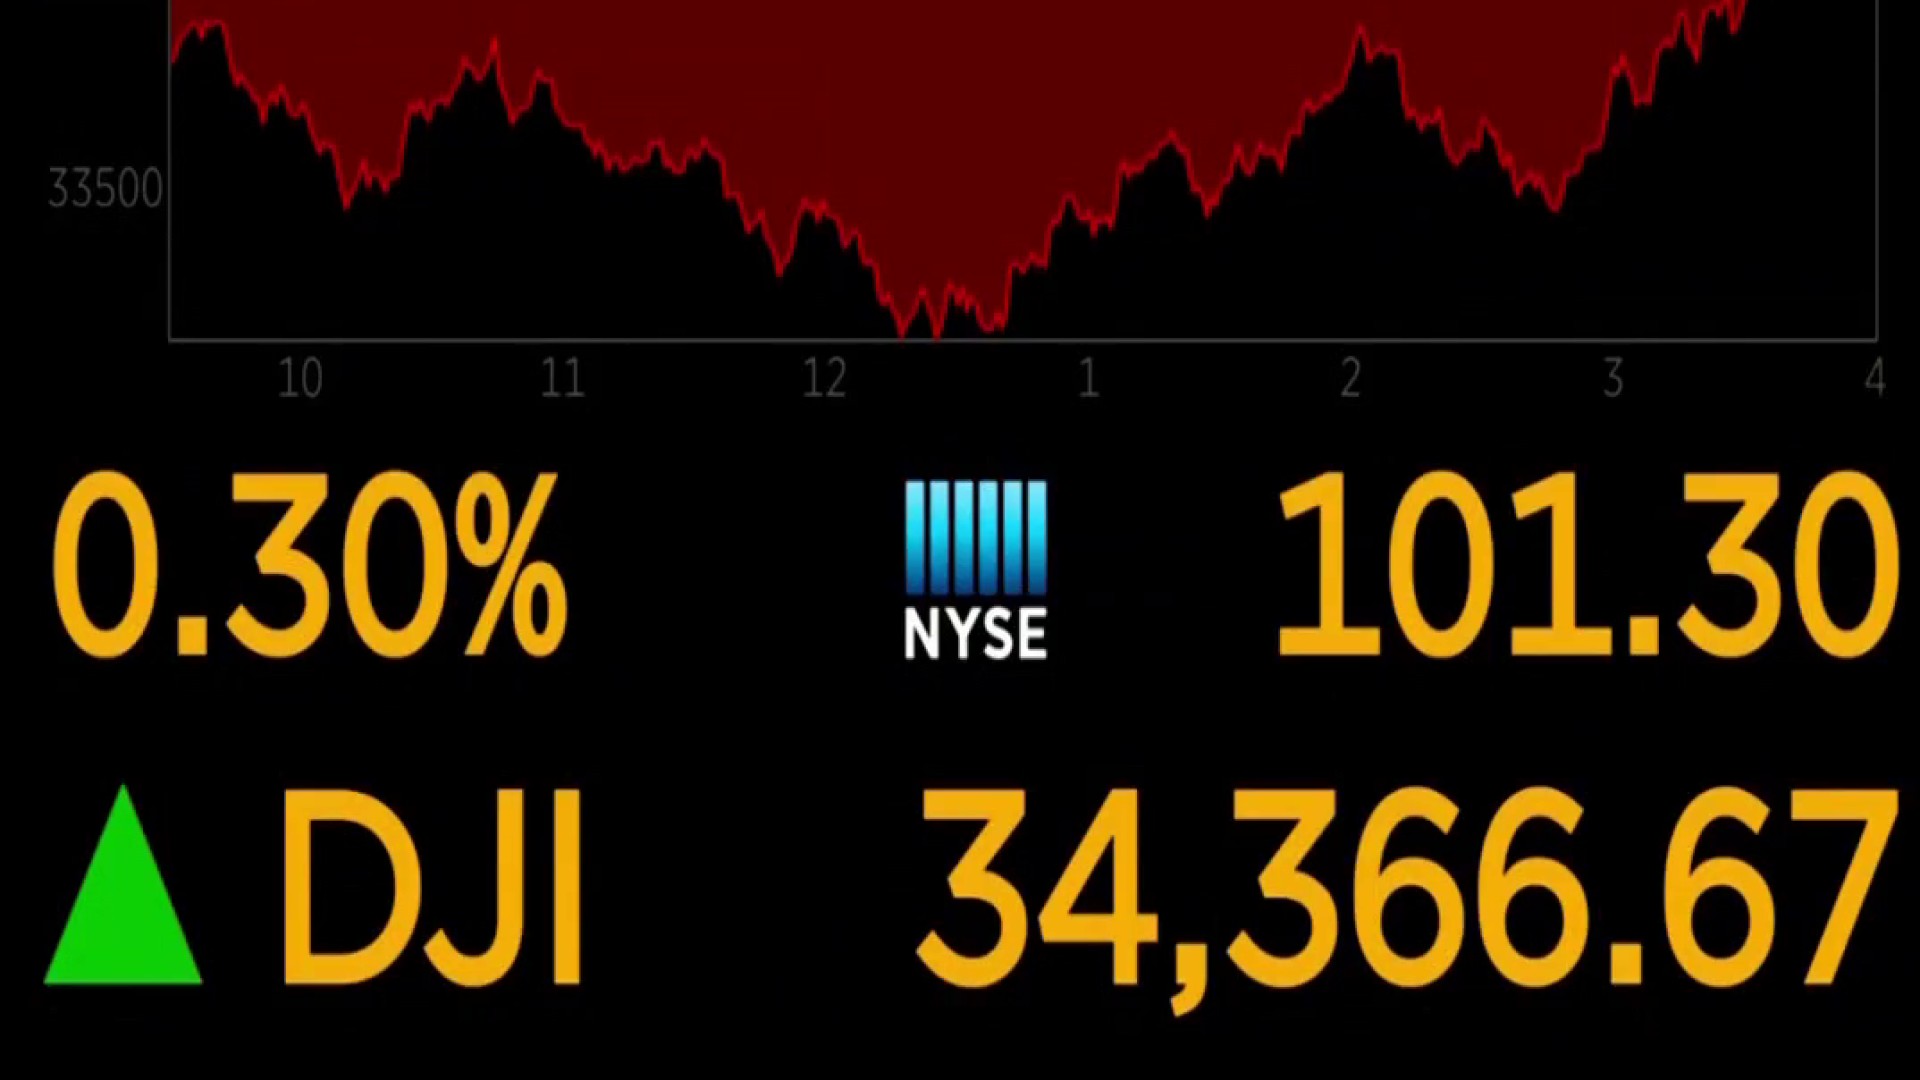
What the market does “live” is only part of the story. The “After-Hours” and “Pre-Market” sessions often see significant moves because liquidity is lower and volatility is higher. Furthermore, the true meaning of a day’s trading often isn’t clear until the “Closing Cross”—the final moments of the trading day when massive institutional orders are settled.
Analyzing the day’s performance after the dust has settled allows for a more objective view. Did the market close at its highs? That suggests “bullish” momentum into the next day. Did it give up all its gains in the final hour? That could be a sign of “exhaustion.” By combining live observation with disciplined post-market review, an investor moves from being a reactive spectator to an informed participant in the global economy.
Ultimately, the stock market’s live performance is a reflection of the world’s collective hopes, fears, and calculations. While it can be a source of anxiety, it is also one of the greatest wealth-building tools ever created. Understanding its daily rhythm is the first step toward mastering your own financial future.
aViewFromTheCave is a participant in the Amazon Services LLC Associates Program, an affiliate advertising program designed to provide a means for sites to earn advertising fees by advertising and linking to Amazon.com. Amazon, the Amazon logo, AmazonSupply, and the AmazonSupply logo are trademarks of Amazon.com, Inc. or its affiliates. As an Amazon Associate we earn affiliate commissions from qualifying purchases.