For millions of investors, from the seasoned institutional trader to the casual retail enthusiast, the question “What did the market close at today?” is more than a simple inquiry about numbers. It is a daily ritual that signals the end of a high-stakes psychological drama played out across digital exchanges. While the specific closing price of the S&P 500 or the Dow Jones Industrial Average changes every 24 hours, the significance of the “closing bell” remains a cornerstone of modern capitalism.
Understanding the market close requires looking beyond the green and red flickering lights on a smartphone screen. It involves understanding market mechanics, the sentiment of the global economy, and how these daily fluctuations impact long-term financial health.
Understanding the Closing Bell: More Than Just a Sound
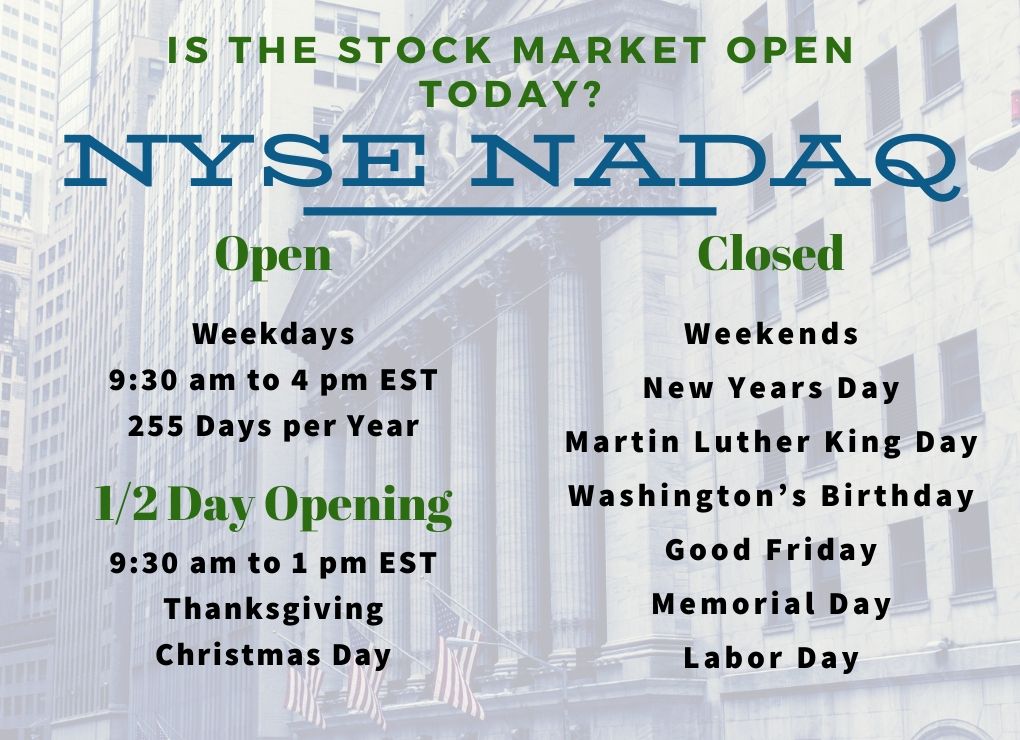
The “market close” refers to the final moments of the regular trading session on major exchanges, such as the New York Stock Exchange (NYSE) and the Nasdaq. In the United States, this typically occurs at 4:00 PM Eastern Time. While the sound of the bell is iconic, the actual mechanical process of the close is a complex feat of financial engineering.
The Significance of the Final Trade
The closing price is widely considered the most accurate valuation of a security for that day. It serves as the official benchmark for mutual fund Net Asset Values (NAVs), options pricing, and the calculation of index performance. Unlike the opening price, which can be volatile due to overnight news, the closing price reflects the sum total of all information processed by the market throughout the trading day. For institutional investors, the close is the “price of record,” used to value portfolios worth trillions of dollars.
How Closing Prices Are Determined (The Auction Process)
Many investors assume the closing price is simply the last trade made before the clock hits 4:00 PM. In reality, major exchanges use a “Closing Auction.” This process gathers all “Market-on-Close” (MOC) and “Limit-on-Close” (LOC) orders to find a single price that maximizes the volume of shares traded. This auction helps minimize volatility and ensures that large institutional orders do not cause massive price swings in the final seconds of the day. Understanding this mechanism helps investors appreciate why the “market close” is often the period of the highest liquidity and volume.
Key Indicators to Watch Every Afternoon
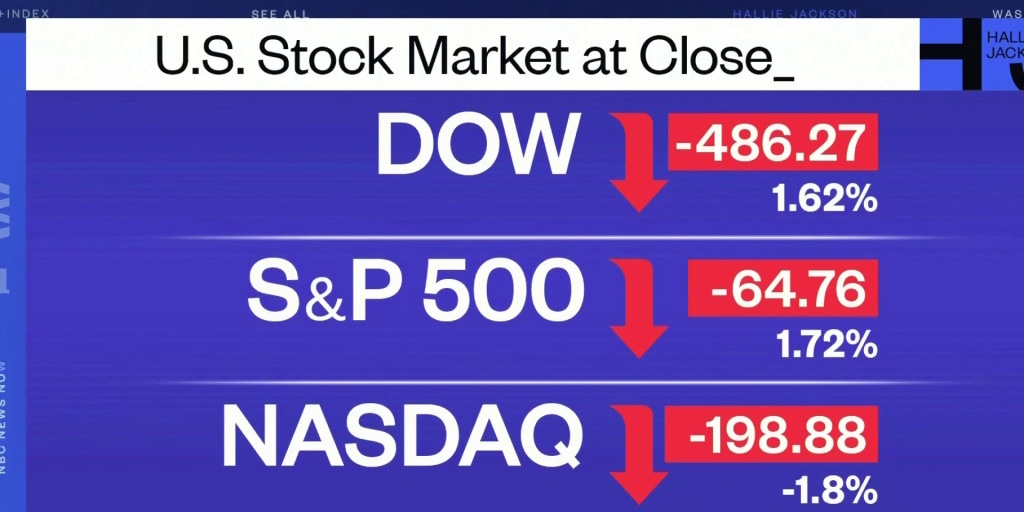
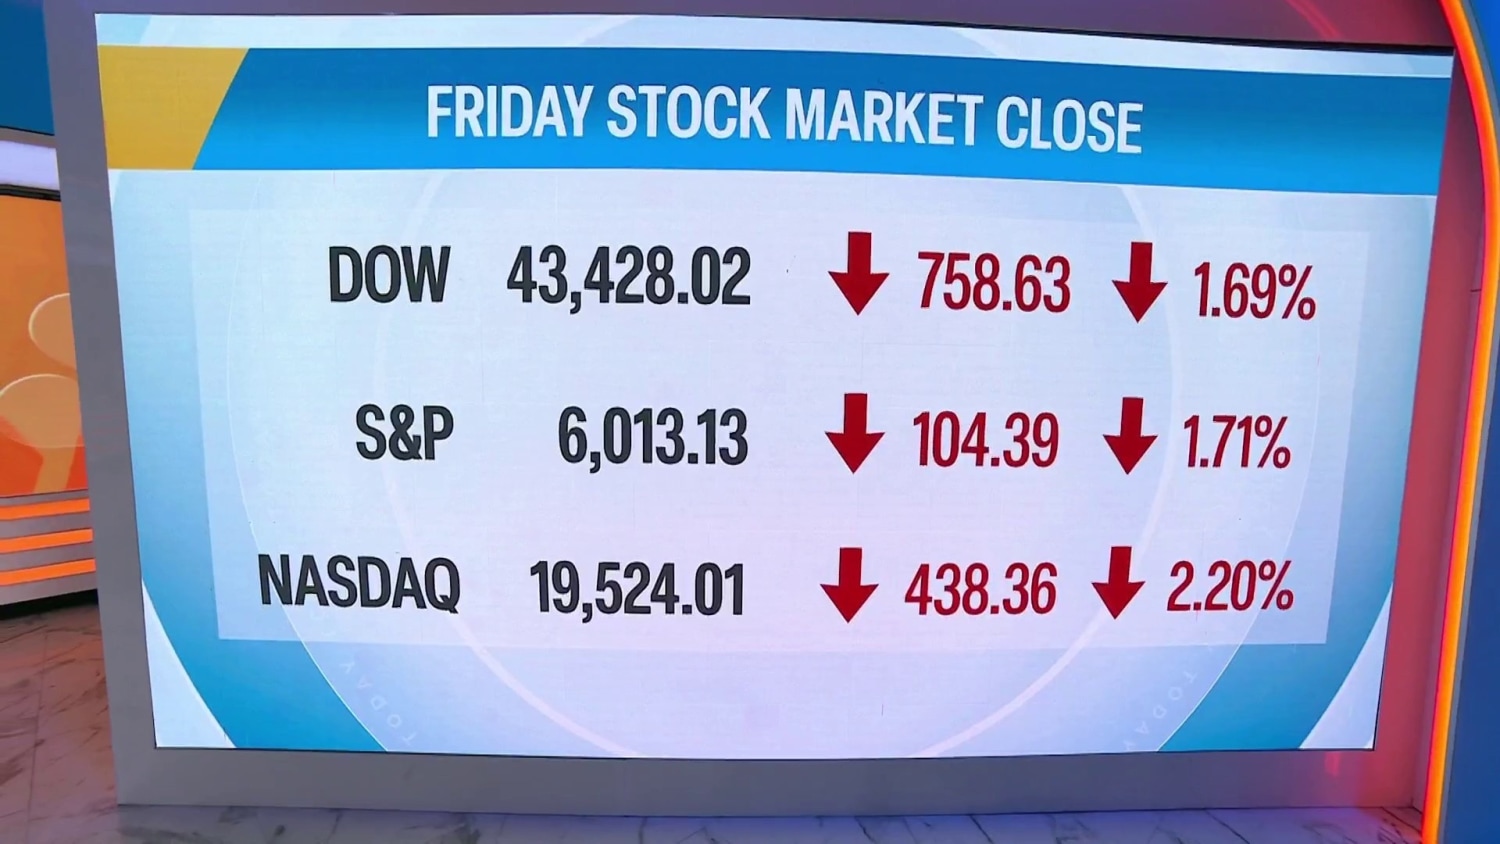
When someone asks what the market did today, they are usually referring to the performance of a few specific indices. These benchmarks act as the “thermometers” of the financial world, each measuring a different aspect of economic health.
The “Big Three” Indices: S&P 500, Dow Jones, and Nasdaq
The S&P 500 is perhaps the most important indicator for the average person’s 401(k) or brokerage account. It tracks 500 of the largest companies in the U.S. and is weighted by market capitalization, making it a broad representation of the American economy.
The Dow Jones Industrial Average (DJIA), while the most famous, is a price-weighted index of only 30 “blue-chip” companies. Because it is price-weighted, higher-priced stocks have a larger impact on the index, which some critics argue makes it a less accurate reflection of the total market than the S&P 500.
The Nasdaq Composite is heavily tilted toward the technology and growth sectors. When the Nasdaq closes significantly higher or lower than the Dow, it often signals a “risk-on” or “risk-off” sentiment, where investors are either flocking to high-growth tech stocks or retreating to the safety of established industrial giants.
Sector Performance and Market Breadth
To truly understand the market close, one must look under the hood at sector performance. The market might close “flat” (unchanged), but that could hide the fact that Energy stocks soared while Consumer Discretionary stocks plummeted. Analysts also look at “market breadth”—the ratio of advancing stocks to declining stocks. If the S&P 500 closed higher, but more individual stocks fell than rose, it suggests that a few massive companies (like Apple or Microsoft) are propping up the index, which can be a sign of underlying weakness.
Why Daily Market Fluctuations Matter for Long-Term Wealth
It is easy to get caught up in the “noise” of daily trading. However, the daily close provides critical data points that, when viewed over time, form the trends that define bull and bear markets. For the individual investor, the challenge is distinguishing between temporary volatility and fundamental shifts in the economic landscape.
Sentiment vs. Fundamentals
On any given day, the market close might be driven by “sentiment”—a reaction to a geopolitical headline, a stray comment from a Federal Reserve official, or a viral trend. This is often short-term noise. However, over weeks and months, the closing prices begin to reflect “fundamentals,” such as corporate earnings, interest rate environments, and GDP growth. Professional investors use the daily close to gauge whether the market is overreacting to news, potentially creating “buying opportunities” for those with a long-term horizon.
The Impact of After-Hours Trading
While the “close” happens at 4:00 PM, the market never truly sleeps. After-hours trading allows investors to trade stocks until 8:00 PM ET. This period is often where the most dramatic moves happen, particularly during earnings season. If a major company reports earnings at 4:05 PM, the stock might move 10% in minutes. While the “official” close is set, the after-hours market provides a preview of how the market might open the following morning. For the savvy investor, watching the relationship between the 4:00 PM close and the 8:00 PM after-hours price is essential for anticipating the next day’s momentum.
Essential Tools for Tracking Real-Time Market Data
In the digital age, information is democratized. You no longer need a Bloomberg Terminal costing thousands of dollars a month to know exactly what the market is doing. However, the quality of your tools can dictate the quality of your financial decisions.
Financial News Platforms and Apps
Reliable data is the bedrock of investing. Platforms like Yahoo Finance, Google Finance, and CNBC provide real-time updates on indices and individual equities. For those looking for more depth, tools like Seeking Alpha or Morningstar offer post-market analysis that explains why the market closed at a certain level. When checking the close, it is beneficial to look for a “Market Wrap” article, which synthesizes the day’s events into a cohesive narrative, connecting the dots between bond yields, currency fluctuations, and stock prices.
Understanding Volatility through the VIX
When checking the market close, smart investors also look at the CBOE Volatility Index, or the VIX. Often called the “Fear Gauge,” the VIX measures the market’s expectation of 30-day volatility based on S&P 500 index options. If the market closes down and the VIX closes significantly higher, it indicates growing nervousness among investors. Conversely, a declining VIX during a market rally suggests a period of “complacency” or stability. Monitoring the VIX alongside the closing prices provides a more three-dimensional view of market health.
Developing a Disciplined Strategy Beyond the Daily Close
While knowing what the market closed at is helpful, the most successful investors are those who do not let the daily number dictate their emotional state. Wealth is built through consistency and discipline, not by reacting to every 1% swing in the Dow.
Avoiding “Ticker Shock” and Emotional Bias
“Ticker shock” occurs when an investor checks their portfolio after a bad market close and feels the immediate urge to sell to “save” what is left. This is a classic example of loss aversion, a psychological bias that can ruin financial plans. Professional financial advisors often suggest that unless you are a day trader, you should avoid checking the market close every single day. Instead, focus on weekly or monthly trends to keep your perspective focused on the “big picture.”
The Role of Rebalancing and Periodic Reviews
Instead of asking “What did the market close at today?” with an eye toward immediate action, use the information for periodic rebalancing. If a series of strong closes in the tech sector has pushed your portfolio’s allocation from 60% stocks to 70% stocks, it might be time to sell some winners and move the money into more stable assets like bonds or high-yield savings accounts. In this context, the daily market close is just one small data point in a much larger, more important strategy of risk management and wealth preservation.
In conclusion, the market close is the heartbeat of the global financial system. It provides a daily snapshot of collective human wisdom, fear, and greed. By understanding the mechanics of the closing auction, the importance of various indices, and the tools available for analysis, you can transform from a passive observer into an informed participant in your own financial future. Whether the market closes up or down today, the most important thing is having a plan that remains resilient regardless of the numbers on the screen.
aViewFromTheCave is a participant in the Amazon Services LLC Associates Program, an affiliate advertising program designed to provide a means for sites to earn advertising fees by advertising and linking to Amazon.com. Amazon, the Amazon logo, AmazonSupply, and the AmazonSupply logo are trademarks of Amazon.com, Inc. or its affiliates. As an Amazon Associate we earn affiliate commissions from qualifying purchases.