
When investors, journalists, and everyday observers ask, “What did the Dow Jones do today?” they are participating in a tradition that dates back to the late 19th century. The Dow Jones Industrial Average (DJIA) is more than just a number on a screen; it is a psychological barometer for the American economy and a primary point of reference for the health of global markets. To understand what the Dow “did” involves looking past the daily points gained or lost and examining the underlying economic forces, the structural mechanics of the index, and its historical significance.

For the modern investor, the performance of the Dow is a snapshot of the sentiment surrounding 30 of the largest, most influential blue-chip companies in the United States. Whether the index is soaring to new record highs or retreating amidst inflationary fears, its movement provides critical data points for personal finance management and corporate strategy.
Decoding the Dow: What the Index Represents and How It Moves
The Dow Jones Industrial Average is a price-weighted measurement of 30 prominent companies listed on stock exchanges in the United States. To understand what the Dow does, one must first understand what it is designed to track. Unlike the S&P 500, which tracks 500 companies based on market capitalization, the Dow is selective. It seeks to represent the “industrial” backbone of the country, though the term “industrial” has evolved significantly since Charles Dow and Edward Jones first calculated the average in 1896.
The Evolution of the 30 Components
The companies that make up the Dow are intended to be leaders in their respective sectors. Over time, the composition of the index has shifted from heavy manufacturing and railroads to include technology, healthcare, and retail giants. When we ask what the Dow did, we are essentially asking how companies like Microsoft, Goldman Sachs, UnitedHealth Group, and Apple performed collectively.
The selection process is not governed by a rigid formula but by a committee that seeks to ensure the index remains a relevant reflection of the U.S. economy. This means that when the Dow moves, it reflects a shift in the perceived stability and profitability of the “old guard” of American business.
Market Sentiment and the Daily Fluctuation
On a day-to-day basis, the Dow moves in response to a variety of catalysts. Earnings reports are perhaps the most direct influence. If a heavyweight component like Boeing or Caterpillar reports disappointing quarterly results, it can drag the entire index down, even if other sectors are performing well.
Beyond corporate earnings, the Dow reacts to macroeconomic data. When the Federal Reserve announces interest rate decisions, or when the Labor Department releases jobs reports, the Dow serves as the primary “scoreboard” for how the market interprets that information. A “green” day for the Dow often signals investor confidence in the resilience of large-cap earnings, while a “red” day suggests a flight toward safety or a reassessment of economic growth projections.
Historical Context: Key Events That Shaped the Dow’s Trajectory
To understand the Dow’s current behavior, one must look at the milestones that have defined its journey. The index has survived world wars, depressions, and technological revolutions, each leaving a mark on how we interpret its movements today.
From the Great Depression to the Post-War Boom
The most infamous period in the Dow’s history remains the Crash of 1929. The index’s precipitous fall signaled the start of the Great Depression, and it took nearly 25 years for the Dow to return to its pre-crash highs. This era taught investors about the dangers of excessive leverage and the importance of systemic stability.
Conversely, the post-World War II era saw the Dow reflect the massive expansion of the American middle class and the rise of the consumer economy. The index crossed the 1,000-point threshold for the first time in 1972, a milestone that, while modest by today’s standards, represented a massive psychological breakthrough for the investing public.
The Modern Era: 2008, 2020, and the Drive to 40,000
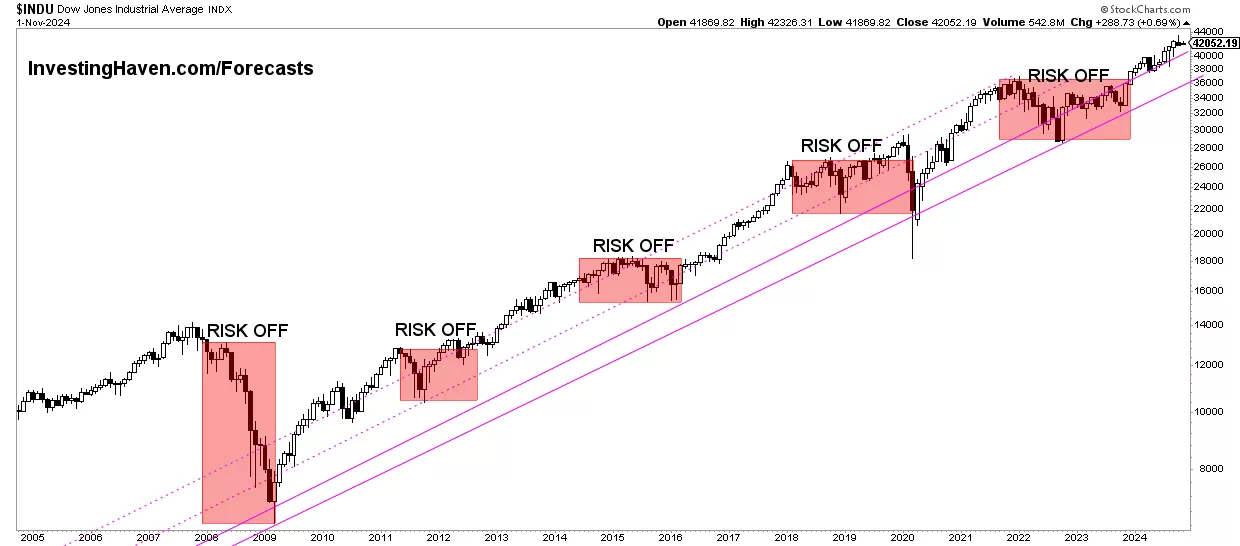
In the 21st century, the Dow has faced extreme volatility. The 2008 financial crisis saw the index plummet as the banking sector faced collapse. However, the subsequent decade-long bull market, fueled by low interest rates and the tech boom, propelled the index to heights previously thought unreachable.
The 2020 COVID-19 pandemic provided one of the most dramatic displays of what the Dow “does” during a crisis. It experienced some of its worst single-day point drops in history, followed by a rapid recovery as fiscal and monetary stimulus flooded the economy. Most recently, the Dow’s climb toward the 40,000-point mark has been a testament to the endurance of corporate earnings even in the face of persistent inflation and geopolitical uncertainty. When the Dow hits these “round number” milestones, it often serves to validate long-term “buy and hold” strategies for retail investors.
The Mechanics of the Average: Why Price-Weighting Matters

One of the most frequent points of confusion regarding the Dow is its price-weighted nature. To truly understand what the index did on any given day, you have to understand the “Dow Divisor.”
Price-Weighting vs. Market-Cap Weighting
In a market-cap-weighted index like the S&P 500, a company’s influence is determined by its total market value. In the Dow, however, the share price determines the influence. This means that a stock trading at $400 per share has a much larger impact on the index’s movement than a stock trading at $50 per share, regardless of which company is actually “bigger” in terms of total valuation.
This quirk often leads to situations where a single company can disproportionately move the Dow. For example, if a high-priced stock like UnitedHealth Group sees a 5% gain, it will add more points to the Dow than a 5% gain in a lower-priced stock like Verizon. When analysts discuss what the Dow did, they are often looking at the “heavy hitters” within the 30 stocks that drove the majority of the movement.
The Role of the Dow Divisor
Because stocks undergo splits, spin-offs, and substitutions, the simple average of 30 prices wouldn’t work over time. The Dow Divisor is a mathematical constant used to maintain the continuity of the index. Every time a component stock splits or a company is replaced, the divisor is adjusted.
Currently, the divisor is a fraction less than one, which means that a $1 change in the price of any component stock results in a much larger than 1-point change in the index itself. This “multiplier effect” is why we see the Dow move by hundreds of points in a single session, even when the underlying percentage change might be relatively small.
Interpreting Volatility: What the Dow Says About the Global Economy
When the Dow moves significantly, it is usually communicating something about the broader economic environment. Understanding these signals is vital for business leaders and personal investors alike.
Inflation and Interest Rates
In recent years, the Dow’s performance has been a direct reflection of the market’s relationship with the Federal Reserve. When inflation figures come in higher than expected, the Dow often retreats. This is because higher inflation usually leads to higher interest rates, which increases the cost of borrowing for companies and can dampen consumer spending. Since the Dow is composed of mature, dividend-paying companies, its components are often sensitive to the “risk-free” rate of return offered by Treasury bonds. When bond yields rise, the Dow may struggle to compete for investor capital.
The “Flight to Quality”
During times of geopolitical tension or economic uncertainty, the Dow often outperforms more speculative indices like the Nasdaq Composite. This is known as a “flight to quality.” Because the Dow consists of established companies with massive balance sheets and proven business models, investors view them as “safer” bets when the future is unclear. What the Dow does during a market correction can tell you a lot about the current level of fear or confidence in the marketplace. If the Dow is holding steady while tech stocks are crashing, it suggests that investors are seeking stability over growth.
Industrial Health and the Supply Chain
As the name suggests, many Dow components are deeply integrated into global supply chains. When the Dow moves based on news of trade agreements, shipping disruptions, or raw material costs, it is providing a real-time assessment of global commerce. Companies like 3M, Honeywell, and Dow Inc. are sensitive to the costs of inputs and the ease of moving goods across borders. Therefore, a rising Dow can often be interpreted as a signal of healthy global trade.
Practical Takeaways for Investors: Integrating the Dow into Your Strategy
For the individual investor, knowing what the Dow did is only the first step. The real value lies in how that information is applied to financial planning and portfolio management.
The Dow as a Benchmark
While the S&P 500 is often considered a better representation of the “total market,” the Dow remains a premier benchmark for value-oriented investing. Many investors use the Dow to gauge the performance of their “core” holdings. If your personal portfolio is lagging behind the Dow during a bull market, it may be a sign that you are either over-diversified into laggard sectors or that your risk management is too conservative.
Investing in the Dow Directly
Investors who want to mirror what the Dow does can do so through Exchange Traded Funds (ETFs), most notably the SPDR Dow Jones Industrial Average ETF Trust (ticker: DIA). This allows for a simplified investment strategy that captures the performance of the 30 blue-chip giants without having to purchase each stock individually. This “index-tracking” approach is a cornerstone of passive investing, providing exposure to some of the most stable companies in the world with relatively low management fees.
Limitations to Consider
It is important to remember that the Dow is a narrow slice of the market. It does not include small-cap or mid-cap companies, which are often the primary drivers of innovation and high-growth returns. Relying solely on what the Dow did to make investment decisions can result in a portfolio that lacks diversification. A holistic financial strategy usually involves looking at the Dow in conjunction with other indices to get a full picture of the economic landscape.
The performance of the Dow Jones Industrial Average remains a vital piece of the financial puzzle. By understanding the components, the mechanics of its calculation, and its historical context, investors can better interpret the daily headlines. When we look at what the Dow did, we aren’t just looking at a number; we are looking at the collective pulse of the American corporate engine, providing insights that are essential for navigating the complexities of the modern financial world.
aViewFromTheCave is a participant in the Amazon Services LLC Associates Program, an affiliate advertising program designed to provide a means for sites to earn advertising fees by advertising and linking to Amazon.com. Amazon, the Amazon logo, AmazonSupply, and the AmazonSupply logo are trademarks of Amazon.com, Inc. or its affiliates. As an Amazon Associate we earn affiliate commissions from qualifying purchases.