
The term “stock market crash” often appears in headlines with a frequency that belies its actual occurrence. For the casual observer, a particularly red day on the Dow Jones Industrial Average or a sharp dip in the S&P 500 might feel like a crash, but for seasoned investors and economists, the term carries a specific, weightier significance. A stock market crash is more than just a bad day at the office for Wall Street; it is a sudden, dramatic, and often unexpected drop in stock prices across a significant cross-section of the market. Understanding what constitutes a crash requires looking beyond the immediate panic to examine technical definitions, historical precedents, and the underlying mechanics of financial contagion.
Defining the Financial Abyss: Percentages and Velocity
While there is no single, universally agreed-upon mathematical formula that defines a crash, financial professionals generally distinguish between a dip, a correction, a bear market, and a full-scale crash based on two primary factors: the depth of the decline and the velocity with which it occurs.
The Correction vs. The Crash
In the world of investing, a “correction” is officially defined as a decline of 10% to 20% from a recent peak. Corrections are common and often healthy, serving to “cool off” overextended markets and bring valuations back in line with historical averages. A “bear market,” on the other hand, occurs when prices drop by 20% or more over a prolonged period.
A “crash,” however, is defined by its suddenness. While a bear market might take months to manifest, a crash typically unfolds over a few days or weeks. It is characterized by a double-digit percentage drop—often 10% or more within a single trading session or a very narrow window—that causes widespread panic and triggers a massive sell-off. Unlike a slow-grinding bear market, a crash feels like the floor has been pulled out from under the global economy.
The Speed of the Decline
The defining characteristic of a crash is the velocity of the downward move. When prices drop so rapidly that liquidity evaporates, the market enters a state of dysfunction. In these moments, the number of sellers vastly outweighs the number of buyers at any given price point, leading to “gaps” in the charts where the price jumps downward without any intervening trades. This speed prevents investors from reacting rationally and often triggers automated sell orders, creating a self-reinforcing loop of falling prices.
Anatomy of a Crash: Why the Floor Drops Out
Crashes rarely happen in a vacuum. They are typically the culmination of building pressures that finally reach a breaking point. Several key ingredients usually coexist before the market undergoes a violent revaluation.
Speculative Bubbles and Overvaluation
Most major crashes are preceded by a period of “irrational exuberance,” a term famously coined by former Fed Chairman Alan Greenspan. This occurs when asset prices decouple from their underlying fundamental value—such as earnings, cash flow, or economic output. When investors buy stocks not because the companies are profitable, but because they expect prices to keep rising, a speculative bubble forms. Eventually, the realization that the “emperor has no clothes” sets in, and the bubble bursts, leading to a rapid exodus of capital.
Black Swan Events and External Shocks
Sometimes, the market is fundamentally sound but is blindsided by an external shock. These are often referred to as “Black Swan” events—unpredictable occurrences that have severe consequences. Examples include the sudden onset of a global pandemic, an unexpected geopolitical conflict, or a massive natural disaster. Because the market cannot price in these risks in advance, the adjustment happens all at once, resulting in a crash.
The Role of Leverage and Margin Calls
Leverage is a powerful accelerant in any market downturn. When investors trade on margin—using borrowed money to buy stocks—they are required to maintain a certain level of equity in their accounts. As prices start to fall, brokers issue “margin calls,” demanding that investors deposit more cash or sell assets to cover their loans. When investors cannot provide the cash, the brokers liquidate their positions regardless of price. This forced selling puts further downward pressure on the market, triggering even more margin calls and creating a cascading effect of liquidation.
Historical Case Studies: Lessons from the Rubble
To truly understand what constitutes a crash, one must look at the events that shaped modern financial history. Each major crash has unique characteristics but follows a similar pattern of psychological panic.
1929: The Great Depression Catalyst
The Wall Street Crash of 1929 is the archetype of financial ruin. Following a decade of speculative growth (the Roaring Twenties), the market peaked in September and then disintegrated in late October. On “Black Tuesday,” October 29, the market fell 12%, following a 13% drop the previous day. This crash was significant not just for the immediate losses, but because it signaled the beginning of the 10-year Great Depression. It highlighted the dangers of excessive leverage and the lack of regulatory oversight in the financial markets of the era.
1987: Black Monday and the Rise of Algorithms
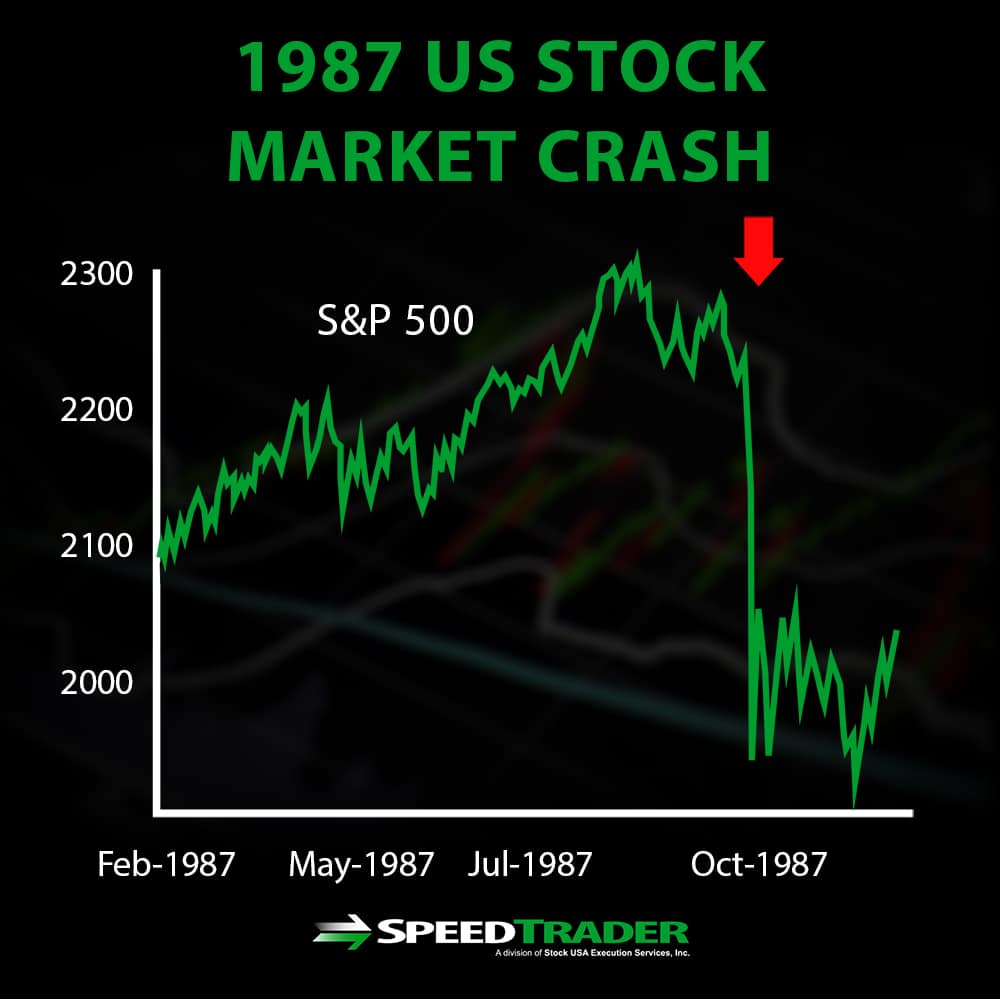
October 19, 1987, remains the largest single-day percentage decline in the history of the Dow Jones Industrial Average, which plummeted 22.6% in a few hours. Unlike 1929, there was no clear economic catalyst for the 1987 crash. Instead, it was largely blamed on “program trading”—early computer algorithms designed to sell stocks automatically when prices hit certain levels. This created a feedback loop that overwhelmed the human ability to intervene, proving that technology could exacerbate market volatility just as easily as it could facilitate growth.
2008: The Global Financial Crisis

The crash of 2008 was a structural failure rooted in the housing market and the banking system. When the subprime mortgage bubble burst, the complex financial instruments tied to those mortgages lost value, leading to the collapse of major institutions like Lehman Brothers. The stock market crash that followed was a reflection of the systemic risk inherent in the global banking sector. The S&P 500 lost approximately 50% of its value from its peak to its trough, characterized by several massive single-day drops that paralyzed credit markets.
2020: The Pandemic Flash Crash
In early 2020, the COVID-19 pandemic caused the fastest 30% decline in the history of the S&P 500. This crash was unique because it was driven by an exogenous health crisis that forced a total shutdown of the global economy. The velocity of the crash was unprecedented, but so was the recovery, as massive government stimulus and central bank intervention pumped liquidity into the system, leading to a “V-shaped” recovery that saw markets hit new highs by the end of the year.
Safeguards and Market Mechanics
In response to historical crashes, regulators have implemented various mechanisms designed to prevent a total market meltdown. These safeguards aim to provide a “cooling-off” period during times of extreme stress.
Circuit Breakers and Trading Halts
One of the most important developments since 1987 is the implementation of market-wide circuit breakers. On the New York Stock Exchange and other major platforms, trading is automatically halted if the S&P 500 drops by certain percentages relative to the previous day’s close.
A Level 1 halt occurs if the market drops 7%, pausing trading for 15 minutes. If it hits 13% (Level 2), it pauses for another 15 minutes. If the decline reaches 20% (Level 3), trading is suspended for the remainder of the day. These pauses are designed to stop panic selling and give investors time to process information and for liquidity to return to the order books.
The Role of Central Banks
Central banks, such as the Federal Reserve, play a crucial role during a crash. By lowering interest rates and engaging in “quantitative easing” (buying government bonds and other securities), they inject liquidity into the financial system. The goal is to ensure that banks can continue to lend and that the “plumbing” of the financial world remains functional even when the stock market is in a freefall. While critics argue this creates a “moral hazard,” it has become a standard tool for preventing a market crash from turning into a full-scale economic depression.
The Psychology of Panic: Behavioral Finance in Crisis
Beyond the charts and percentages, a stock market crash is fundamentally a psychological event. Markets are made of human participants, and humans are prone to emotional extremes.
Herd Mentality and the Feedback Loop
In a rising market, investors fear “missing out” (FOMO). In a crashing market, that emotion flips to a desperate fear of loss. When prices begin to drop sharply, individual investors see their neighbors and institutional giants selling, and they feel compelled to do the same to protect what capital they have left. This herd mentality ignores fundamental value in favor of immediate safety.
Loss Aversion and Rationality
Behavioral finance teaches us that the pain of a loss is felt twice as intensely as the joy of an equivalent gain. This “loss aversion” explains why investors often sell at the very bottom of a crash. When the perceived risk becomes unbearable, the drive to “make it stop” overrides the rational understanding that markets historically recover. Identifying a crash in real-time is difficult because the emotional noise often drowns out the analytical data.
Surviving the Storm: Portfolio Management Strategies
For the individual investor, the best way to handle a stock market crash is to prepare for one before it happens. While a crash is destructive in the short term, it also creates the foundation for future wealth for those who remain disciplined.
Rebalancing During Volatility
A crash often knocks a portfolio’s asset allocation out of alignment. If an investor’s target is 60% stocks and 40% bonds, a 20% drop in stocks will leave them “underweight” in equities. Ironically, the most mathematically sound move during a crash is to sell bonds and buy the very stocks that are falling. This forces the investor to “buy low,” positioning them for maximum gains during the eventual recovery.
The Importance of Liquid Reserves
The primary danger during a crash isn’t the drop in portfolio value—it’s being forced to sell assets to cover living expenses. Maintaining an emergency fund of 6 to 12 months of expenses in a liquid savings account ensures that an investor can leave their portfolio untouched while the market finds its footing.

Identifying Long-Term Opportunity in Chaos
History shows that every stock market crash has eventually been followed by a recovery that surpasses previous highs. For those with a long-term horizon (10 years or more), a crash is essentially a “sale” on the world’s most productive companies. By staying invested and continuing to contribute through dollar-cost averaging, investors can lower their average cost per share, turning a moment of financial crisis into a significant driver of long-term wealth accumulation.
In conclusion, a stock market crash is defined by its suddenness, its depth, and the breakdown of normal market functioning. While it is a period of intense financial and emotional stress, it is a recurring feature of the global financial system. By understanding the thresholds, the historical context, and the psychological triggers involved, investors can transition from being victims of a crash to being strategic participants in the market’s inevitable cycles.
aViewFromTheCave is a participant in the Amazon Services LLC Associates Program, an affiliate advertising program designed to provide a means for sites to earn advertising fees by advertising and linking to Amazon.com. Amazon, the Amazon logo, AmazonSupply, and the AmazonSupply logo are trademarks of Amazon.com, Inc. or its affiliates. As an Amazon Associate we earn affiliate commissions from qualifying purchases.