In the rapidly evolving world of technology, data is often described as the new oil. From the algorithms driving our social media feeds to the architectural decisions behind enterprise software-as-a-service (SaaS) platforms, every move is informed by data. However, not all data is created equal. To build products that are both technically functional and deeply resonant with users, technology professionals must master two distinct but complementary approaches: quantitative and qualitative research methods.
While the tech industry has historically leaned toward the “quantifiable”—metrics, server logs, and conversion rates—the rise of User Experience (UX) design and human-centric engineering has brought qualitative insights to the forefront. Understanding the nuances between these two methodologies is not just an academic exercise; it is a strategic necessity for product managers, software engineers, and data scientists aiming to build the next generation of digital tools.
The Core Pillars: Understanding Qualitative and Quantitative Research in Technology
Before diving into specific applications, it is essential to establish a foundational understanding of what these two methods entail within a technological framework.
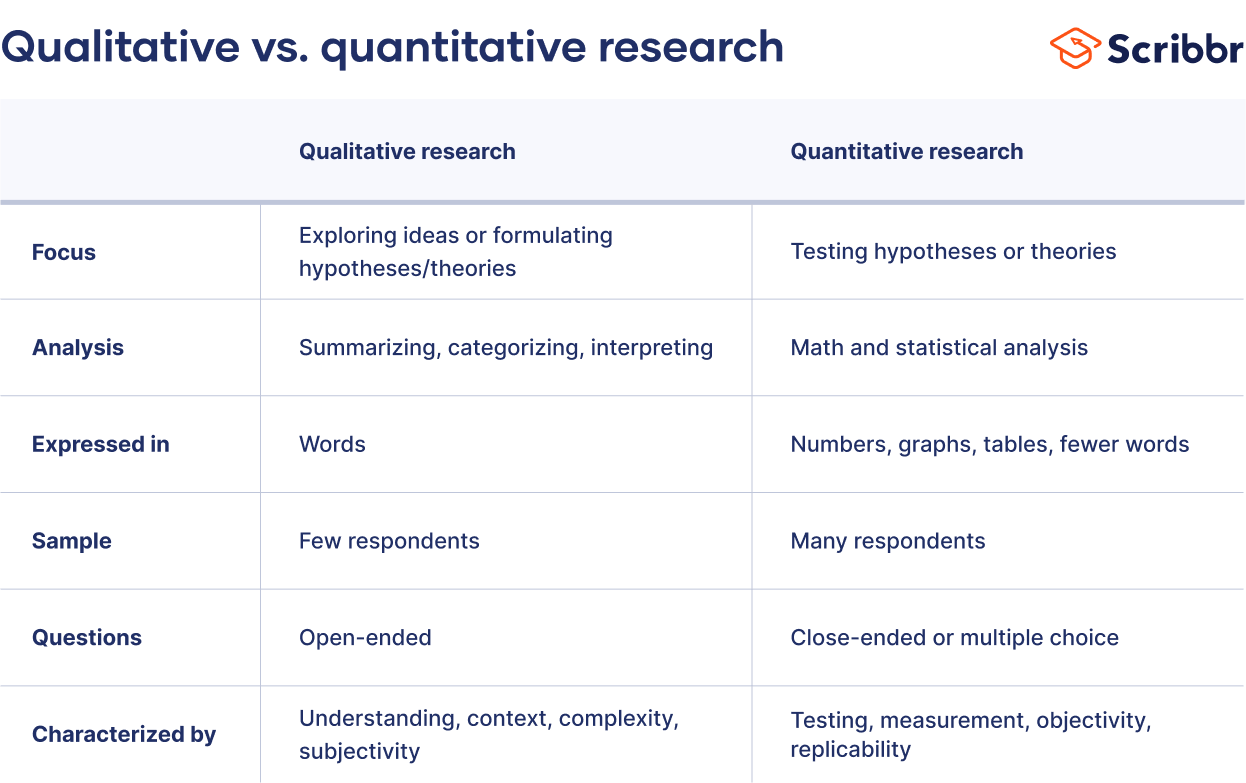
Defining Quantitative Data: The Language of Numbers
Quantitative research in tech is about the “what,” the “how many,” and the “how often.” It involves the collection and analysis of numerical data to identify patterns, make predictions, and generalize findings across a large user base. In the context of software development, quantitative data is objective and measurable. It thrives on large sample sizes, providing statistical power that allows teams to state with confidence that “Feature A increased user retention by 15%.”
This method relies heavily on structured tools—automated logging, surveys with closed-ended questions, and telemetry. Because it is numerical, quantitative data is easily visualized through dashboards and graphs, making it the preferred language for stakeholders looking for clear, bottom-line results.
Defining Qualitative Data: Uncovering the Human Experience
If quantitative data provides the skeleton of user behavior, qualitative data provides the flesh and blood. Qualitative research focuses on the “why” and the “how.” It is exploratory, seeking to understand the underlying motivations, frustrations, and emotions of the person behind the screen.
In tech, this often involves non-numerical data like interview transcripts, video recordings of user sessions, or open-ended feedback. Qualitative methods are inherently subjective and involve smaller, more targeted groups of people. Rather than seeking statistical significance, the goal is to achieve “thematic saturation”—the point where no new insights are being discovered. This approach is vital for identifying friction points in a user interface (UI) that a spreadsheet might never reveal.
Quantitative Methods in the Tech Ecosystem: Measuring Success at Scale
Quantitative methods are the backbone of data science and performance engineering. In an era of Big Data, the ability to process millions of data points allows tech companies to optimize their products with surgical precision.
Analytics and Big Data: Monitoring User Behavior
Modern tech stacks are designed to be self-reporting. Through tools like Google Analytics, Mixpanel, or custom-built internal telemetry, companies track every click, swipe, and hover. This quantitative stream allows developers to see exactly how users navigate a platform. For instance, if a cloud-based collaboration tool notices a 40% drop-off at the “Invite Teammates” screen, the quantitative data has successfully flagged a critical failure point in the user journey.
A/B Testing: The Scientific Method for UI/UX
Perhaps the most famous quantitative method in tech is A/B testing (or multivariate testing). By presenting two different versions of a feature to two different groups of users, teams can measure which version performs better based on a specific metric, such as click-through rate or sign-up completion. This takes the guesswork out of design. Whether it is the color of a “Buy Now” button or the placement of a navigation bar, quantitative testing ensures that the final product is optimized for maximum efficiency.
Performance Metrics and KPIs
Beyond the user interface, quantitative methods are used to monitor system health. Key Performance Indicators (KPIs) such as “Latency,” “Uptime,” “Mean Time to Recovery (MTTR),” and “API Response Times” are purely quantitative. These metrics allow DevOps teams to maintain the infrastructure that powers the digital economy. Without these numerical benchmarks, tech companies would be unable to scale their services to meet global demand.
Qualitative Methods: Solving the “Why” Behind the Interface
While numbers can show that a user quit an app, they cannot explain that the user felt the font was too small or that they didn’t trust the app’s data privacy settings. This is where qualitative methods become indispensable.
User Interviews and Focus Groups
In the early stages of the Software Development Life Cycle (SDLC), qualitative interviews are used to define the problem space. By speaking directly to potential users, product teams can uncover “unmet needs.” These deep dives allow researchers to observe body language and tone of voice, providing a layer of empathy that a survey can never replicate. In a focus group setting, the interaction between participants can spark new ideas for features that the engineering team might not have considered.
Usability Testing: Observing Real-World Interaction
Usability testing is the cornerstone of qualitative UX research. A researcher watches a user attempt to complete a specific task using a prototype or an existing live site. The user is often encouraged to “think out loud.” This process reveals the cognitive load required to use a piece of software. If a user pauses for five seconds before finding the “Save” button, that is a qualitative insight that suggests the button’s placement is unintuitive—even if the quantitative data eventually shows that 90% of users do find it.
Ethnographic Studies in Digital Spaces
As technology becomes more integrated into our daily lives, “digital ethnography” has emerged as a key qualitative tool. This involves observing how users interact with technology in their natural environments—at home, in a noisy coffee shop, or during a busy commute. Understanding that a mobile banking app is often used with one hand while the user is walking allows developers to optimize for “thumb-reach” and high-contrast visuals, a qualitative realization that drives quantitative success.
The Power of Mixed Methods: Bridging the Gap for Product Excellence
In the most successful tech organizations, qualitative and quantitative methods are not used in isolation. Instead, they form a feedback loop known as “mixed methods” research.
Triangulation: Validating Data Points
Triangulation is the process of using both methods to verify a single hypothesis. For example, if quantitative data shows a high bounce rate on a checkout page, and qualitative interviews reveal that users find the shipping costs confusing, the two data points validate each other. The tech team can then move forward with a redesign, confident that they are solving the right problem.
Iterative Design: From Insights to Deployment
The Agile methodology, which dominates modern software development, thrives on the mixed-methods approach.
- Discovery (Qualitative): Interview users to find a problem.
- Prototyping: Build a solution.
- Validation (Quantitative): A/B test the solution.
- Refinement (Qualitative): Ask users why they preferred one version over the other.
This cycle ensures that the product is not just “technically sound” but also “user-approved.”
Navigating the Modern Tech Landscape: Tools and Best Practices
As we look toward the future, the tools used to collect and analyze these two types of data are becoming increasingly sophisticated, often powered by Artificial Intelligence.
AI and Machine Learning in Data Synthesis
Artificial Intelligence is beginning to blur the lines between qualitative and quantitative analysis. Natural Language Processing (NLP) can now take thousands of qualitative customer reviews and perform “sentiment analysis,” essentially turning subjective words into a quantitative “positivity score.” Similarly, AI-driven heatmaps can synthesize millions of individual user sessions into a visual representation of focus, allowing for a quantitative look at qualitative behavior.

Choosing the Right Approach for Your Roadmap
Determining which method to prioritize depends on the stage of your product’s lifecycle:
- Ideation Phase: Lean heavily on Qualitative methods to find your Product-Market Fit.
- Growth Phase: Prioritize Quantitative methods to scale efficiently and optimize conversions.
- Maturity Phase: Use a Mixed Methods approach to protect your market share and innovate against new competitors.
In conclusion, the debate is not about which method is superior, but how to use them in tandem. Quantitative methods provide the scale and the “what,” while qualitative methods provide the soul and the “why.” For tech leaders and creators, the ability to switch between these two lenses is what separates a functional piece of code from a transformative digital experience. By mastering both, you ensure that your technology is not just data-driven, but human-centered.
aViewFromTheCave is a participant in the Amazon Services LLC Associates Program, an affiliate advertising program designed to provide a means for sites to earn advertising fees by advertising and linking to Amazon.com. Amazon, the Amazon logo, AmazonSupply, and the AmazonSupply logo are trademarks of Amazon.com, Inc. or its affiliates. As an Amazon Associate we earn affiliate commissions from qualifying purchases.