
In the world of business and finance, numbers are the language of success. Whether you are an entrepreneur building a startup, an investor scouting for the next market leader, or a professional looking to sharpen your financial literacy, understanding financial statements is non-negotiable. These documents are more than just spreadsheets; they are the narrative of a company’s past, present, and potential future.
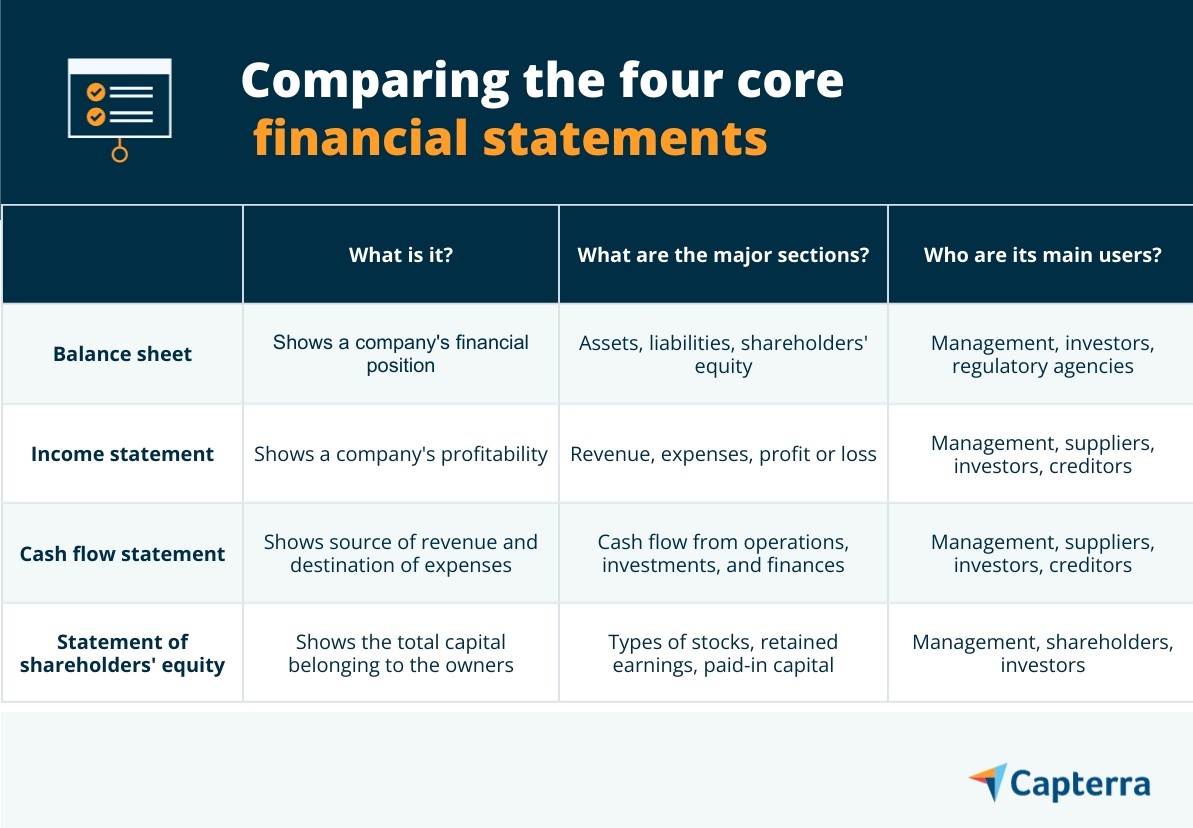
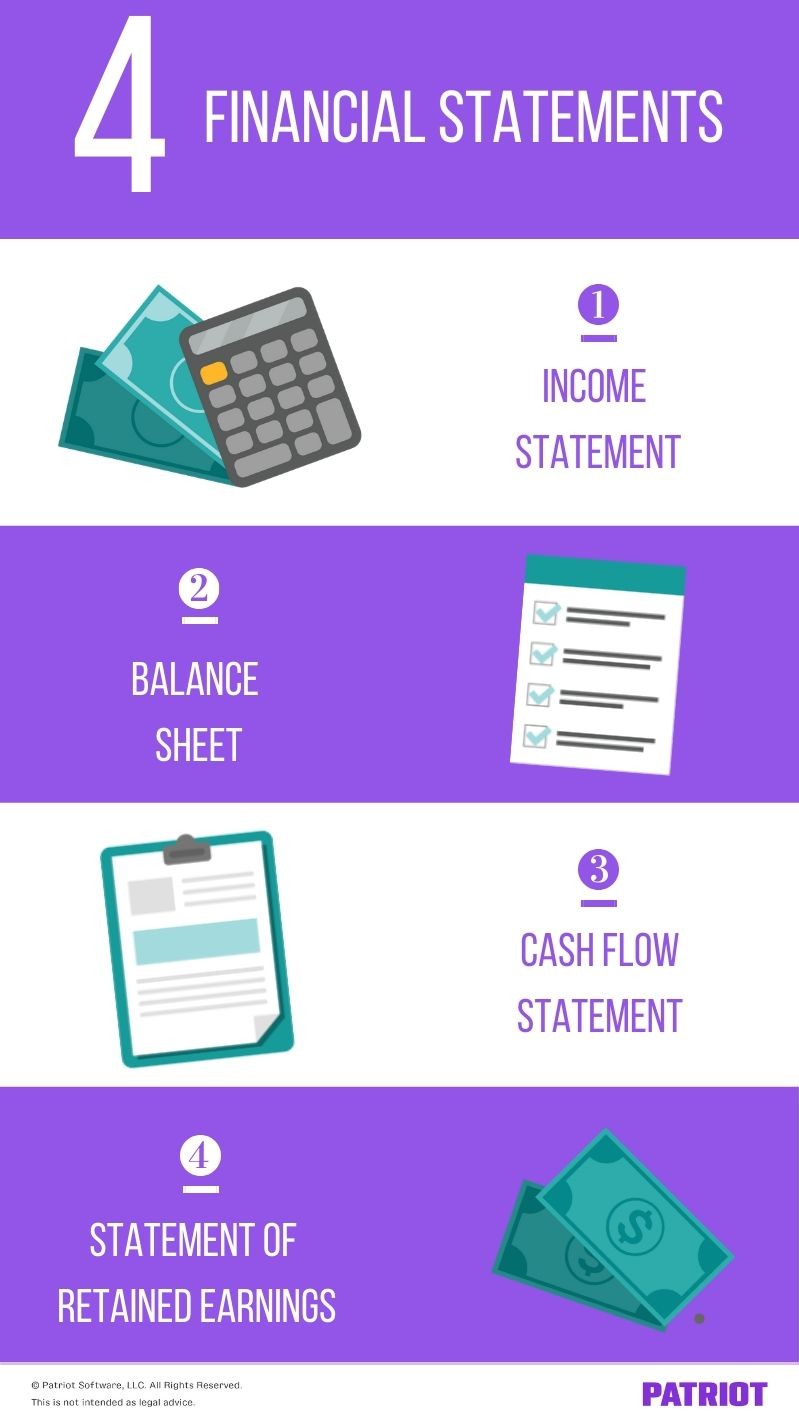
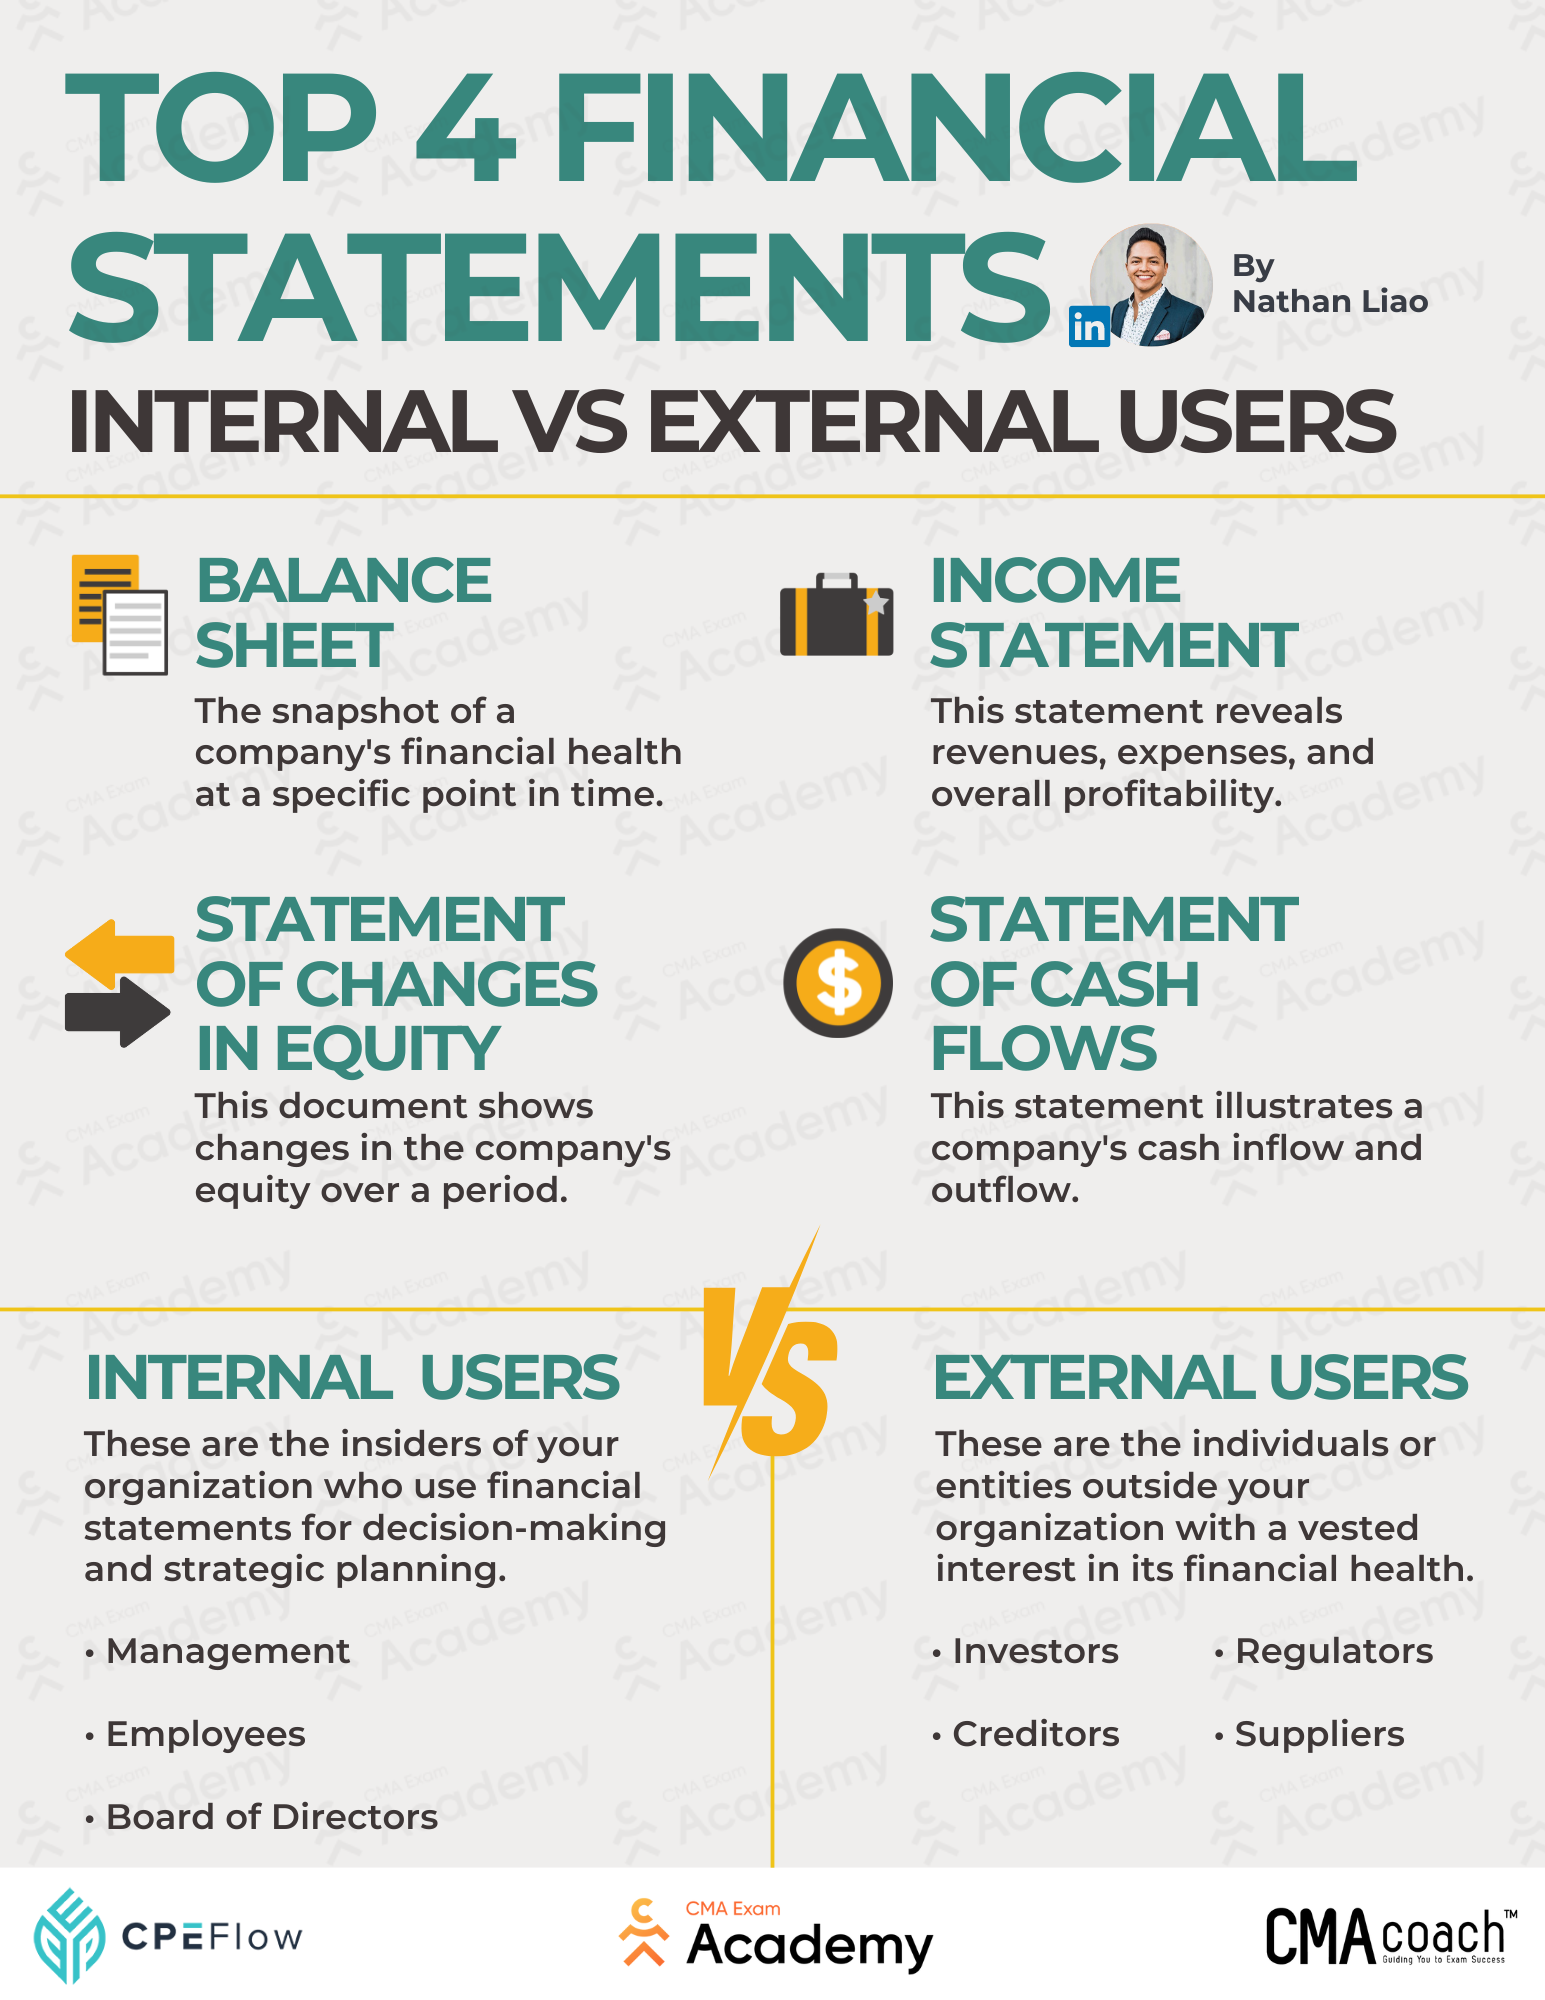
Financial statements provide a structured representation of a firm’s financial performance and liquidity. They allow stakeholders to evaluate the risk and return associated with a business entity. While there are numerous internal reports used by management, four primary financial statements are universally recognized under standard accounting frameworks like Generally Accepted Accounting Principles (GAAP) and International Financial Reporting Standards (IFRS). These are the Balance Sheet, the Income Statement, the Cash Flow Statement, and the Statement of Retained Earnings (or Shareholders’ Equity).
The Balance Sheet: A Snapshot of Financial Position
The Balance Sheet is often referred to as the “Statement of Financial Position.” Unlike other statements that cover a period of time, the balance sheet provides a snapshot of a company’s financial health at a specific point in time—usually at the end of a fiscal quarter or year. It is built upon the fundamental accounting equation: Assets = Liabilities + Shareholders’ Equity.
Understanding Assets: What the Company Owns
Assets represent the resources a company controls that are expected to provide future economic benefits. These are generally categorized based on their liquidity—how quickly they can be converted into cash.
- Current Assets: These include cash, cash equivalents, accounts receivable (money owed by customers), and inventory. These are expected to be used or converted into cash within one year.
- Non-current Assets: Also known as long-term assets, these include Property, Plant, and Equipment (PP&E), intangible assets like patents or trademarks, and long-term investments. These provide value over many years.
Liabilities: What the Company Owes
Liabilities are a company’s financial obligations to outside parties. Like assets, they are categorized by their due dates.
- Current Liabilities: Obligations due within a year, such as accounts payable, short-term debt, and accrued expenses.
- Long-term Liabilities: These are obligations that extend beyond one year, such as long-term bonds issued by the company or lease obligations.
Shareholders’ Equity: The Residual Interest
Shareholders’ equity is what remains after all liabilities are subtracted from total assets. It represents the “book value” of the company and belongs to the owners. It consists of the capital originally invested by shareholders plus any retained earnings that have been plowed back into the business rather than paid out as dividends.
The Income Statement: Measuring Performance Over Time
While the balance sheet is a snapshot, the Income Statement (or Profit and Loss Statement) is a motion picture. It measures a company’s financial performance over a specific reporting period, such as a month, quarter, or year. The primary goal of the income statement is to show whether a company made a profit or suffered a loss.
Revenue and Cost of Goods Sold (COGS)
At the very top of the statement is Revenue (or Sales), representing the total amount of money generated from the company’s primary operations. Immediately following revenue is the Cost of Goods Sold (COGS), which includes the direct costs attributable to the production of goods or services. Subtracting COGS from Revenue gives us Gross Profit, a key indicator of production efficiency.
Operating Expenses and EBIT
Below gross profit, the statement lists operating expenses, which include costs like rent, salaries, marketing, and research and development. These are the costs required to keep the business running but are not directly tied to production.
Once operating expenses are subtracted, we arrive at Operating Income, also known as Earnings Before Interest and Taxes (EBIT). This figure is critical for investors because it shows how well the core business is performing without the influence of tax jurisdictions or financing structures.
The Bottom Line: Net Income
The final section of the income statement accounts for non-operating items, such as interest expense on debt and corporate income taxes. After these are subtracted, we reach the “bottom line”—Net Income. This is the actual profit available to shareholders. A positive net income indicates profitability, while a negative figure indicates a net loss.
The Cash Flow Statement: Tracking the Lifeline of the Business
One of the most important lessons in finance is that profit does not equal cash. A company can report a massive net income on its income statement but still go bankrupt because it lacks the liquidity to pay its bills. The Cash Flow Statement bridges this gap by tracking the actual movement of cash into and out of the business during a period. It is divided into three distinct categories.
Operating Activities
This section is the most important for assessing the long-term viability of a business. It adjusts net income for non-cash items (like depreciation) and changes in working capital (like accounts receivable and inventory). Ideally, a healthy company should generate the majority of its cash from its core operating activities, rather than from borrowing or selling assets.
Investing Activities
This section records cash spent on or generated from long-term assets. If a company buys a new factory or invests in equipment, it shows up here as a cash outflow. Conversely, if the company sells a piece of machinery, it appears as an inflow. Significant outflows here often signal that a company is investing in its own future growth.
Financing Activities
This section tracks the flow of cash between the company and its owners or creditors. Activities include issuing or repurchasing stock, taking out loans, repaying debt, and paying dividends to shareholders. For example, if a company takes out a $1 million bank loan, it will show as a cash inflow in this section, even though it increases the company’s total debt.
The Statement of Retained Earnings
The Statement of Retained Earnings (sometimes integrated into a broader Statement of Shareholders’ Equity) is often the most overlooked of the four, but it provides the essential link between the Income Statement and the Balance Sheet. It explains how a company’s earnings are distributed or reinvested.
Linking Profit to the Balance Sheet
At the beginning of a reporting period, a company has a certain amount of retained earnings. During the period, the Net Income (from the Income Statement) is added to this beginning balance. If the company pays out dividends to its shareholders, those dividends are subtracted.
Reinvestment for Growth
The remaining figure is the “Ending Retained Earnings,” which is then recorded under the Shareholders’ Equity section of the Balance Sheet. This statement is vital for investors because it reveals a company’s dividend policy and its strategy for growth. A company that retains most of its earnings is typically looking to fund expansion internally, while a company that pays out a large portion of earnings as dividends is signaling a commitment to returning value to shareholders in the short term.
Integrating the Statements for Strategic Decision Making
Viewing these four statements in isolation is a mistake. The true power of financial analysis comes from understanding how they interact. No single statement tells the whole story, but together, they form a comprehensive view of a company’s financial health and strategic direction.
Ratio Analysis and Performance Metrics
By pulling data from different statements, analysts can calculate financial ratios that provide deeper insights:
- Current Ratio (Balance Sheet): Measures a company’s ability to pay short-term obligations by comparing current assets to current liabilities.
- Return on Equity (Income Statement + Balance Sheet): Shows how efficiently management is using shareholder investments to generate profit by dividing Net Income by Shareholders’ Equity.
- Debt-to-Equity Ratio (Balance Sheet): Indicates the company’s financial leverage and risk profile.
The Importance of Transparency
For business owners, these statements are internal diagnostic tools. They highlight where costs are spiraling out of control, where cash is being trapped in inventory, and whether the business is truly scalable. For investors, they are a shield against poor decision-making. By scrutinizing the cash flow statement against the income statement, an investor can spot “red flags,” such as aggressive revenue recognition that doesn’t result in actual cash flow.
In conclusion, the four financial statements—the Balance Sheet, Income Statement, Cash Flow Statement, and Statement of Retained Earnings—are the pillars of business finance. Mastering them allows you to look past the marketing hype and see the reality of a company’s performance. Whether you are managing your own business finances or analyzing a Fortune 500 company, these documents provide the transparency and clarity needed to make informed, data-driven decisions in an ever-changing economic landscape.
aViewFromTheCave is a participant in the Amazon Services LLC Associates Program, an affiliate advertising program designed to provide a means for sites to earn advertising fees by advertising and linking to Amazon.com. Amazon, the Amazon logo, AmazonSupply, and the AmazonSupply logo are trademarks of Amazon.com, Inc. or its affiliates. As an Amazon Associate we earn affiliate commissions from qualifying purchases.