
The world of stock market investing often seems shrouded in complex jargon, intimidating newcomers and sometimes confusing even seasoned participants. Among the most frequently used, yet often misunderstood, terms is “points.” When financial news reports that the Dow Jones Industrial Average is “up 300 points” or a bond yield has “moved 10 basis points,” what exactly does this signify? Are points synonymous with dollars? Do they hold the same value across all financial instruments?
Understanding “points” is fundamental to grasping how financial markets communicate price movements and overall performance. Far from being a mere abstract concept, points are a critical metric that helps investors gauge market sentiment, measure returns, and manage risk. This article will demystify the concept of points, exploring their various manifestations across different asset classes, clarifying their practical implications, and equipping you with the knowledge to interpret market movements with greater clarity and confidence. By the end, you’ll not only understand what points are but also why they are an indispensable part of your financial literacy toolkit.
Demystifying “Points” in Financial Markets
At its core, a “point” in the financial markets represents a unit of price change. However, its specific meaning and monetary value can vary significantly depending on the asset being discussed. It’s a standardized way to quantify movement, making it easier to track and report changes in market values, especially for indices and certain derivatives.
The Fundamental Unit of Price Movement
Think of a “point” as the smallest increment by which a price or index can fluctuate, though this definition becomes more nuanced with different asset classes. In a broad sense, it quantifies how much a security, commodity, or index has moved from a previous level. For instance, if an index opens at 10,000 and closes at 10,100, it has moved up by 100 points. This immediate, clear numerical representation offers a snapshot of market activity without needing to delve into complex calculations of percentage changes for initial understanding. This direct reporting helps in quick assessment of daily market performance, providing an intuitive measure of gains or losses relative to a starting point.
Distinguishing Points from Dollars
One of the most common misconceptions is equating a “point” directly with a “dollar.” While a point can sometimes be equivalent to a dollar (or a cent, or a fraction of a dollar), this is not universally true. The monetary value of a single point is highly context-dependent. For an individual stock trading at $50, a 1-point move might mean a $1 change in its price. However, for a major stock market index like the S&P 500, a single point change might represent a collective movement of hundreds of underlying stocks, and its dollar equivalent for an investor depends on whether they are invested in an index fund, an ETF, or a derivative product, and at what scale. The key takeaway is that points are a unit of change, and their translation into actual currency gain or loss requires understanding the specific instrument and the size of your position.
Why Points Matter for Investors
For investors, tracking points is crucial for several reasons. Firstly, it provides a quick and universal language for discussing market performance. When analysts talk about a “strong day” for the market, they often refer to significant point gains. Secondly, points help in gauging market sentiment and volatility. Large swings in points often indicate periods of high uncertainty or strong directional conviction. Thirdly, for those trading derivatives like futures or options, the value of a point is precisely defined by the contract specifications, directly impacting profit and loss calculations. Understanding these specific point values is vital for managing risk and determining potential returns on investment. Without understanding the context of points, an investor might misinterpret market news, misjudge the significance of price changes, or inaccurately assess their portfolio’s performance.
Points in Different Market Contexts
The term “points” is applied across various financial markets, but its precise definition and implications shift with the asset class. Understanding these distinctions is key to a comprehensive grasp of financial news and investment analysis.
Equities and Stock Indices
When people generally talk about “points” in the stock market, they are most often referring to the major stock market indices.
Individual Stocks: Dollars and Cents
For individual company stocks, price movements are typically expressed in dollars and cents. If Apple stock moves from $170.00 to $171.50, it’s described as a $1.50 increase, not a 1.5-point increase. While one could hypothetically refer to it as “150 cents,” it’s not standard practice. The raw dollar value is the direct measure for single equity shares.
Stock Indices (e.g., Dow Jones, S&P 500)
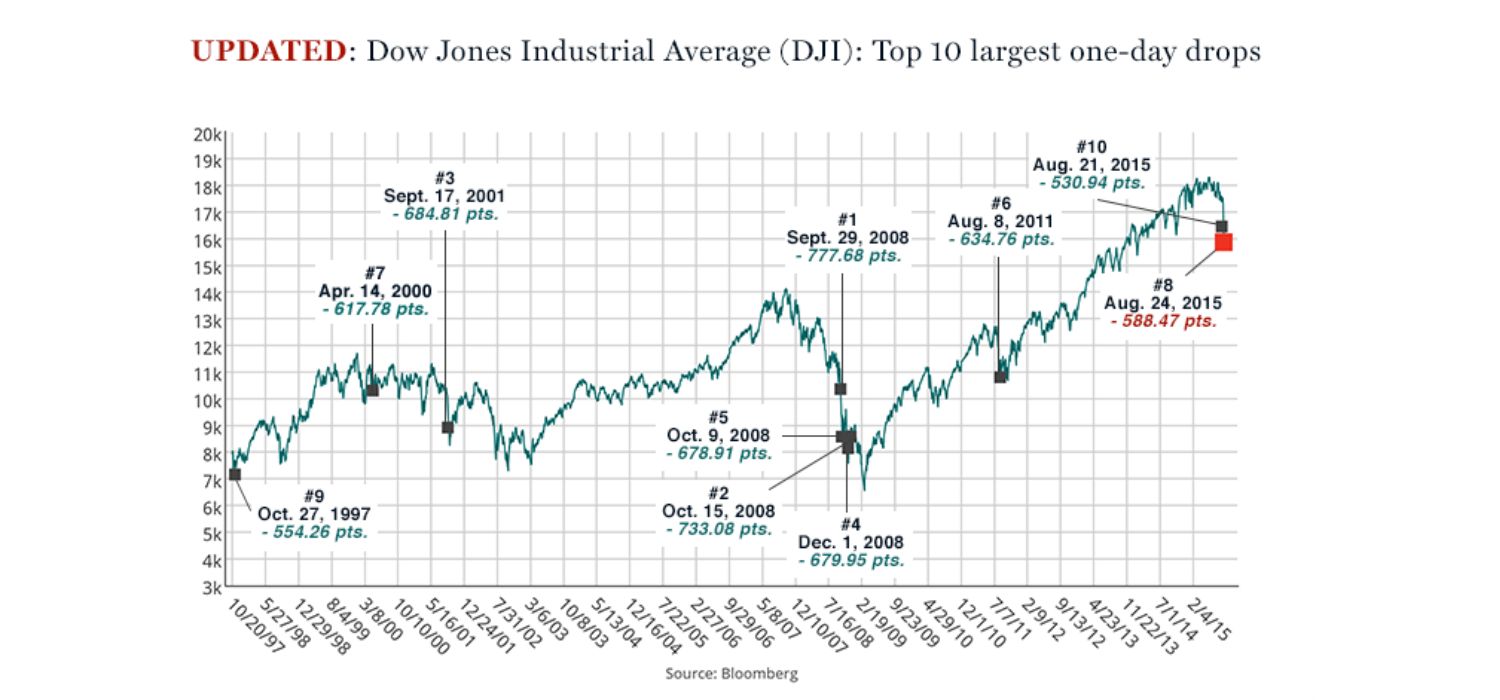
This is where “points” truly come into their own. Stock market indices like the Dow Jones Industrial Average (DJIA), S&P 500, or NASDAQ Composite are not directly traded like individual stocks. Instead, they represent a weighted average or sum of the prices of a basket of underlying stocks. When the DJIA, for example, is reported to be “up 300 points,” it means the numerical value of that index has increased by 300 units. Each index has its own methodology for calculating its point value, which reflects the collective movement of its constituent stocks. A point in the DJIA doesn’t equal a dollar or a specific percentage; it’s a proprietary calculation. For instance, a 100-point move in the Dow when it’s at 35,000 is a much smaller percentage change than a 100-point move when it was at 10,000. These index points are critical indicators of the broader market’s health and direction.
Commodities and Futures
Commodity markets, which include everything from crude oil and gold to agricultural products, also utilize “points” or similar terms to denote price changes, especially in their futures contracts.
Crude Oil, Gold, and Other Commodities
In commodity futures trading, price movements are often quoted in “ticks” or “points,” which have a specific monetary value per contract. For example, crude oil futures might move in increments of $0.01 per barrel, where each cent is a “tick.” A full “point” could represent $1.00. Given that a standard crude oil futures contract represents 1,000 barrels, a single $1.00 point move (100 ticks) translates to a $1,000 change in the contract’s value. Similarly, gold futures might trade in increments of $0.10 per troy ounce. Understanding these contract specifications is paramount for traders to calculate potential profits and losses accurately.
Currencies (Forex) and Basis Points
The foreign exchange (forex) market and bond market have their own distinct terminologies for expressing small price or yield changes.
Pips in Forex
In the forex market, the smallest unit of price movement for a currency pair is known as a “pip” (percentage in point). For most currency pairs, a pip is the fourth decimal place (0.0001). For example, if the EUR/USD pair moves from 1.1050 to 1.1051, it has moved up by one pip. For pairs involving the Japanese Yen, a pip is typically the second decimal place (0.01). While technically a “point,” the specialized term “pip” is universally used by forex traders due to the extremely granular nature of currency price changes and the large leverage often involved.
Basis Points (BPS) for Interest Rates and Bonds
When discussing interest rates, bond yields, or other fixed-income instruments, the term “basis point” (BPS) is predominantly used. One basis point is equal to one-hundredth of a percentage point (0.01%). So, if the Federal Reserve raises interest rates from 0.25% to 0.50%, they have increased rates by 25 basis points. If a bond’s yield moves from 3.50% to 3.65%, it has increased by 15 basis points. Basis points are crucial for financial professionals and investors in fixed-income markets because even small percentage changes can have significant implications for the value of large bond portfolios or the cost of borrowing. This granular measurement allows for precise communication of minute, yet impactful, shifts in interest rate environments.
The Practical Application of Understanding Points
Beyond theoretical definitions, a solid grasp of “points” profoundly impacts how investors and financial professionals navigate and interpret market dynamics. It’s a fundamental concept that underpins market analysis, risk management, and effective financial communication.
Gauging Market Sentiment and Volatility
Point movements serve as immediate indicators of market sentiment and volatility. A day where a major index like the S&P 500 swings wildly, perhaps up 200 points in the morning and down 300 points by the afternoon, signals high volatility and potentially significant uncertainty among investors. Conversely, a day with minimal point changes suggests a calm, perhaps indecisive, market. Large point gains or losses on significant news releases (e.g., inflation data, corporate earnings, geopolitical events) instantly communicate the market’s reaction. By observing the magnitude and speed of point changes, investors can quickly assess the prevailing mood – whether bullish optimism, bearish pessimism, or market-wide apprehension – informing their decisions about entering or exiting positions.
Performance Measurement and Benchmarking
Points are invaluable for measuring the performance of an investment or a portfolio, especially when benchmarking against a market index. While percentage change offers a normalized comparison, point changes provide an absolute measure that can be particularly relevant for large-scale institutional investments or index-tracking funds. For example, if your investment portfolio gained 500 points on a day when the benchmark index gained 400 points, it suggests outperformance in absolute terms. However, it’s crucial to also look at the percentage change to understand the relative performance, especially if your portfolio has a significantly different capital base than the index. Nonetheless, reporting in points offers a digestible figure for daily news and quick comparisons.
Risk Management and Stop-Loss Orders
For active traders and those managing leveraged positions, understanding the monetary value of a point is absolutely critical for risk management. Stop-loss orders, which automatically close a position if it reaches a certain loss threshold, are often set a specific number of points (or pips) away from the entry price. Knowing that a 100-point move in a particular futures contract translates to a $1,000 loss (or gain) allows traders to size their positions appropriately and define their maximum acceptable risk per trade. Miscalculating the value of a point can lead to unexpected and potentially catastrophic losses, underscoring the importance of precise knowledge in this area.
News Reporting and Financial Communication
“Points” form the backbone of financial news reporting. Every evening, financial news channels and websites will invariably lead with headlines like “Dow finishes up 250 points” or “S&P 500 dips 15 points.” This standardized reporting makes it easy for a broad audience to quickly grasp the direction and general magnitude of market movements without getting bogged down in intricate percentage calculations initially. It’s a universal shorthand for market performance, allowing for clear and concise communication across different media and platforms, and forming the basis of immediate public understanding of financial market trends.
Beyond the Basics: Advanced Considerations
While the foundational understanding of points is crucial, seasoned investors and market participants delve deeper into their implications, recognizing subtleties that can influence investment strategy and perception.
The “Value” of a Point: A Variable Landscape
Perhaps the most important advanced consideration is the variable “value” of a point. As discussed, a point is not a fixed monetary unit across all instruments. A 100-point move in the Dow Jones Industrial Average when the index is at 10,000 represents a 1% change. The exact same 100-point move when the index is at 35,000 represents a mere ~0.28% change. This highlights that while the absolute point change might be the same, its relative impact on portfolios and its significance to the broader economy can differ drastically based on the current market levels. Investors must always contextualize point movements by considering the base value of the instrument to truly understand the magnitude of the change. This also applies to individual derivatives contracts where the “point value” (the dollar amount per point) is explicitly defined by the exchange.
Psychological Impact of Point Movements
The human element plays a significant role in market dynamics, and point movements can have a profound psychological impact on investors. Large, rapid point drops can trigger panic selling, regardless of the underlying fundamentals. Conversely, sustained point gains can foster overconfidence and lead to irrational exuberance. News headlines often emphasize the absolute point changes, which can sometimes magnify the perceived severity or positivity of market movements in the minds of less experienced investors. Understanding this psychological aspect helps investors maintain a rational perspective, focusing on long-term goals and fundamental analysis rather than reacting impulsively to daily point swings. It encourages a disciplined approach, resisting the urge to chase gains or flee losses based solely on headline numbers.
Points vs. Percentage Changes: When to Use Which
While points offer an immediate, absolute measure of change, percentage changes provide a normalized, relative measure that is often more useful for comparative analysis. A 100-point gain on a low-value index is much more significant (in percentage terms) than the same 100-point gain on a high-value index. For comparing the performance of diverse assets – say, a tech stock, a bond fund, and a commodity ETF – percentage changes are the superior metric. They adjust for differences in asset prices and allow for “apples-to-apples” comparisons of returns and volatility. However, points still dominate daily news reporting for major indices because they offer a quick, digestible figure. A sophisticated investor will utilize both: points for understanding immediate market headlines and absolute scale of movement, and percentage changes for rigorous performance analysis, benchmarking, and cross-asset comparisons.

Conclusion: Navigating the Market with Clarity
The concept of “points” in the stock market, though initially appearing straightforward, reveals itself to be a nuanced and multifaceted aspect of financial market language. From the broad strokes of stock index movements to the granular precision of basis points in fixed income and pips in forex, points serve as the fundamental units by which price changes are measured and communicated. They are not merely abstract numbers but powerful indicators that reflect market sentiment, gauge volatility, and inform critical investment decisions.
For any investor, regardless of experience level, a clear understanding of what points signify in different contexts is indispensable. It empowers you to move beyond superficial headlines, allowing for a deeper interpretation of market activity, a more accurate assessment of investment performance, and a disciplined approach to risk management. By appreciating that the monetary value of a point is variable and that its significance must be viewed through the lens of percentage changes and underlying market levels, you gain a more sophisticated perspective.
In a world where financial information bombards us daily, the ability to decode jargon like “points” transforms raw data into actionable insights. It’s a crucial step towards becoming a more informed, confident, and ultimately, more successful participant in the dynamic world of financial markets. Embrace this understanding, and you’ll find yourself navigating the complexities of investing with newfound clarity and control.
aViewFromTheCave is a participant in the Amazon Services LLC Associates Program, an affiliate advertising program designed to provide a means for sites to earn advertising fees by advertising and linking to Amazon.com. Amazon, the Amazon logo, AmazonSupply, and the AmazonSupply logo are trademarks of Amazon.com, Inc. or its affiliates. As an Amazon Associate we earn affiliate commissions from qualifying purchases.