
Microsoft Excel is more than just a grid of rows and columns; it is the fundamental engine that powers the modern data-driven world. Since its debut in the mid-1980s, Excel has evolved from a simple accounting tool into a sophisticated software ecosystem used by students, data scientists, and Fortune 500 executives alike. At its core, an Excel spreadsheet is a digital ledger designed for organizing, analyzing, and storing data in a tabular format. By combining a flexible user interface with powerful computational features, it serves as the universal language of business and technology.
The Anatomy of an Excel Spreadsheet
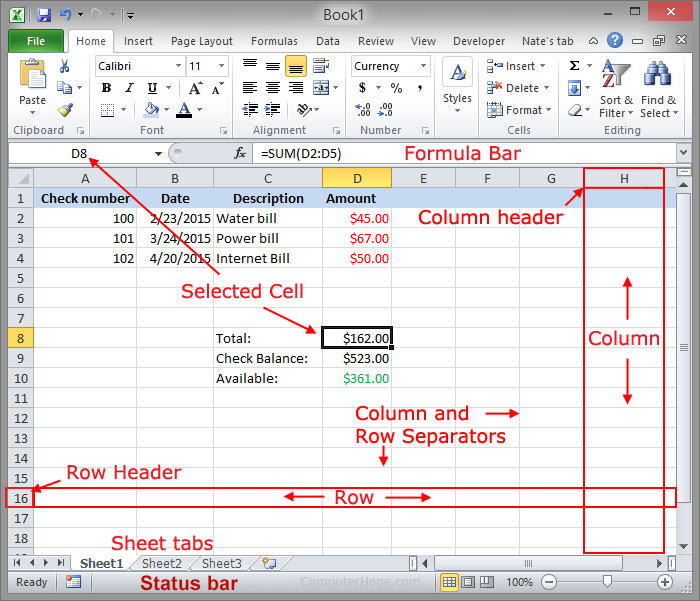
To understand the utility of Excel, one must first grasp its architectural components. The workspace is built upon a hierarchy that allows for complex data modeling and visualization.
Cells, Rows, and Columns
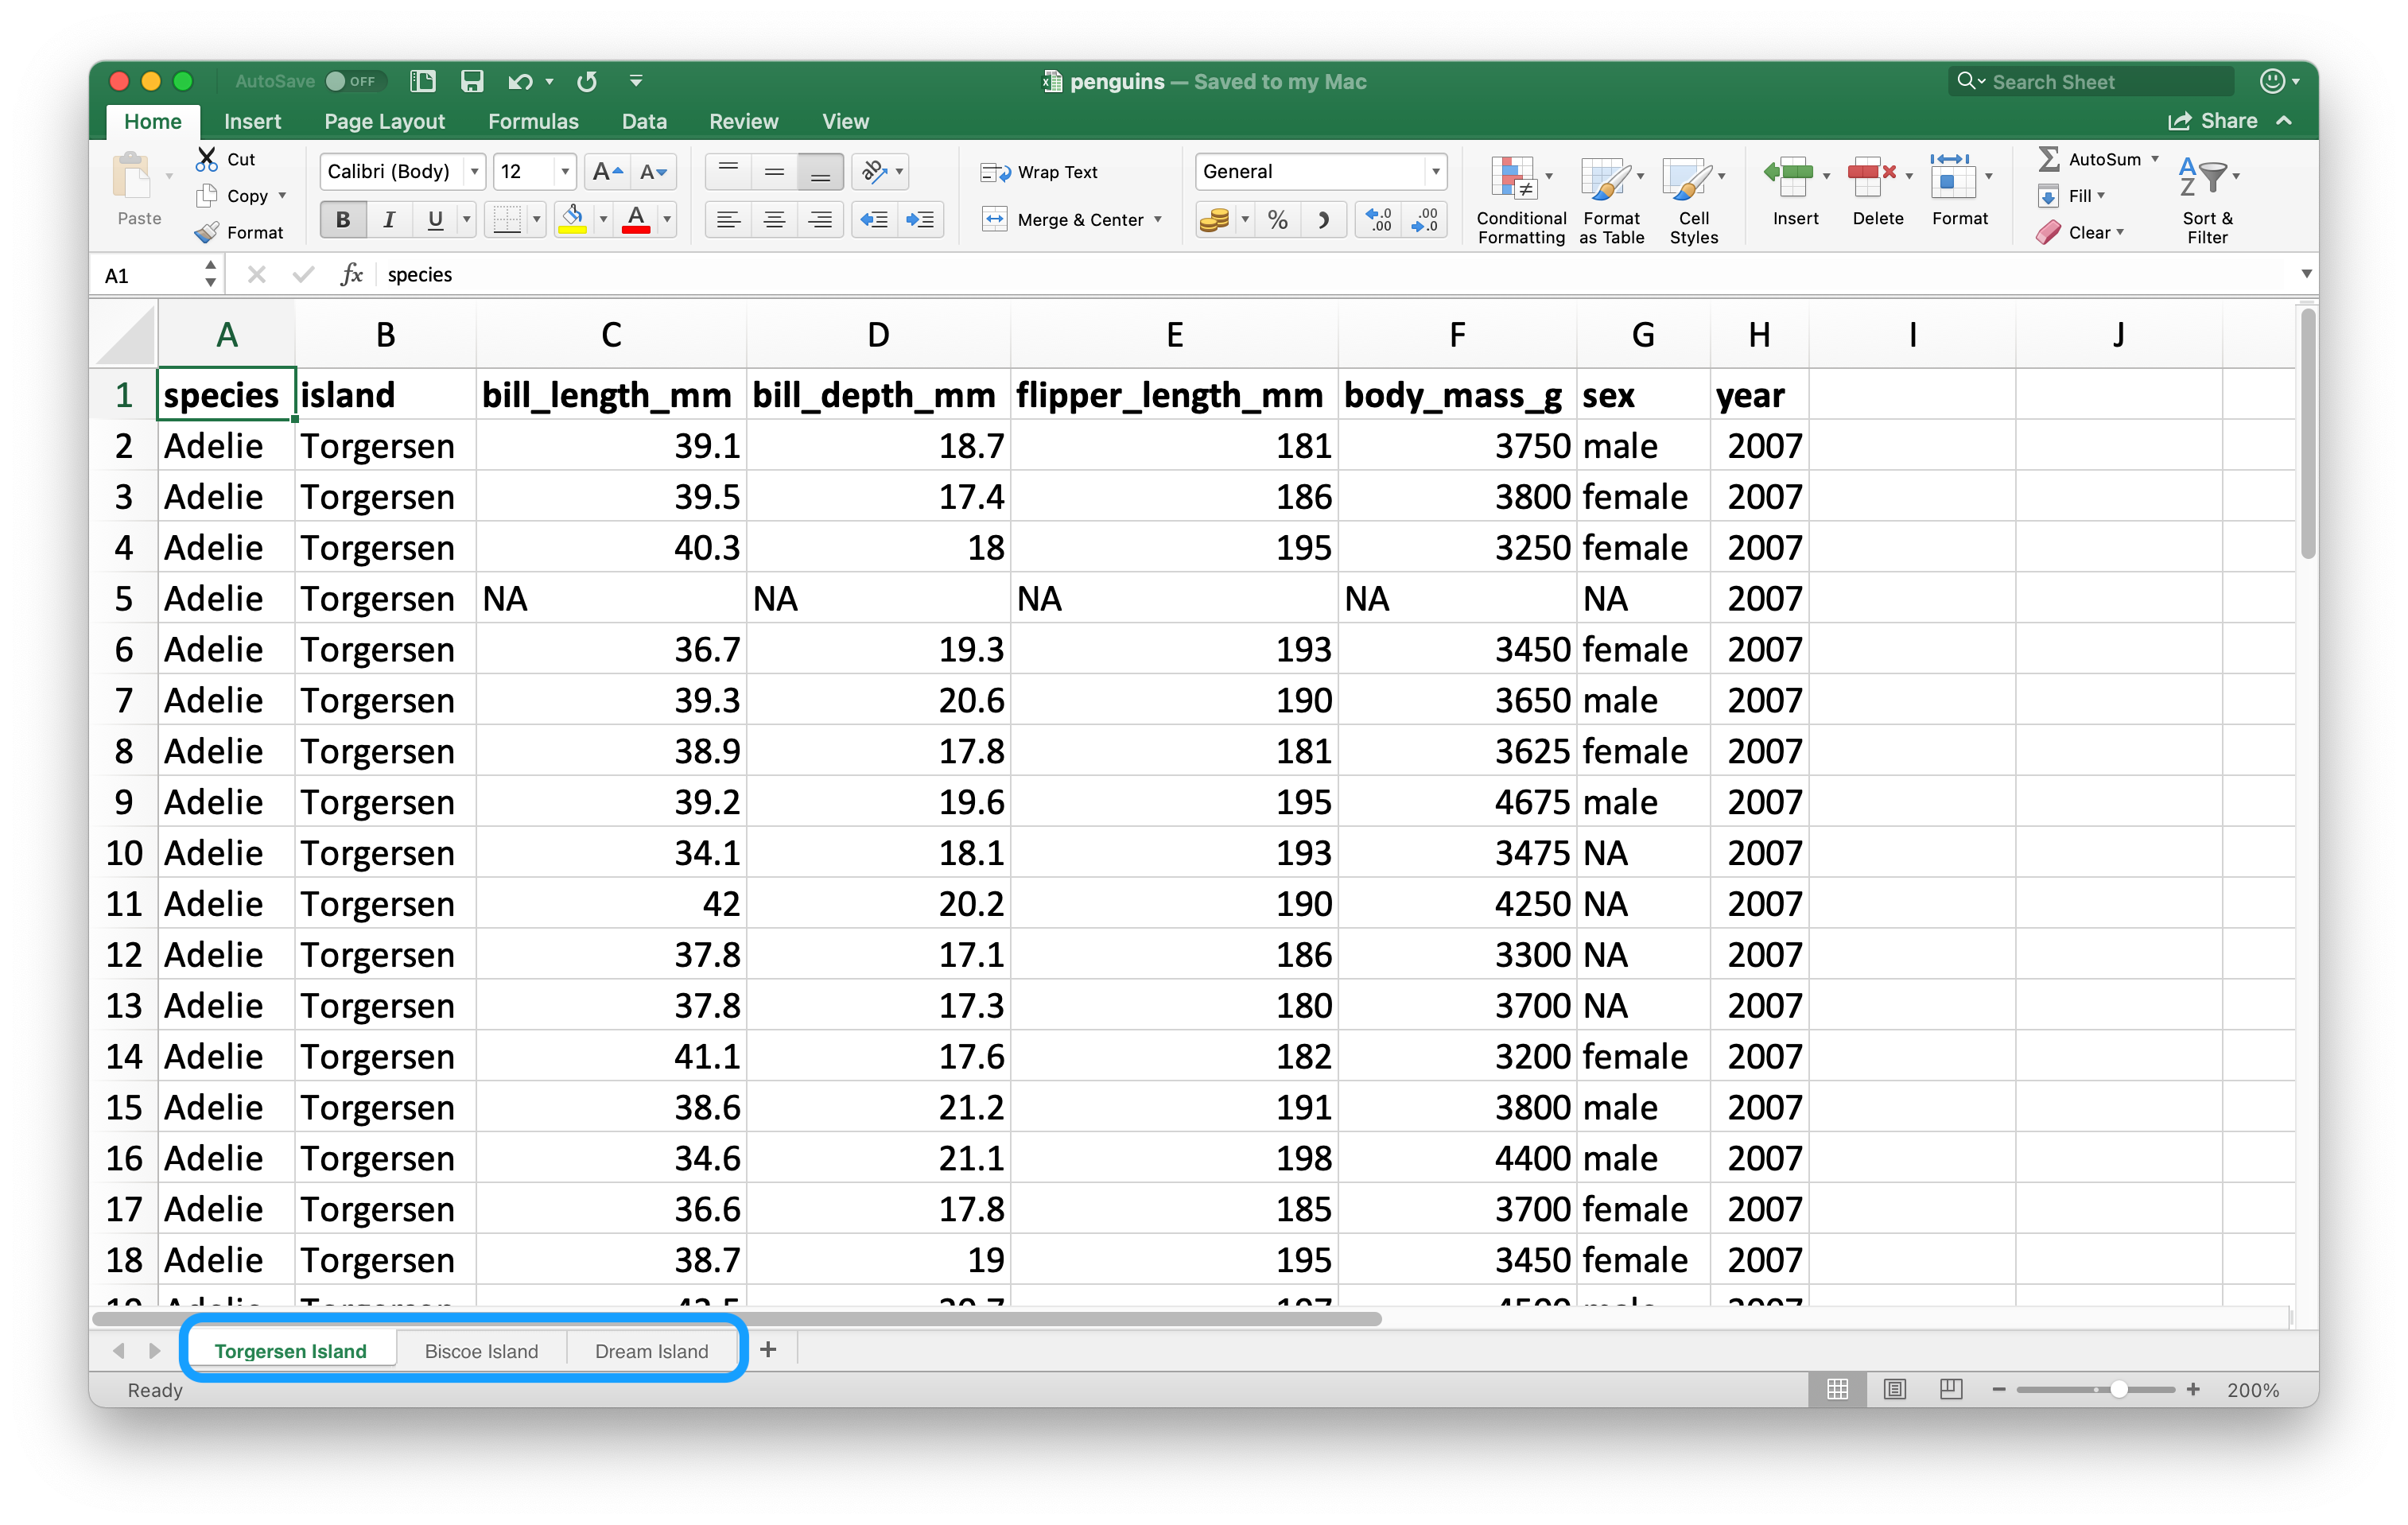
The foundation of any spreadsheet is the grid. Columns are identified by letters, and rows are identified by numbers. The intersection of these two is the “cell,” which acts as the basic container for information. A cell can hold static data—such as text, dates, or raw numbers—or it can host dynamic functions that calculate results based on other cells. This interactivity is what elevates Excel from a static table to a living document.
Worksheets and Workbooks
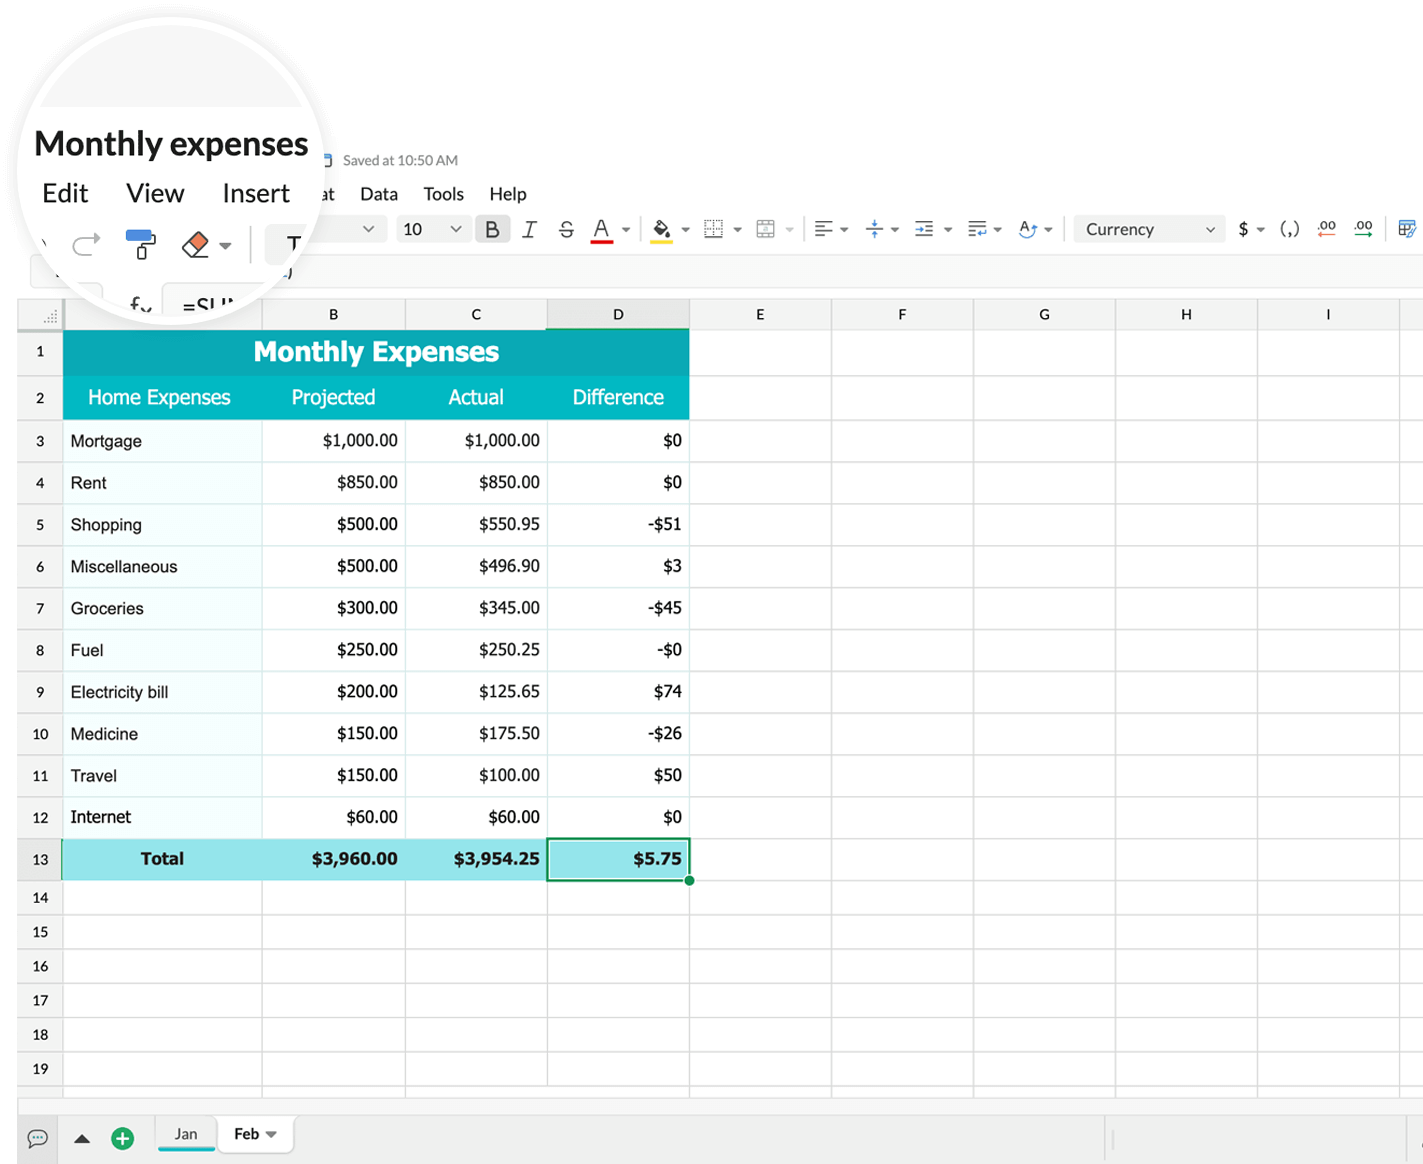
A single file in Excel is known as a “workbook.” Within this workbook, users can create multiple “worksheets” (tabs), allowing for the logical separation of data. For instance, a finance professional might keep monthly expense data on separate tabs within a single workbook, with a final “summary” tab that consolidates the findings. This modularity makes Excel an incredibly efficient tool for organizing vast datasets without becoming cluttered.
The Power of Formulas and Functions
The true value of Excel lies in its ability to automate calculations and perform complex logical operations. Rather than manually computing sums or averages, users leverage formulas to instruct the software to process data automatically.
Foundational Math and Logic
At the entry level, Excel functions allow for basic arithmetic: addition, subtraction, multiplication, and division. However, the software’s strength quickly scales to advanced logic. Functions like IF, AND, and OR allow users to set parameters where the spreadsheet makes decisions based on the data provided. For example, a sales report can automatically flag accounts as “High Priority” if a cell value exceeds a certain threshold, eliminating the need for manual review.
Data Lookup and Reference
For those working with massive datasets, tools like VLOOKUP, XLOOKUP, and INDEX/MATCH are essential. These functions allow users to scan through thousands of rows to find specific information and pull it into a new report. This capability is the backbone of database management within a spreadsheet environment, enabling users to bridge disparate datasets with ease.
Data Visualization and Business Intelligence
Numbers in isolation are often difficult to interpret. Excel provides a suite of visualization tools that transform raw data into actionable insights, turning complex figures into digestible narratives.
Charts and Graphs
Excel offers a robust library of visualization options, including bar charts, line graphs, scatter plots, and heat maps. These tools are not merely aesthetic; they are analytical instruments. By visualizing trends over time or identifying outliers in a dataset, users can spot inefficiencies or growth opportunities that would otherwise remain hidden in a wall of text.
PivotTables: The Ultimate Analytical Tool
Perhaps the most famous feature in Excel is the PivotTable. A PivotTable allows a user to “pivot” or rotate a massive dataset to view it from different perspectives without altering the underlying data. With a few clicks, a user can summarize thousands of rows into a concise summary table, calculating totals, averages, or percentages based on specific variables like region, product type, or time frame. It is the closest many professionals come to having a personal data analyst in their toolkit.
Excel in the Modern Tech Landscape
While new software tools and specialized AI platforms have emerged, Excel remains the primary interface for data processing across almost every industry. Its longevity is a testament to its flexibility and the universality of the spreadsheet model.
Integration and Automation
Modern Excel is not a siloed application; it is a hub. Through Power Query and Power Pivot, users can pull data from external cloud databases, websites, and enterprise resource planning (ERP) systems directly into their spreadsheets. Furthermore, the introduction of Office Scripts and the integration with Power Automate allow users to automate repetitive tasks—such as sending daily report emails or updating inventory logs—effectively turning Excel into a programmable workflow engine.
The Role of Excel in Data Science
For entry-level data science and business analytics, Excel serves as the proving ground. While programming languages like Python and R are used for larger-scale machine learning and statistical modeling, Excel is the tool of choice for data cleaning, initial exploration, and prototyping. A data scientist will often perform an “Exploratory Data Analysis” (EDA) in Excel to understand the distribution and quality of the data before passing it to more complex models. It remains the most effective bridge between raw data and decision-making for non-technical stakeholders.
Security and Collaboration
In a digital-first era, Excel has adapted to the cloud-based collaborative environment. By utilizing OneDrive and SharePoint, teams can edit the same workbook simultaneously, tracking changes in real-time. This has moved the spreadsheet from a static file shared via email to a dynamic collaboration platform. Security features, such as workbook protection, cell locking, and sensitivity labels, ensure that sensitive financial or personal data remains secure even as it is shared across global teams.
Conclusion: Mastering the Spreadsheet
An Excel spreadsheet is more than just a tool; it is a gateway to data literacy. Whether you are a student tracking personal finances, a small business owner managing inventory, or an analyst modeling global market trends, the skills learned in Excel are universally applicable.
The software’s beauty lies in its accessibility—it is easy to start, yet nearly impossible to outgrow. As the technology behind data processing continues to evolve, the fundamental principles of the spreadsheet—rows, columns, formulas, and logic—remain the bedrock upon which all analysis is built. By mastering Excel, you aren’t just learning a piece of software; you are learning how to organize chaos, extract value from noise, and make informed decisions in a digital world. As you continue your journey with Excel, prioritize learning the “why” behind your functions rather than just the “how.” Once you understand how to structure your data logically and automate your workflows, you will find that the possibilities for what you can build, analyze, and achieve are virtually limitless.
aViewFromTheCave is a participant in the Amazon Services LLC Associates Program, an affiliate advertising program designed to provide a means for sites to earn advertising fees by advertising and linking to Amazon.com. Amazon, the Amazon logo, AmazonSupply, and the AmazonSupply logo are trademarks of Amazon.com, Inc. or its affiliates. As an Amazon Associate we earn affiliate commissions from qualifying purchases.