
Understanding “how the stock market is doing today” requires looking far beyond a single green or red percentage on a smartphone app. For the modern investor, the daily movement of the markets is a complex tapestry woven from macroeconomic data, corporate earnings reports, and the collective psychology of millions of participants. To truly grasp the state of the market, one must look at the key indices, the underlying economic drivers, and the shifting sentiment that dictates where capital flows.
In this comprehensive analysis, we will break down the components of today’s financial landscape, providing the professional insight needed to navigate the noise and focus on what truly moves the needle for your portfolio.
1. Decoding the Major Indices: More Than Just Numbers
When people ask how the market is performing, they are usually referring to the “Big Three” U.S. indices. However, each of these serves a different purpose and represents a different segment of the economy. Understanding their nuances is essential for any disciplined investor.
The S&P 500: The Broader Market Barometer
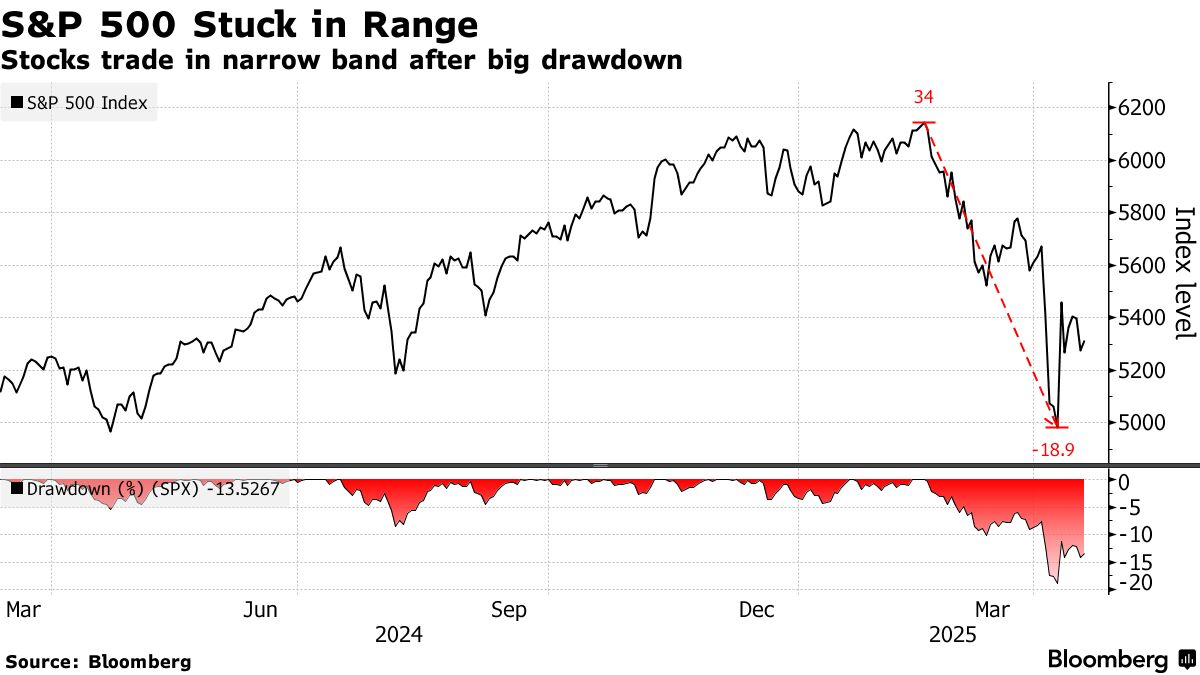
The Standard & Poor’s 500 is widely considered the most accurate reflection of the U.S. stock market. Comprising 500 of the largest publicly traded companies, it is a market-capitalization-weighted index. This means that giants like Apple, Microsoft, and Amazon have a disproportionate impact on its performance. When the S&P 500 is up, it generally indicates that large-cap American business is thriving. Today, investors watch this index to gauge overall economic health and the relative strength of the corporate sector.
The Dow Jones Industrial Average: Blue-Chip Stability
The Dow is a price-weighted index of 30 prominent companies. While it is less diverse than the S&P 500, it remains a vital indicator of “Blue Chip” stability. Because it is price-weighted, a stock with a higher share price influences the index more than one with a lower price, regardless of the company’s actual size. The Dow often reflects the sentiment of institutional investors looking for value and dividends rather than high-growth volatility.
The Nasdaq Composite: A Pulse on Innovation
The Nasdaq is heavily weighted toward the technology and consumer services sectors. It is the go-to indicator for growth-oriented investors. When the Nasdaq outperforms the other indices, it suggests a high appetite for risk and a belief in future technological disruption. Conversely, in high-interest-rate environments, the Nasdaq often leads the market downward as the “cost of future growth” becomes more expensive for tech firms.
2. Key Macroeconomic Drivers Influencing Today’s Price Action
The stock market does not exist in a vacuum. It is heavily influenced by external economic factors that dictate the cost of capital and the purchasing power of consumers. Today’s market movements are largely a reaction to three primary forces.
Interest Rates and the Federal Reserve’s Stance
Perhaps no single entity influences the stock market more than the Federal Reserve. By adjusting the federal funds rate, the Fed controls the “price of money.” When interest rates are low, borrowing is cheap, encouraging companies to expand and consumers to spend. When rates rise—usually to combat inflation—the market often reacts negatively. Higher rates increase the discount rate used to value future cash flows, which can lower the present value of stocks, particularly in the growth and tech sectors.
Inflation Data and Consumer Spending
Inflation, measured through the Consumer Price Index (CPI) and Personal Consumption Expenditures (PCE), remains a critical focal point. If inflation remains “sticky” or higher than expected, the market anticipates that the Fed will keep rates high for longer, causing downward pressure on stock prices. On the other hand, cooling inflation data often triggers market rallies as investors begin to price in potential rate cuts. Because consumer spending accounts for roughly 70% of the U.S. economy, any sign that the consumer is pulling back is a red flag for equity markets.
Geopolitical Events and Global Supply Chains
In a globalized economy, a conflict in Eastern Europe or trade tensions in East Asia can have an immediate impact on the New York Stock Exchange. These events influence the “risk-off” or “risk-on” sentiment of the market. Furthermore, disruptions in supply chains can lead to increased raw material costs, which squeeze corporate profit margins. Today’s savvy investor keeps one eye on the ticker and another on global headlines.
3. Sector Rotation: Where the Money is Flowing Right Now
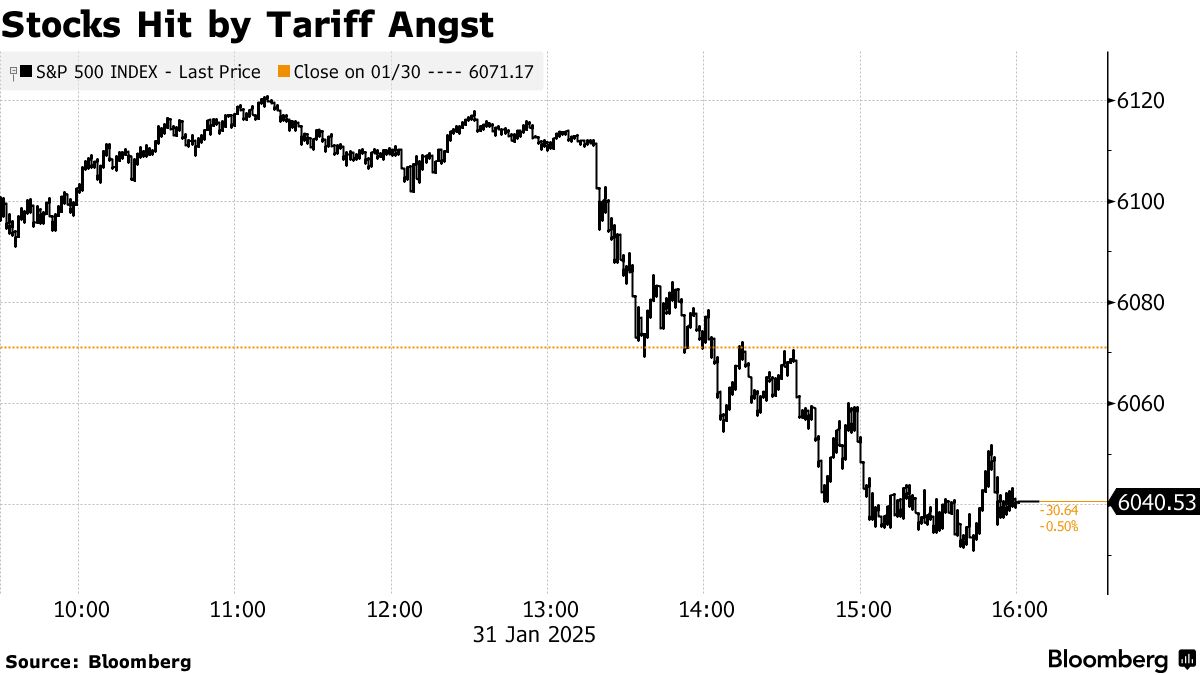
The market is rarely a monolith; while the overall index might be flat, there is often significant movement beneath the surface. This is known as sector rotation—the movement of investment capital from one industry to another based on the economic cycle.
Defensive vs. Cyclical Stocks
In times of economic uncertainty or high volatility, investors often flee to “Defensive” sectors. These include Healthcare, Utilities, and Consumer Staples—companies that provide essential services regardless of how the economy is performing. When the market is bullish and expansionary, capital flows into “Cyclical” sectors like Financials, Industrials, and Consumer Discretionary, which tend to profit most during periods of growth.
The Resurgence of Value Investing in a High-Rate Environment
For over a decade, “Growth” stocks (primarily tech) dominated the market due to near-zero interest rates. However, in today’s environment, “Value” stocks are seeing a resurgence. These are companies that are considered undervalued based on their fundamentals, such as earnings and book value. Investors are increasingly looking for companies with strong balance sheets, consistent cash flows, and reasonable valuations, rather than betting solely on “moonshot” growth prospects.
4. Psychological Factors and Market Sentiment
The stock market is driven by numbers, but it is executed by humans (and the algorithms humans create). Consequently, psychology plays a massive role in daily fluctuations.
The Fear and Greed Index
The “Fear and Greed Index” is a popular tool used to measure the emotions driving the market. When the index leans toward extreme greed, it may indicate that the market is overbought and a correction is looming. When it leans toward extreme fear, it often presents a buying opportunity for contrarian investors. Understanding that the market often overreacts to both good and bad news can help an investor remain calm when the “sea is choppy.”
Managing Emotional Bias During Market Fluctuations
One of the greatest risks to personal finance is emotional decision-making. “Loss aversion”—the tendency to feel the pain of a loss more acutely than the joy of a gain—often leads investors to sell at the bottom. Conversely, “FOMO” (Fear Of Missing Out) leads people to buy at the top. Professional investing requires a systematic approach that removes these biases, focusing on data and long-term objectives rather than daily headlines.
5. Actionable Strategies for the Modern Investor
Knowing “how the market is today” is only useful if you know what to do with that information. Whether the market is at an all-time high or in the midst of a correction, certain principles remains constant for building wealth.
Dollar-Cost Averaging: The Power of Consistency
Rather than trying to “time the market”—which even professional fund managers struggle to do—many successful investors utilize Dollar-Cost Averaging (DCA). By investing a fixed amount of money at regular intervals, you buy more shares when prices are low and fewer shares when prices are high. This strategy mitigates the risk of making a large investment at an inopportune time and takes the guesswork out of daily market movements.
Rebalancing Your Portfolio for Risk Mitigation
As different sectors and asset classes perform differently, your original portfolio allocation can shift. If tech stocks have a massive run, they may eventually represent a larger percentage of your portfolio than you intended, increasing your risk. Periodically “rebalancing”—selling some of the overperformers and buying the underperformers—ensures that you are constantly “selling high and buying low” while maintaining your desired risk profile.
The Importance of a Long-Term Perspective
The stock market has a 100% historical record of recovering from downturns and reaching new highs over long periods. While “today” might be filled with volatility, the trajectory of the market over decades is driven by innovation, productivity, and corporate earnings. For those focused on long-term financial independence, today’s market movement is merely a single data point in a much larger, and generally upward-trending, story.
In conclusion, the state of the stock market today is a reflection of a myriad of factors—from the Federal Reserve’s policy decisions to the emotional state of the global investing community. By understanding the indices, monitoring the macroeconomic drivers, and maintaining a disciplined, long-term strategy, you can move past the surface-level noise and make informed decisions that secure your financial future.
aViewFromTheCave is a participant in the Amazon Services LLC Associates Program, an affiliate advertising program designed to provide a means for sites to earn advertising fees by advertising and linking to Amazon.com. Amazon, the Amazon logo, AmazonSupply, and the AmazonSupply logo are trademarks of Amazon.com, Inc. or its affiliates. As an Amazon Associate we earn affiliate commissions from qualifying purchases.