In the intricate world of personal finance, investing, and business strategy, few concepts are as fundamental and universally applied as percentages. Far from being a mere academic exercise, understanding how to calculate, interpret, and apply percentages is an indispensable skill that empowers individuals and entrepreneurs to make informed decisions, manage wealth effectively, and navigate the complexities of economic life with confidence. From the daily discounts at your favorite store to the nuanced analysis of investment returns and profit margins, percentages are the silent language spoken by money. This guide aims to demystify percentages, transforming a potentially intimidating mathematical concept into a powerful financial tool. By mastering this core skill, you unlock a deeper understanding of your financial landscape, enabling smarter choices and fostering greater financial well-being.

The Ubiquity of Percentages in Your Financial Life
Percentages permeate almost every facet of our financial existence, often without us consciously realizing their profound impact. They are the shorthand for conveying proportions, changes, and relationships, making complex financial data digestible and comparable. Recognizing their widespread presence is the first step toward harnessing their power.
Everyday Applications: From Discounts to Tips
Consider a typical day: you might see a “20% off” sign at a retailer, instantly needing to calculate the new price. When dining out, a 15% tip is a common expectation. Your mobile phone bill might detail “data usage at 80% capacity,” or your bank might offer a “1.5% cashback” on certain purchases. Even everyday conversations about the economy often reference unemployment rates, inflation figures, or interest rate hikes – all expressed in percentages. These aren’t just arbitrary numbers; they directly influence your spending power, budgeting, and overall financial health. Understanding how these percentages are derived and what they represent allows you to quickly assess value, plan expenditures, and avoid financial missteps.
Understanding Financial News and Reports
Beyond daily transactions, percentages form the backbone of financial reporting and economic news. When the stock market “rises by 1.2%,” or a company reports a “25% increase in quarterly profits,” these figures provide critical insights into performance and trends. Investment portfolios are often described by the percentage allocation to different asset classes (e.g., “60% stocks, 40% bonds”), and economic indicators like GDP growth, national debt, or consumer price index (CPI) are invariably presented as percentages. Without a solid grasp of how these numbers are calculated and what they signify, the financial news can seem like an indecipherable language, leaving you uninformed about significant shifts that could impact your investments, job security, or purchasing power.
The Power of Compound Interest and Growth
Perhaps one of the most significant financial applications of percentages lies in understanding compound interest – often dubbed the “eighth wonder of the world.” Whether it’s the interest earned on your savings, the growth of your investments, or the accumulating cost of debt, compound interest operates entirely on percentages applied over time. A seemingly small “annual interest rate of 5%” can lead to substantial wealth accumulation over decades, illustrating the exponential power of compounding. Conversely, a high “APR (Annual Percentage Rate) of 20%” on a credit card can quickly spiral into overwhelming debt. Grasping how percentages drive this growth (or decay) is essential for long-term financial planning, saving for retirement, and managing debt strategically. It helps you project future values and understand the true cost of borrowing versus the real benefit of saving.
Deconstructing the Percentage: The Core Calculations
At its heart, a percentage is simply a fraction out of 100. The word “percent” literally means “per hundred.” Mastering the core calculations is fundamental to applying this concept effectively across all financial scenarios.
Calculating a Percentage of a Number
This is perhaps the most common percentage calculation you’ll encounter. To find a percentage of a number, you convert the percentage to a decimal (by dividing by 100) and then multiply it by the number.
Formula: Percentage / 100 * Whole Number
Example: You want to find 20% of $150.
- Convert 20% to a decimal: 20 / 100 = 0.20
- Multiply by the whole number: 0.20 * $150 = $30
- Application: This is how you calculate a discount amount. A $150 item with a 20% discount means you save $30.
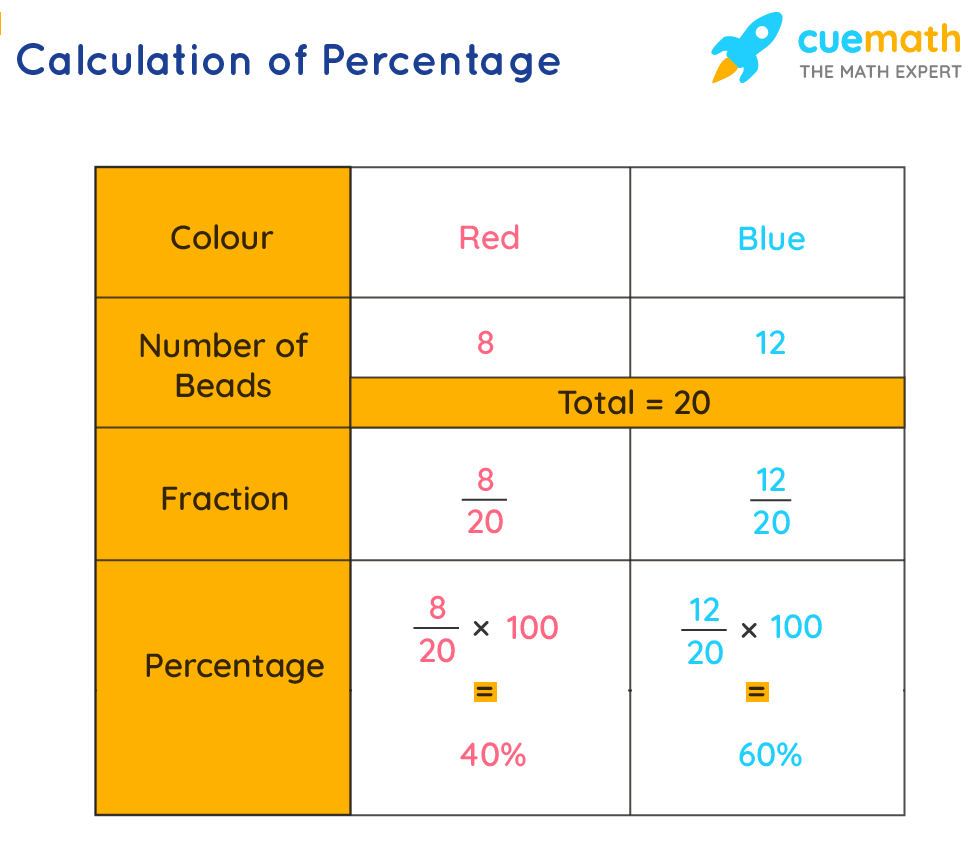
Finding What Percentage One Number Is of Another
This calculation helps you understand the proportion one value holds relative to a total. It’s crucial for understanding ratios, margins, and contributions.
Formula: (Part / Whole) * 100
Example: You spent $50 on groceries out of a total monthly budget of $500. What percentage of your budget went to groceries?
- Divide the part by the whole: $50 / $500 = 0.10
- Multiply by 100 to get the percentage: 0.10 * 100 = 10%
- Application: This helps calculate profit margins (profit as a percentage of revenue), expense ratios, or the contribution of one product line to total sales.
Percentage Increase and Decrease
Understanding how values change over time is vital for tracking growth, depreciation, and inflation.
Formula for Increase: ((New Value - Original Value) / Original Value) * 100
Formula for Decrease: ((Original Value - New Value) / Original Value) * 100
Example (Increase): Your investment grew from $1,000 to $1,200.
- ($1,200 – $1,000) / $1,000 = $200 / $1,000 = 0.20
- 0.20 * 100 = 20% increase
Example (Decrease): A car’s value dropped from $20,000 to $18,000. - ($20,000 – $18,000) / $20,000 = $2,000 / $20,000 = 0.10
- 0.10 * 100 = 10% decrease
- Application: This is used to calculate investment returns (ROI), assess property value changes, or understand inflation rates.
Reverse Percentage: Finding the Original Amount
Sometimes you know the final amount after a percentage change and need to work backward to find the original value.
Formula (After Increase): Final Value / (1 + (Percentage Increase / 100))
Formula (After Decrease): Final Value / (1 - (Percentage Decrease / 100))
Example (After Decrease): You bought an item for $80 after a 20% discount. What was the original price?
- $80 / (1 – (20 / 100)) = $80 / (1 – 0.20) = $80 / 0.80 = $100
- Application: This is useful for finding the original price before a discount, calculating the pre-tax income from a net salary, or determining a product’s base cost before markup.
Percentages in Personal Finance and Budgeting
Effective personal finance management is heavily reliant on understanding and applying percentages. They provide a clear framework for allocating resources, tracking progress, and identifying areas for improvement.
The 50/30/20 Rule: A Budgeting Framework
A popular and effective budgeting strategy, the 50/30/20 rule, is built entirely on percentages. It suggests allocating:
- 50% of your after-tax income to Needs: Housing, utilities, groceries, transportation, insurance.
- 30% to Wants: Dining out, entertainment, hobbies, vacations, new gadgets.
- 20% to Savings & Debt Repayment: Emergency fund, retirement contributions, investments, paying down high-interest debt beyond minimums.
This framework provides a clear, percentage-based guideline for managing income, helping you prioritize spending and ensure long-term financial stability.
Tracking Spending and Identifying Overspending Areas
Budgeting tools, whether spreadsheets or apps, often present your spending as percentages of your total income or monthly budget. Seeing that “35% of your income goes to dining out” rather than just a dollar amount, can be a stark and actionable revelation. Percentages highlight disproportionate spending, allowing you to pinpoint categories where you might be overspending relative to your financial goals or average benchmarks. This granular view empowers you to make targeted adjustments, reallocate funds, and bring your spending habits in line with your financial objectives.

Saving Goals and Progress Monitoring
Setting savings goals, whether for a down payment on a house, a new car, or an emergency fund, becomes much more manageable when broken down into percentages. Instead of just aiming for a lump sum, you can target saving “10% of every paycheck” or determine “what percentage of the cost have I saved so far?” Tracking your progress in percentages offers a motivational and clear indicator of how close you are to achieving your targets, allowing for adjustments if you’re falling behind or celebrating milestones when you reach them.
Understanding Loan Interest Rates and Credit Card APRs
Every loan you take out, from a mortgage to a student loan or a credit card, comes with an interest rate expressed as a percentage. Understanding the difference between a 3% mortgage rate and a 19% credit card APR is critical. These percentages dictate the true cost of borrowing, determining how much extra you’ll pay over the life of the loan. Knowing how to calculate the interest paid on different balances and understanding the impact of compounding interest on debt empowers you to prioritize high-interest debt repayment, potentially saving thousands over time.
Leveraging Percentages for Investment and Business Growth
For investors and business owners, percentages move beyond mere arithmetic to become powerful analytical tools, offering insights into performance, risk, and opportunity.
Analyzing Investment Returns (ROI)
Return on Investment (ROI) is universally expressed as a percentage and is arguably the most critical metric for evaluating the performance of any investment. Whether it’s stocks, bonds, real estate, or a startup venture, calculating the percentage gain or loss allows you to compare different investments on an equal footing, regardless of their initial cost. A 10% return on a $1,000 investment ($100 profit) is proportionally equivalent to a 10% return on a $100,000 investment ($10,000 profit). This standardized metric is essential for making informed decisions about where to allocate capital for maximum growth.
Understanding Portfolio Allocation and Diversification
Diversification is key to managing risk in an investment portfolio, and it’s almost always discussed in terms of percentages. A common strategy might be to allocate “60% to equities, 30% to fixed income, and 10% to alternative investments.” These percentages help investors ensure their assets are spread across different categories, reducing the impact of poor performance in any single area. Regularly reviewing your portfolio’s percentage allocation allows you to rebalance when necessary, ensuring your risk profile remains aligned with your long-term financial goals.
Business Profitability Metrics: Margins and Markups
For businesses, percentages are the language of profitability. Gross profit margin (Gross Profit / Revenue * 100) and Net profit margin (Net Income / Revenue * 100) are vital indicators of a company’s efficiency and financial health. A high gross margin might indicate efficient production, while a healthy net margin shows good control over all expenses. Similarly, markups (the percentage added to the cost to determine the selling price) are fundamental to pricing strategy. Understanding and manipulating these percentage-based metrics allows business owners to optimize pricing, control costs, and ultimately drive sustainable growth.
Evaluating Sales Growth and Market Share
Businesses continuously track sales growth as a percentage year-over-year or quarter-over-quarter to assess performance and identify trends. A “15% increase in sales” is a clear indicator of success. Moreover, market share – the percentage of total sales in an industry that a company captures – is a critical competitive metric. A company striving to increase its market share by “2 percentage points” has a clear, quantifiable goal derived directly from percentage understanding. These metrics are crucial for strategic planning, setting targets, and evaluating competitive positioning.
Advanced Applications and Avoiding Common Pitfalls
While the basics are essential, understanding nuances and common mistakes can elevate your percentage mastery even further.
The Difference Between Percentage Points and Percentage Change
This is a subtle but critical distinction, often confused in financial reporting. A “percentage change” refers to the proportional change relative to the original value (e.g., a stock increasing by 10%). A “percentage point” refers to the absolute difference between two percentages. For instance, if an interest rate increases from 4% to 5%, that’s a 1 percentage point increase, not a 25% increase (which would be (5-4)/4 * 100). Misinterpreting this can lead to vastly different conclusions about the magnitude of a financial event.
Cumulative Percentages and Sequential Changes
When dealing with multiple percentage changes, it’s crucial not to simply add or subtract them. For example, if an investment first drops by 10% and then increases by 10%, it does not return to its original value.
- Start with $100.
- 10% drop: $100 – ($100 * 0.10) = $90.
- 10% increase: $90 + ($90 * 0.10) = $99.
The final value is $99, not $100. Understanding how sequential percentage changes compound is vital for accurate financial forecasting and analyzing multi-period investment performance.
The Impact of Inflation and Real Returns
Inflation, expressed as a percentage increase in the general price level of goods and services, erodes purchasing power over time. While your investment might show a 7% nominal return, if inflation was 3%, your “real return” – what you can actually buy with your money – is only 4% (approximately, more precisely (1+Nominal)/(1+Inflation)-1). Recognizing the impact of inflation percentages on your true wealth is crucial for setting realistic financial goals and evaluating long-term investment strategies.
Using Financial Tools and Calculators Effectively
While manual calculation is essential for understanding, modern financial tools and calculators are indispensable for efficiency and accuracy, especially with complex scenarios like compound interest over many periods. From basic online percentage calculators to sophisticated spreadsheet functions (like RATE, NPER, FV, PV in Excel for financial planning) or financial planning software, these tools can automate calculations, allowing you to focus on interpreting the results and making strategic decisions. However, knowing the underlying percentage principles ensures you input the correct values and critically evaluate the output.
Conclusion
Percentages are more than just numbers on a page; they are the bedrock of financial literacy and a powerful lens through which to view and interact with your money. From managing your daily budget and understanding the true cost of debt to analyzing investment performance and navigating economic trends, mastering percentages empowers you with the clarity and confidence needed to make astute financial decisions. By diligently applying these calculations and understanding their implications, you not only unlock a deeper understanding of your financial world but also equip yourself with the essential tools to build, protect, and grow your wealth. Embrace the power of percentages, and take control of your financial destiny.
aViewFromTheCave is a participant in the Amazon Services LLC Associates Program, an affiliate advertising program designed to provide a means for sites to earn advertising fees by advertising and linking to Amazon.com. Amazon, the Amazon logo, AmazonSupply, and the AmazonSupply logo are trademarks of Amazon.com, Inc. or its affiliates. As an Amazon Associate we earn affiliate commissions from qualifying purchases.