
To the uninitiated, the stock market often appears as a chaotic blur of flashing green and red numbers, complex jargon, and volatile charts. However, for the successful investor, the market is a narrative—a continuous flow of data that tells a story about human psychology, corporate health, and global economic shifts. Learning how to read the stock market is not about predicting the future with a crystal ball; it is about interpreting the signals provided by price action, financial statements, and macroeconomic indicators to make informed, calculated decisions.
To master this skill, one must move beyond the surface-level fluctuations and understand the structural components that drive market movements. Whether you are looking to build a retirement fund or generate a secondary income stream, the ability to decode market data is the most critical asset in your financial toolkit.
Understanding the Language of the Market: Beyond the Ticker Symbol
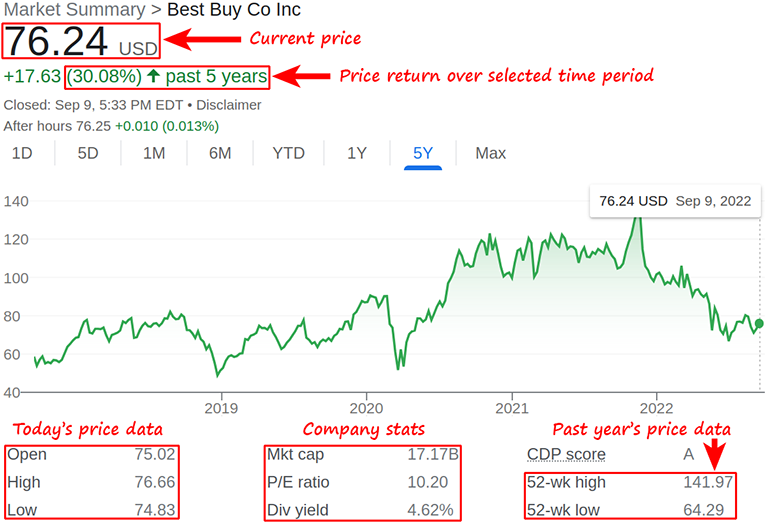
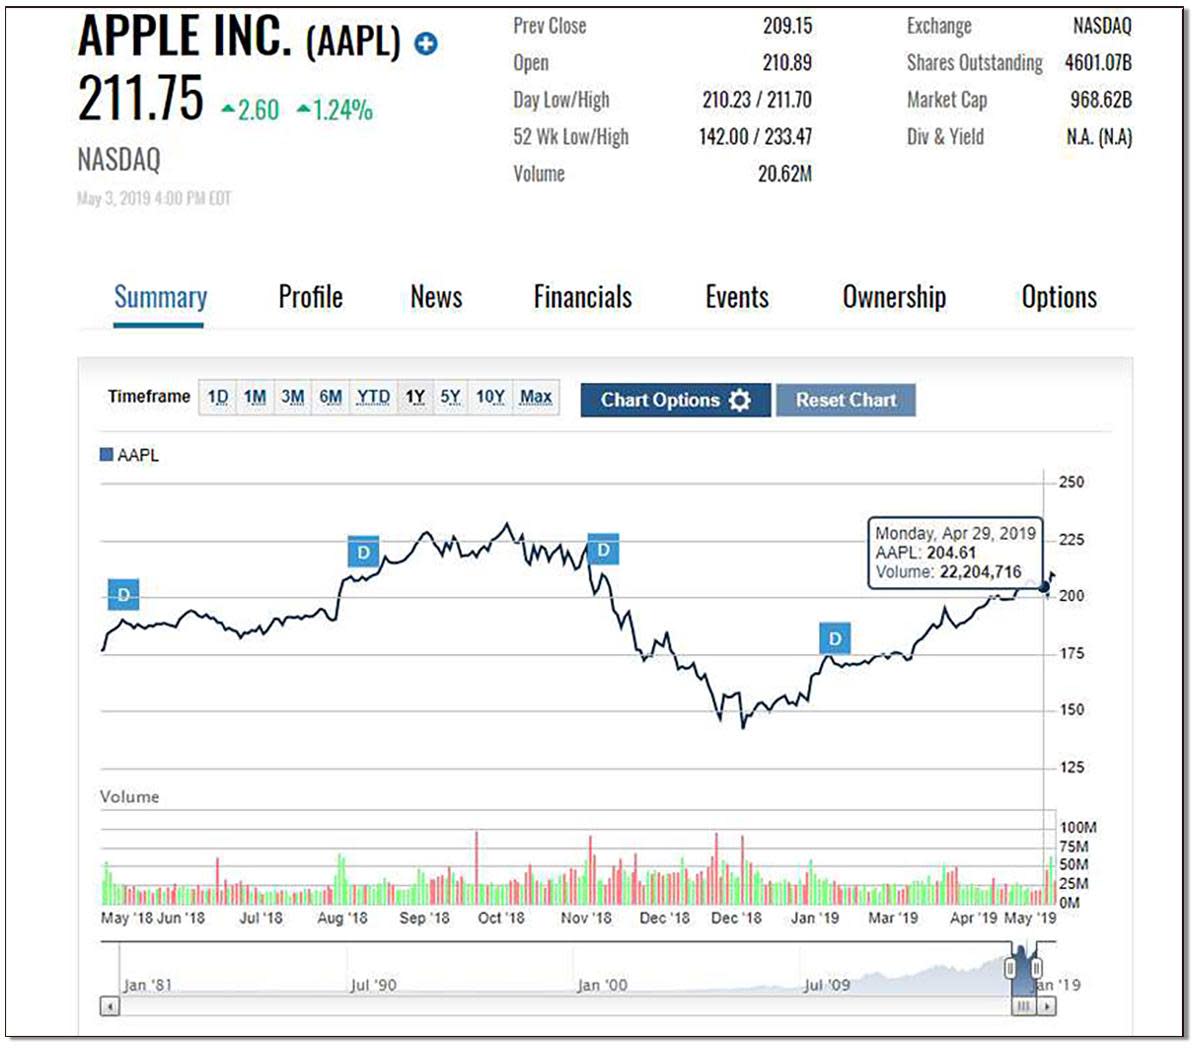
The first step in reading the stock market is understanding the basic data points provided in a standard market quote. Every stock is identified by a ticker symbol, but the real information lies in the metrics surrounding that symbol.
Decoding Price Quotes and Volume
A stock quote provides a snapshot of a company’s current valuation. The “Bid” price represents the maximum price a buyer is willing to pay, while the “Ask” price is the minimum price a seller is willing to accept. The difference between the two, known as the “spread,” often indicates the liquidity of the stock; a narrow spread suggests a highly liquid market where assets can be bought and sold easily.
Equally important is “Volume,” which refers to the number of shares traded during a specific period. Volume acts as a confirmation tool. If a stock price rises on high volume, it indicates strong conviction among investors. Conversely, a price increase on low volume may be fragile, suggesting a lack of institutional support. Reading volume allows an investor to distinguish between a significant trend change and mere market “noise.”
The Role of Market Indices
Individual stocks do not move in a vacuum. To read the market effectively, you must understand the major indices: the S&P 500, the Dow Jones Industrial Average (DJIA), and the Nasdaq Composite. The S&P 500 is often considered the most accurate gauge of the overall U.S. economy because it tracks 500 of the largest publicly traded companies.
When you read that “the market is up,” it usually refers to these indices. Understanding the weightings of these indices is crucial. For instance, the Nasdaq is tech-heavy, meaning it will react more sharply to news regarding interest rates or silicon valley innovation. By comparing an individual stock’s performance against its relevant index—a concept known as “relative strength”—you can determine if a company is an industry leader or a laggard.
Fundamental Analysis: Evaluating the Health of a Company
If the ticker tape is the market’s pulse, fundamental analysis is its physical examination. This approach involves looking at the underlying business to determine its intrinsic value. Reading the market fundamentally means looking past the daily price swings to see if a company is actually profitable and sustainable.
Earnings Reports and the P/E Ratio
The most significant event for any individual stock is the quarterly earnings report. These reports provide a detailed look at revenue, net income, and earnings per share (EPS). When reading an earnings report, professional investors look for “beats” or “misses” relative to analyst expectations. However, the most critical part is often the “guidance”—the company’s own forecast of its future performance.
A primary tool used to contextualize these earnings is the Price-to-Earnings (P/E) ratio. This metric compares the stock price to its annual earnings per share. A high P/E might suggest that a stock is overvalued, or it could mean that investors expect high growth in the future. Learning to read the P/E ratio in the context of a company’s historical average and its industry peers is vital for identifying “value” plays versus “growth” plays.
Balance Sheets and Cash Flow
A company can show a profit on paper while still being in financial distress. To truly read a company’s health, one must examine the balance sheet and the statement of cash flows. The balance sheet reveals the company’s assets versus its liabilities. A high debt-to-equity ratio can be a red flag, especially in a rising interest rate environment where the cost of servicing that debt increases.
Free Cash Flow (FCF) is perhaps the most “honest” metric in finance. It represents the cash a company generates after accounting for cash outflows to support operations and maintain its capital assets. Companies with strong, growing free cash flow have the flexibility to pay dividends, buy back shares, or reinvest in new technology, all of which are positive signals for long-term investors.

Technical Analysis: Recognizing Patterns and Trends
While fundamental analysis tells you what to buy, technical analysis helps you understand when to buy. Technical analysis is the study of historical price action and volume to identify patterns that suggest future price movements. It is based on the premise that all known information is already “priced in” and that human behavior tends to repeat itself in predictable ways.
Moving Averages and Support Levels
One of the simplest ways to read a stock chart is through moving averages. A moving average smooths out price data by creating a constantly updated average price. The 50-day and 200-day moving averages are the most commonly watched. When a stock’s price is above its 200-day moving average, it is generally considered to be in a long-term uptrend.
Support and resistance are the “floor” and “ceiling” of a stock’s price. Support is the price level where a downtrend tends to pause due to a concentration of buying demand. Resistance is the level where an uptrend pauses due to selling pressure. Identifying these levels allows an investor to set entry and exit points with precision, minimizing the emotional stress of market volatility.
Reading Candlestick Charts
Modern investors rarely use simple line charts; they use candlestick charts. Each “candle” provides four pieces of information: the open, close, high, and low prices for a specific timeframe. The shape of the candle—whether it has a long “wick” or a thick “body”—tells a story about the battle between buyers and sellers. For example, a “Doji” candle, where the open and close are almost identical, signals indecision in the market and often precedes a reversal in the current trend.
Sentimental and Macroeconomic Indicators
The stock market is often described as a “discounting mechanism” for the future. This means it reacts today based on what investors think will happen six to nine months from now. To read the market accurately, you must look at the broader economic environment.
Interest Rates and Inflation
The Federal Reserve is perhaps the most influential entity in the financial markets. When the Fed raises interest rates to combat inflation, borrowing becomes more expensive for companies and consumers. This typically leads to lower corporate profits and a decrease in stock prices. Conversely, lower interest rates act as “fuel” for the market.
Reading the market requires a constant eye on the “Yield Curve.” Usually, long-term bonds have higher interest rates than short-term bonds. When this relationship flips—known as an inverted yield curve—it has historically been a reliable predictor of an upcoming recession. Monitoring these macroeconomic shifts allows investors to rotate their portfolios into defensive sectors (like utilities or healthcare) before a downturn occurs.
Market Sentiment and the Fear & Greed Index
Investor psychology often swings between two extremes: fear and greed. During periods of extreme greed, stock prices may become detached from their fundamental values (a bubble). During periods of extreme fear, high-quality companies may be sold off indiscriminately (an opportunity).
Tools like the CBOE Volatility Index (VIX), often called the “Fear Gauge,” measure the market’s expectation of 30-day volatility. A high VIX indicates that investors are nervous and buying insurance against a market drop. Reading sentiment indicators helps an investor maintain a contrarian perspective: being cautious when others are exuberant and being opportunistic when others are panicked.
Building a Systematic Reading Habit
Mastering the stock market is not a one-time achievement but a daily practice. The sheer volume of information can be overwhelming, making it essential to develop a systematic approach to filtering the noise.
Filtering the Noise
In the digital age, financial news is 24/7. Not every headline is actionable. A “breaking news” alert about a minor geopolitical event might cause a temporary dip, but if it doesn’t affect a company’s long-term earnings potential, it is merely noise. Successful investors focus on “signals”—data points that have a direct impact on valuation—rather than “narratives” designed to generate clicks and views.
Developing a Long-Term Perspective
The final, and perhaps most difficult, part of reading the stock market is maintaining a long-term perspective. If you look at the market on a minute-by-minute basis, it looks like a random walk. If you look at it over a decade, it reflects the growth of human innovation and productivity.
To read the market effectively, you must define your “investment horizon.” A day trader and a retirement saver will read the same chart in completely different ways. By aligning your interpretation of the data with your personal financial goals, you can navigate the complexities of the stock market with confidence and discipline. Reading the market is a journey from confusion to clarity, transforming a wall of numbers into a clear roadmap for financial independence.
aViewFromTheCave is a participant in the Amazon Services LLC Associates Program, an affiliate advertising program designed to provide a means for sites to earn advertising fees by advertising and linking to Amazon.com. Amazon, the Amazon logo, AmazonSupply, and the AmazonSupply logo are trademarks of Amazon.com, Inc. or its affiliates. As an Amazon Associate we earn affiliate commissions from qualifying purchases.