
In an increasingly data-driven world, the ability to effectively communicate complex information is paramount. Raw numbers, while precise, often fail to convey the underlying patterns, trends, and insights that drive understanding and decision-making. This is where graphs come into play. A graph transforms abstract data into a powerful visual narrative, making it accessible, digestible, and far more impactful. Whether you’re a student trying to illustrate experimental results, a business professional analyzing market trends, or a researcher presenting findings, mastering the art of plotting on a graph is an indispensable skill in the modern technological landscape.
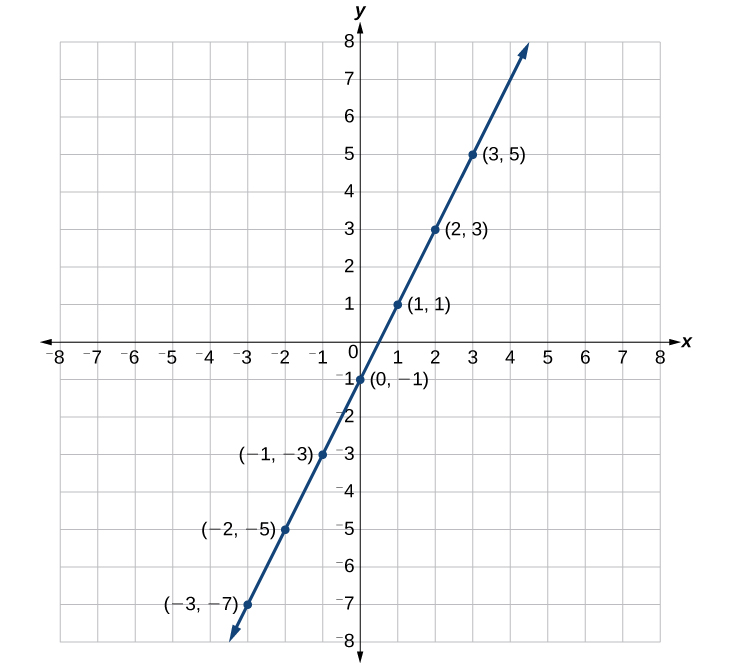
This comprehensive guide will demystify the process of data visualization, taking you from the foundational principles of graphing to the practical application of both manual and digital tools. We will explore the various types of graphs, their specific uses, and best practices to ensure your visualizations are not only accurate but also compelling and clear. By the end of this article, you will possess a robust understanding of how to plot on a graph effectively, transforming your raw data into actionable insights and engaging stories.
Understanding the Fundamentals of Graphing
Before diving into the mechanics of plotting, it’s crucial to grasp the foundational concepts that underpin all forms of data visualization. A well-constructed graph is more than just a collection of lines and points; it’s a carefully designed communication tool.
What is a Graph and Why Do We Use Them?
At its core, a graph is a diagram that represents the relationship between different variables, typically two, shown along two axes at right angles. It’s a visual representation of data that allows for quicker interpretation of large datasets and the identification of trends, comparisons, and relationships that might be obscured in tabular data.
We use graphs for several critical reasons:
-
Clarity and Simplicity: They simplify complex data, making it easier for the human brain to process and understand patterns.
-
Identification of Trends: Graphs make it easy to spot trends, anomalies, and correlations over time or across different categories.
-
Comparison: They facilitate straightforward comparisons between different data points or groups.
-
Storytelling: A good graph can tell a compelling story, highlighting key insights and supporting arguments more effectively than text or tables alone.
-
Decision Making: By revealing underlying patterns, graphs empower better-informed decisions in business, science, and everyday life.
Key Components of a Graph
Every effective graph, regardless of its type, shares several fundamental components that ensure its readability and accuracy:
-
Title: A concise, descriptive title that clearly states what the graph represents. It should be informative enough for a viewer to understand the graph’s purpose without needing further explanation.
-
Axes: Most common graphs have two axes:
-
X-axis (Horizontal Axis): Typically represents the independent variable, or the input. This might be time, categories, experimental conditions, or age.
-
Y-axis (Vertical Axis): Typically represents the dependent variable, or the output. This shows what is being measured or observed in relation to the X-axis, such as sales, temperature, frequency, or height.
-
-
Axis Labels: Clear labels for both the X and Y axes, including units of measurement where applicable. These are crucial for understanding what each axis represents.
-
Scale: The range of values displayed on each axis, along with the intervals between the tick marks. The scale should be appropriate for the data, ensuring all data points are visible and the graph isn’t too cramped or too sparse.
-
Data Points/Series: The actual values plotted on the graph. These can be individual points, lines connecting points, bars, or segments of a pie. If there are multiple series of data, they should be distinct (e.g., different colors or symbols).
-
Legend/Key: If the graph contains multiple data series, a legend explains what each color, line style, or symbol represents.
-
Gridlines (Optional but Recommended): Horizontal and vertical lines extending from the tick marks on the axes. They aid in precisely reading the values of data points.
Types of Graphs and Their Applications
Choosing the right type of graph is critical for effective communication. Different graph types are suited for different kinds of data and different messages.
-
Line Graphs: Ideal for showing trends over time or continuous data. They connect individual data points with a line, making it easy to see changes and relationships. (e.g., stock prices over a year, temperature fluctuations).
-
Bar Graphs: Excellent for comparing discrete categories or showing changes over time when the number of data points is small. Bars can be vertical or horizontal. (e.g., sales figures for different products, population by country).
-
Scatter Plots: Used to display the relationship between two numerical variables. Each point represents a pair of values, revealing correlations or clusters. (e.g., height vs. weight, advertising spend vs. sales).
-
Pie Charts: Best for showing parts of a whole, where each slice represents a proportion or percentage of the total. They are less effective for many categories or precise comparisons. (e.g., market share of different companies, breakdown of a budget).
-
Histograms: Similar to bar graphs but specifically used for showing the distribution of a single continuous variable. The bars represent ranges of values (bins), and their height indicates frequency. (e.g., distribution of exam scores, age demographics).
-
Area Graphs: Similar to line graphs but the area between the line and the x-axis is filled, emphasizing magnitude over time. Can be stacked to show cumulative totals. (e.g., total sales broken down by product category over time).
Manual Plotting: The Traditional Approach
While digital tools have revolutionized data visualization, understanding the principles of manual plotting remains valuable. It builds a fundamental intuition for how graphs are constructed and the importance of precision.
Preparing Your Data for Manual Plotting
Before you put pen to paper, your data needs to be organized and ready.
-
Collect and Organize Data: Ensure your data is in a clear, tabular format (e.g., a table with columns for your independent and dependent variables).
-
Identify Variables: Clearly define which variable will be on the X-axis (independent) and which on the Y-axis (dependent).
-
Determine Range: Find the minimum and maximum values for both your X and Y variables. This will help you set appropriate scales.
-
Choose Graph Type: Based on your data and the story you want to tell, select the most suitable graph type.
Step-by-Step Guide to Plotting Data Points
Let’s assume we’re plotting a simple line graph for temperature over time.
-
Draw Axes:
- Using a ruler, draw a horizontal line (X-axis) and a vertical line (Y-axis) that intersect at a 90-degree angle. This intersection is typically the origin (0,0), though not always.
-
Label Axes:
- Label the X-axis (e.g., “Time (Hours)”) and the Y-axis (e.g., “Temperature (°C)”).
-
Determine and Mark Scale:
-
X-axis Scale: Based on your time range (e.g., 0 to 10 hours), decide on an interval (e.g., 1 hour per tick mark). Mark these intervals evenly along the X-axis.
-
Y-axis Scale: Based on your temperature range (e.g., 10°C to 30°C), choose an appropriate interval (e.g., 5°C per tick mark). Mark these evenly along the Y-axis. Ensure your scale covers your entire data range and starts at a logical point (often zero, but not always necessary if your data is far from zero).
-
-
Plot Data Points:
-
For each data pair (e.g., Time = 1 hour, Temp = 12°C), find the corresponding value on the X-axis and move vertically until you reach the Y-axis value. Mark this intersection with a small dot or symbol.
-
Repeat for all data points.
-
-
Connect Points (for Line Graphs):
- Once all points are plotted, use a ruler to connect the points sequentially with straight lines. For scatter plots, points are generally not connected.
-
Add Title and Legend:
-
Write a clear, descriptive title at the top of the graph.
-
If you have multiple data sets (e.g., temperature in two different locations), use different symbols or line styles and include a legend to explain them.
-
Best Practices for Clarity and Accuracy in Manual Graphs
-
Precision: Use a sharp pencil and ruler for neat, accurate lines and points.
-
Even Spacing: Ensure tick marks and data intervals on your axes are evenly spaced.
-
Appropriate Scale: Don’t choose a scale that makes your data look flat (too wide) or too spiky (too narrow), unless you intend to highlight a specific feature.
-
Label Everything: Unlabeled axes or data series render a graph useless.
-
Avoid Clutter: Don’t overload the graph with too many lines, labels, or gridlines. Simplicity often enhances clarity.
Digital Plotting: Leveraging Software and Tools
The advent of computing technology has transformed data visualization, making it faster, more flexible, and capable of handling vast datasets. Digital plotting tools range from ubiquitous spreadsheet software to specialized statistical packages and programming libraries.
Essential Software for Data Visualization
The choice of software depends on your needs, technical proficiency, and the complexity of your data.
-
Spreadsheet Software: (e.g., Microsoft Excel, Google Sheets, LibreOffice Calc) – Excellent for basic to intermediate graphing. User-friendly interfaces, good for tabular data, and widely accessible.
-
Specialized Plotting Tools: (e.g., Tableau, Power BI, Qlik Sense) – Designed for advanced business intelligence and interactive dashboards. Offer powerful visualization capabilities, data blending, and reporting features.
-
Programming Libraries: (e.g., Matplotlib, Seaborn, Plotly, ggplot2 for Python/R) – Offer maximum flexibility and customization for statisticians, data scientists, and researchers. Require coding knowledge but allow for highly sophisticated and dynamic visualizations.
-
Scientific Plotting Software: (e.g., OriginLab Origin, GraphPad Prism) – Tailored for scientific and engineering data analysis and plotting, often with specific statistical functions built-in.
Using Spreadsheet Software (e.g., Excel, Google Sheets) for Graphing
Spreadsheets are the entry point for most users into digital plotting due to their accessibility and relative ease of use.
Data Entry and Organization
-
Input Data: Enter your data into columns and rows. Typically, the first column might be your independent variable (X-axis), and subsequent columns your dependent variables (Y-axis series).
-
Header Row: Use a header row to label your columns clearly. These labels will often automatically become your axis labels or legend entries.
-
Clean Data: Ensure data consistency (e.g., numbers are formatted as numbers, not text). Handle missing values appropriately.
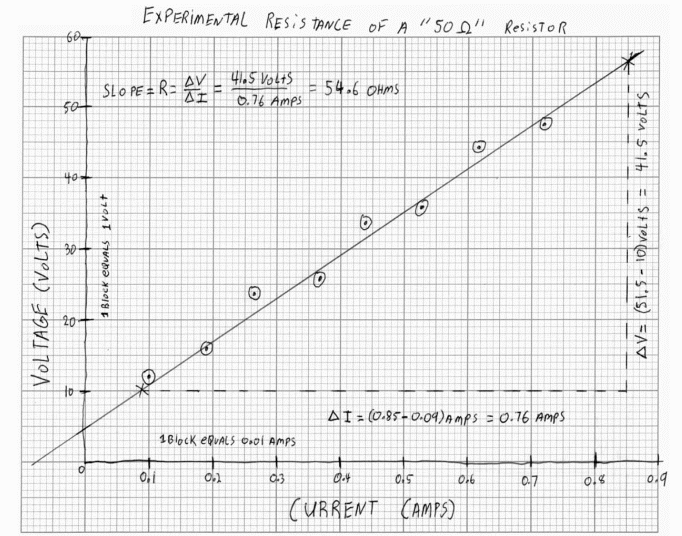
Chart Type Selection
-
Select Data: Highlight the range of cells containing the data you wish to plot, including the header row.
-
Insert Chart: Go to the “Insert” tab (Excel) or “Insert > Chart” (Google Sheets).
-
Choose Chart Type: The software will often suggest chart types based on your data, or you can manually select from options like “Line,” “Column” (Bar), “Scatter,” “Pie,” etc.
Customization and Formatting
Once the basic chart is generated, spreadsheet software offers extensive customization options:
-
Chart Elements: Add or remove chart title, axis titles, data labels, legend, gridlines.
-
Data Series: Change colors, line styles, markers, and bar patterns for different data series.
-
Axis Options: Adjust minimum/maximum values, major/minor tick intervals, number formatting, and font sizes for both axes.
-
Chart Layout: Modify chart size, position, and background.
-
Templates and Styles: Apply pre-defined chart styles or save your own as templates for future use.
Exploring Advanced Plotting Tools and Libraries
For those with more complex data or specific visualization needs, advanced tools and programming libraries offer unparalleled power.
Advantages of Programming-Based Plotting
-
Automation: Automate the creation of numerous plots from large datasets with a few lines of code.
-
Reproducibility: Code ensures that graphs can be precisely reproduced, facilitating collaboration and verification.
-
Customization: Full control over every visual element, allowing for highly specific and unique designs.
-
Scalability: Efficiently handle very large datasets that might overwhelm spreadsheet software.
-
Integration: Seamlessly integrate visualizations into data analysis pipelines, web applications, or reports.
-
Interactivity: Create dynamic and interactive plots (e.g., zoom, pan, tooltips) that allow users to explore data directly. Libraries like Plotly or D3.js excel here.
Interactive and Dynamic Visualizations
Tools like Tableau or libraries like Plotly and D3.js take visualization beyond static images. They enable:
-
Dashboards: Combine multiple interactive charts and tables into a single interface for real-time monitoring and exploration.
-
Drill-Down Capabilities: Click on a data point or category to reveal more granular details.
-
Filters and Slicers: Allow users to filter data dynamically, changing the view of the graph on the fly.
-
Animations: Show changes in data over time through animated transitions.
These capabilities are particularly valuable in business intelligence, scientific research, and data journalism, where users need to explore data from multiple angles.
Best Practices for Effective Data Visualization
Simply knowing how to plot is not enough; knowing how to plot effectively is where true impact lies. An effective graph is not just accurate but also clear, engaging, and honest.
Choosing the Right Graph Type for Your Data and Message
This is perhaps the most crucial decision. Misusing a graph type can obscure your data’s message or, worse, mislead your audience.
-
Relationship between two numerical variables? Scatter plot.
-
Trend over time? Line graph.
-
Comparison of discrete categories? Bar graph.
-
Distribution of a single numerical variable? Histogram.
-
Parts of a whole (simple case)? Pie chart.
-
Correlation vs. Causation: Remember that even a strong correlation shown on a scatter plot does not imply causation.
Ensuring Clarity, Simplicity, and Accessibility
-
Clarity: Make sure labels are readable, axes are clear, and the overall message is immediately understandable. Avoid jargon.
-
Simplicity: Eliminate unnecessary visual elements (chart junk) that distract from the data. Every element on the graph should serve a purpose.
-
Accessibility: Consider colorblind-friendly palettes. Use sufficient contrast. Provide text alternatives or descriptions for complex graphs for screen readers. Ensure fonts are legible.
Avoiding Misleading Visualizations and Common Pitfalls
Ethical data visualization is paramount. Graphs can easily be manipulated, intentionally or unintentionally, to distort the truth.
-
Truncated Y-axis: Starting the Y-axis scale at a value other than zero can exaggerate differences between data points. While sometimes necessary to show fine detail, always make this clear to the viewer.
-
Inconsistent Scales: Using different scales for comparison graphs can be highly misleading.
-
Overlapping Data: In scatter plots, too many points can overlap, obscuring patterns. Consider transparency or binning techniques.
-
Too Many Categories: Pie charts with too many slices become unreadable. Bar charts handle more categories better.
-
Correlation vs. Causation: A classic mistake is to imply causation from correlation, which a graph might visually suggest.
Incorporating Annotations and Storytelling
A graph is a powerful tool for storytelling.
-
Annotations: Add text labels directly on the graph to highlight specific data points, events, or critical thresholds.
-
Highlights: Use color or shading to draw attention to key trends or segments.
-
Context: Provide a brief explanatory caption or introductory paragraph to set the stage and explain what the graph illustrates.
-
Narrative Flow: If presenting multiple graphs, arrange them in a logical sequence to build a coherent story or argument.
The Future of Graphing and Data Storytelling
The field of data visualization is constantly evolving, driven by advancements in technology and the increasing volume and complexity of data.
AI and Automated Visualization
Artificial intelligence and machine learning are beginning to play a significant role. AI-powered tools can:
-
Recommend Best Charts: Analyze data characteristics and suggest the most appropriate graph types.
-
Automate Insights: Identify patterns, outliers, and correlations automatically, generating visualizations that highlight these findings.
-
Natural Language Generation (NLG): Automatically create textual summaries and explanations for graphs, augmenting the visual story.
This automation helps democratize data analysis, allowing more people to derive insights without deep statistical expertise.
Interactive Dashboards and Real-time Data
The demand for dynamic, real-time insights is growing. Interactive dashboards, built using tools like Tableau, Power BI, or custom web applications with libraries like D3.js, are becoming standard. They allow users to:
-
Monitor key performance indicators (KPIs) in real-time.
-
Filter and explore vast datasets dynamically.
-
Share insights collaboratively across organizations.
-
Respond quickly to changing market conditions or operational challenges.
The Evolving Role of the Data Visualizer
As tools become more sophisticated, the role of the data visualizer is shifting from merely plotting data to becoming a data storyteller and communication strategist. The focus is less on the mechanics of drawing a graph and more on:
-
Understanding the Audience: Tailoring visualizations to different stakeholders.
-
Defining the Message: Clearly articulating the key takeaway from the data.
-
Ethical Considerations: Ensuring visualizations are honest and unbiased.
-
Design Principles: Applying aesthetic and cognitive principles to create impactful and memorable visuals.
In conclusion, plotting on a graph is far more than a technical exercise; it’s a critical skill in the digital age for transforming raw data into meaningful insights. From understanding the fundamental components to leveraging powerful digital tools and adhering to best practices, mastering data visualization empowers you to communicate complex information with clarity, impact, and integrity. As technology continues to advance, the ability to effectively tell stories with data will only become more valuable, cementing graphs as indispensable tools in our ever-expanding technological toolkit.
aViewFromTheCave is a participant in the Amazon Services LLC Associates Program, an affiliate advertising program designed to provide a means for sites to earn advertising fees by advertising and linking to Amazon.com. Amazon, the Amazon logo, AmazonSupply, and the AmazonSupply logo are trademarks of Amazon.com, Inc. or its affiliates. As an Amazon Associate we earn affiliate commissions from qualifying purchases.