
Inflation, often described as the silent thief of purchasing power, is an economic phenomenon that impacts everyone, from the individual consumer to the largest multinational corporation and even the central banks setting monetary policy. At its core, inflation refers to the rate at which the general level of prices for goods and services is rising, and consequently, the purchasing power of currency is falling. Understanding how to measure inflation is not merely an academic exercise; it’s a critical skill for financial planning, investment decisions, business strategy, and effective economic governance. Without accurate measurement, we would be navigating an economy blind, unable to discern real growth from mere price increases or to formulate strategies to preserve wealth. This article delves into the methodologies, key metrics, and complexities involved in quantifying this pervasive economic force, strictly within the realm of money and finance.

The Core Concept: What is Inflation?
Before we can measure inflation, we must first clearly define it and understand its fundamental impact on economic activity and personal wealth. Inflation is more than just rising prices; it’s a systemic decrease in the value of money itself.
Defining Inflation and Its Impact
Inflation is formally defined as a sustained increase in the general price level of goods and services in an economy over a period of time. When the general price level rises, each unit of currency buys fewer goods and services. Consequently, inflation reflects a reduction in the purchasing power per unit of money – a loss of real value in the medium of exchange and unit of account within the economy.
The causes of inflation are multifaceted, often categorized into:
- Demand-Pull Inflation: Occurs when aggregate demand in an economy outpaces aggregate supply, pulling prices higher. Too much money chasing too few goods.
- Cost-Push Inflation: Results from an increase in the cost of production (e.g., wages, raw materials), which producers pass on to consumers in the form of higher prices.
- Built-in Inflation: Often linked to adaptive expectations, where workers expect higher wages to maintain their living standards, and businesses raise prices in anticipation of higher costs, creating a wage-price spiral.
The impact of inflation is pervasive. For individuals, it erodes the value of savings, increases the cost of living, and can diminish real wages if salary increases don’t keep pace. For businesses, it affects input costs, pricing strategies, and profit margins. For governments, it influences fiscal policies, interest rates, and the overall stability of the economy, making accurate measurement indispensable for policy formulation.
Why Measurement Matters
The precise measurement of inflation is paramount for several reasons:
- Informing Economic Policy: Central banks (like the Federal Reserve in the U.S. or the European Central Bank) use inflation data as a primary input for setting monetary policy, particularly interest rates. Their mandate often includes maintaining price stability, and accurate inflation figures guide their decisions to either stimulate or cool down the economy.
- Guiding Consumer and Business Decisions: Consumers use inflation expectations to make purchasing and saving decisions. Businesses rely on inflation data to set prices, plan investments, and negotiate wages. Understanding real returns on investments requires factoring in inflation.
- Protecting Savings and Investments: Investors need to understand inflation to ensure their investments yield a real return (i.e., a return that outpaces inflation). Inflation-indexed bonds, for instance, are designed to protect investors from the erosive effects of rising prices.
- Adjusting Contracts and Benefits: Many contracts, such as rental agreements or labor contracts, include clauses that adjust payments based on inflation to maintain real value. Social security benefits and government pensions are often indexed to inflation to protect beneficiaries’ purchasing power.
Key Metrics and Methodologies for Measuring Inflation
Measuring inflation is not a singular task but involves a suite of indices, each designed to capture price changes from a different perspective or for a specific purpose. The most widely recognized and utilized metrics provide snapshots of price movements across various sectors of the economy.
The Consumer Price Index (CPI)
The Consumer Price Index (CPI) is perhaps the most well-known measure of inflation, especially in everyday discourse. It measures the average change over time in the prices paid by urban consumers for a market basket of consumer goods and services.
- What it is: A weighted average of prices of a “basket” of goods and services, such as food, housing, clothing, transportation, medical care, education, and recreation. The specific items and their weights are determined by surveys of household spending patterns.
- How it’s Calculated: Statistical agencies (like the Bureau of Labor Statistics in the U.S.) collect price data for thousands of items from a variety of retail establishments across different geographic areas. These prices are then weighted according to their importance in the average consumer’s budget, aggregated, and compared to a base period.
- Limitations: While comprehensive, CPI has limitations. It may not fully account for substitution bias (consumers switching to cheaper alternatives when prices rise), quality bias (difficulty in separating price changes due to quality improvements from pure inflation), or the inclusion of new goods that weren’t in the original basket. Different variants exist, such as CPI for All Urban Consumers (CPI-U) and Chained CPI (C-CPI-U), which attempts to account for substitution bias.
The Producer Price Index (PPI)
The Producer Price Index (PPI) measures the average change over time in the selling prices received by domestic producers for their output. Unlike the CPI, which looks at the prices consumers pay, the PPI focuses on prices at the wholesale or producer level.
- What it is: A family of indexes that measures the average change in selling prices received by domestic producers of goods and services. PPIs track prices for various stages of processing, from crude materials to intermediate goods to finished goods.
- Difference from CPI: PPI is often considered a “leading indicator” for CPI, as increases in producer prices can eventually be passed on to consumers. It reflects input costs for businesses.
- Importance for Businesses: Businesses use PPI data to inform their pricing strategies, evaluate purchasing costs, and adjust contracts. It provides insights into inflationary pressures building up earlier in the supply chain.
The Personal Consumption Expenditures (PCE) Price Index
The Personal Consumption Expenditures (PCE) Price Index is the inflation measure preferred by the U.S. Federal Reserve for its monetary policy decisions.
- What it is: It measures the prices of goods and services purchased by consumers. While similar to CPI, PCE has a broader scope, covering a wider range of goods and services (including those paid for by third parties like employers for health insurance).
- Differences from CPI: PCE uses a chain-weighted index that allows for substitution effects, meaning it updates the weights of its components more frequently than CPI, making it more responsive to changes in consumer spending patterns. It also has broader coverage, making it a more comprehensive measure of consumer spending.
- Core PCE: Often, economists and policymakers focus on “Core PCE,” which excludes volatile food and energy prices, to get a clearer signal of underlying long-term inflation trends.
Other Inflation Indicators
Beyond these primary indices, several other measures contribute to a comprehensive understanding of inflation:
- GDP Deflator: The broadest measure of price changes across an entire economy, reflecting the prices of all domestically produced goods and services, not just consumption.
- Employment Cost Index (ECI): Measures changes in labor costs, including wages, salaries, and employer-paid benefits, providing insight into wage inflation pressures.
- Import/Export Prices: Track price changes for goods and services traded internationally, indicating external inflationary or deflationary pressures.
- Asset Price Inflation: While not typically included in core inflation measures, rising prices of assets like real estate or stocks can indicate specific inflationary trends within financial markets.
The Practicalities of Data Collection and Calculation
The journey from individual price points to a meaningful inflation rate is a rigorous process demanding systematic data collection, sophisticated statistical methods, and continuous refinement.
The Role of Statistical Agencies
National statistical agencies are the unsung heroes of inflation measurement. In the United States, the Bureau of Labor Statistics (BLS) is responsible for calculating the CPI and PPI. Other countries have their equivalents, such as Eurostat for the Eurozone or the Office for National Statistics (ONS) in the UK.
- Data Collection Methods: These agencies employ vast networks of data collectors who visit thousands of retail outlets, service providers, and housing units, as well as collect data online, via telephone, and through sophisticated scanner data from retailers. The goal is to capture actual transaction prices for a representative sample of goods and services.
- Quality Control: Rigorous quality control measures are in place to ensure accuracy, consistency, and representativeness of the collected data. This includes training field representatives, verifying reported prices, and employing statistical techniques to handle missing data or outliers.
Constructing the “Basket of Goods”
A critical step in calculating price indices like the CPI is defining and updating the “basket of goods and services.” This basket represents the typical spending patterns of the target population.
- Identifying Representative Items: Through extensive consumer expenditure surveys, statistical agencies identify thousands of specific items that households regularly purchase. These items are categorized into broad groups (e.g., food, housing, apparel) and further into specific product types (e.g., milk, rent, women’s dresses).
- Updating the Basket: Consumer spending habits evolve, so the basket must be periodically updated to remain relevant. New products emerge, old ones become obsolete, and the relative importance of different spending categories changes. This ensures the index accurately reflects current economic reality.
- Weighting: Each item and category in the basket is assigned a weight based on its share of total consumer spending. This ensures that price changes in frequently purchased or high-expenditure items (like housing or transportation) have a greater impact on the overall index than less significant items. For instance, a 10% increase in the price of bread will have a smaller impact than a 10% increase in rent, simply because rent typically accounts for a much larger portion of household budgets.
Calculating Price Indexes
Once the prices are collected and the weights are assigned, the actual index calculation takes place.
- Base Period: A specific period (e.g., 1982-84=100 for U.S. CPI) is chosen as a base, with its index value set to 100. All subsequent prices are expressed as a percentage of the base period prices.
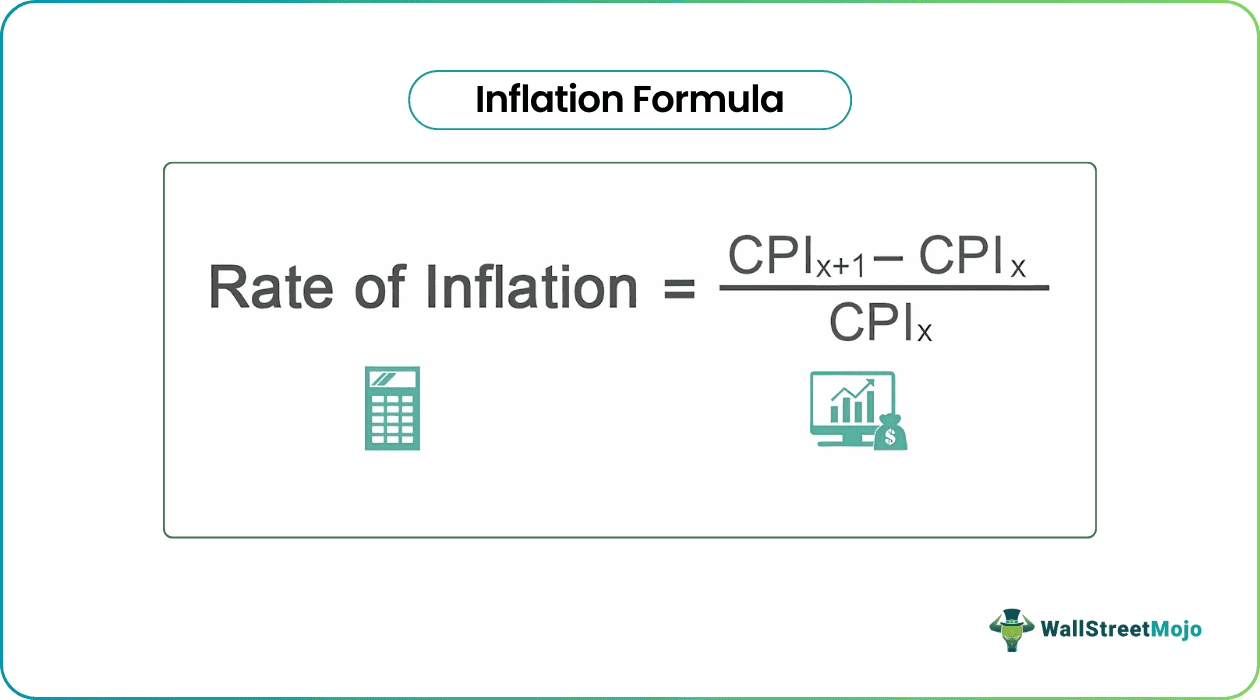
- Index Numbers: The price index for a given period is calculated by comparing the current cost of the basket of goods and services to the cost of the same basket in the base period, then multiplying by 100.
- Annualized Rates of Change: Inflation is typically reported as an annualized rate of change (e.g., “the CPI rose by 3.5% over the past 12 months”). This involves comparing the current index value to the index value from 12 months prior, allowing for easy understanding of trends. Month-over-month changes are also reported, often adjusted for seasonal variations.
Interpreting Inflation Data and Its Implications
Raw inflation numbers can be misleading without proper context and understanding of their implications. Different measures tell different stories, and their real-world impact varies significantly across economic actors.
Understanding Different Inflation Rates
When analyzing inflation, it’s crucial to distinguish between various reported rates:
- Headline vs. Core Inflation: Headline inflation includes all items in the basket. Core inflation (as seen with Core PCE) excludes volatile components like food and energy prices. Policymakers often focus on core inflation as a better indicator of underlying inflationary trends, as food and energy prices can swing wildly due to supply shocks, weather events, or geopolitical tensions, temporarily masking the true direction of inflation.
- Year-over-Year vs. Month-over-Month: Year-over-year (YoY) inflation compares the current month’s price level to the same month a year ago, providing a longer-term trend. Month-over-month (MoM) inflation compares the current month to the previous month, capturing recent changes but often being more volatile.
- Seasonally Adjusted vs. Unadjusted: Many economic data series, including inflation, are seasonally adjusted to remove predictable seasonal patterns (e.g., holiday spending, seasonal produce prices) that might distort underlying trends. Unadjusted data is useful for specific comparisons, but seasonally adjusted figures are preferred for analyzing fundamental economic shifts.
Impact on Personal Finance
For individuals, inflation is a critical factor in financial health:
- Purchasing Power Erosion: The most direct impact is the reduction in what your money can buy. If inflation is 3% and your income remains stagnant, your real purchasing power effectively decreases by 3%.
- Savings and Investments: Cash held in savings accounts with low interest rates will lose value over time if inflation outpaces the interest earned. Investors must seek returns that not only cover inflation but also provide a real gain. This necessitates understanding real interest rates (nominal interest rate minus inflation rate).
- Debt: Inflation can be a double-edged sword for debtors. While it erodes the real value of fixed-rate debt, making repayment easier in real terms, it can also lead to higher interest rates on new loans, increasing borrowing costs.
- Budgeting and Financial Planning: Understanding inflation helps individuals adjust their budgets, plan for future expenses (like retirement or education), and make informed decisions about large purchases.
Impact on Business and Economic Policy
Inflation profoundly influences business operations and government economic steering:
- Pricing Strategies and Cost Management: Businesses must constantly monitor inflation to adjust their pricing to maintain profit margins while remaining competitive. They also need to manage rising input costs for raw materials, labor, and transportation.
- Wage Negotiations: Unions and employees often demand wage increases to keep pace with inflation, leading to wage-price spirals if not managed effectively.
- Central Bank Interest Rate Decisions: Central banks use inflation data as a primary guide for setting benchmark interest rates. If inflation is too high, they might raise rates to cool demand; if too low, they might lower rates to stimulate the economy. Their goal is often to keep inflation within a target range (e.g., 2%).
- Government Fiscal Policy: Governments consider inflation when formulating budgets, setting tax policies, and planning public spending. Persistent high inflation can lead to social unrest and political instability.
Challenges and Nuances in Measuring Inflation
Despite sophisticated methodologies, measuring inflation is fraught with challenges and nuances that can lead to discrepancies between official statistics and individual experiences.
The Quality Adjustment Problem
One of the most complex issues is accounting for changes in the quality of goods and services.
- How to Account for Quality Improvements: A smartphone today, even if it costs the same as one five years ago, offers vastly superior capabilities. Simply comparing the price might overstate inflation (if the price is the same for a better product) or understate it (if a higher price reflects significant new features, not just inflation).
- Hedonic Adjustments: Statistical agencies use “hedonic adjustments” to decompose price changes into changes in quality versus changes in pure price. This involves statistically estimating the value of specific features or characteristics of a product and adjusting the price accordingly. While sophisticated, this process is inherently complex and subject to methodological debates.
Substitution Bias and New Product Inclusion
The static nature of a fixed “basket of goods” can misrepresent consumer behavior.
- Substitution Bias: When the price of one good rises, consumers often substitute it with a cheaper alternative (e.g., buying chicken instead of beef). A fixed-weight index might overstate the true cost of living increase by assuming consumers continue to buy the more expensive item. Chained CPIs are designed to mitigate this.
- New Product Inclusion: The constant introduction of new products (e.g., streaming services, smart home devices) poses a challenge. These items need to be incorporated into the basket, and their prices tracked over time, which can be difficult, especially for revolutionary products that initially have no comparable predecessors.
The Perception Gap: Official vs. Personal Inflation
Many individuals feel that their personal inflation rate is higher than the official figures.
- Different Spending Patterns: Official indices represent an “average” consumer. However, spending patterns vary significantly by age, income, geographic location, and lifestyle. A retiree spending a large portion of their income on healthcare might experience higher inflation than a young professional spending more on technology and recreation.
- Specific Regional Costs: Housing and local service costs can vary dramatically by region, meaning national averages might not reflect the lived experience in high-cost-of-living areas.
- Frequency of Purchases: Consumers are more acutely aware of price changes in items they purchase frequently (e.g., gasoline, groceries) than in items purchased rarely, which can skew their perception of overall inflation.

Disinflation, Deflation, and Hyperinflation
It’s also important to understand related terms:
- Disinflation: A slowdown in the rate of inflation (e.g., inflation falling from 5% to 2%). Prices are still rising, but at a slower pace.
- Deflation: A sustained decrease in the general price level, meaning inflation rates are negative. While seemingly positive, widespread deflation can signal economic contraction, reduced spending, and increased real debt burdens.
- Hyperinflation: Extremely rapid and out-of-control inflation, often exceeding 50% per month. It leads to economic collapse as currency loses value almost instantly.
In conclusion, measuring inflation is a sophisticated and dynamic process, vital for understanding the health and direction of an economy. From the granular data collection for the CPI and PPI to the broader, policy-focused PCE index, each metric offers unique insights. While challenges persist in perfectly capturing the nuanced realities of price changes and individual experiences, the ongoing efforts by statistical agencies provide invaluable tools for policymakers, businesses, and individuals to navigate the complexities of our financial world, safeguard wealth, and foster sustainable economic growth. Staying informed about how inflation is measured and what the latest figures imply is an essential component of financial literacy and responsible economic engagement.
aViewFromTheCave is a participant in the Amazon Services LLC Associates Program, an affiliate advertising program designed to provide a means for sites to earn advertising fees by advertising and linking to Amazon.com. Amazon, the Amazon logo, AmazonSupply, and the AmazonSupply logo are trademarks of Amazon.com, Inc. or its affiliates. As an Amazon Associate we earn affiliate commissions from qualifying purchases.