
In the vast landscape of personal finance, investing, and business operations, few concepts are as ubiquitous and fundamental as percentages. Far more than a mere mathematical curiosity, percentages serve as the universal language for expressing proportions, measuring change, comparing values, and making informed financial decisions. From calculating discounts on everyday purchases to assessing the performance of a multi-million dollar investment portfolio, understanding “how to make the percentage” is not just a useful skill; it’s a cornerstone of financial literacy and empowerment. This article delves into the mechanics of percentage calculation and, crucially, explores their indispensable role across various facets of the Money domain, providing insights for individuals and businesses alike to harness their power for strategic financial management.
Understanding the Core Concept of Percentages
Before we can effectively leverage percentages, a clear grasp of what they represent and why they hold such significance in finance is essential.
What is a Percentage?
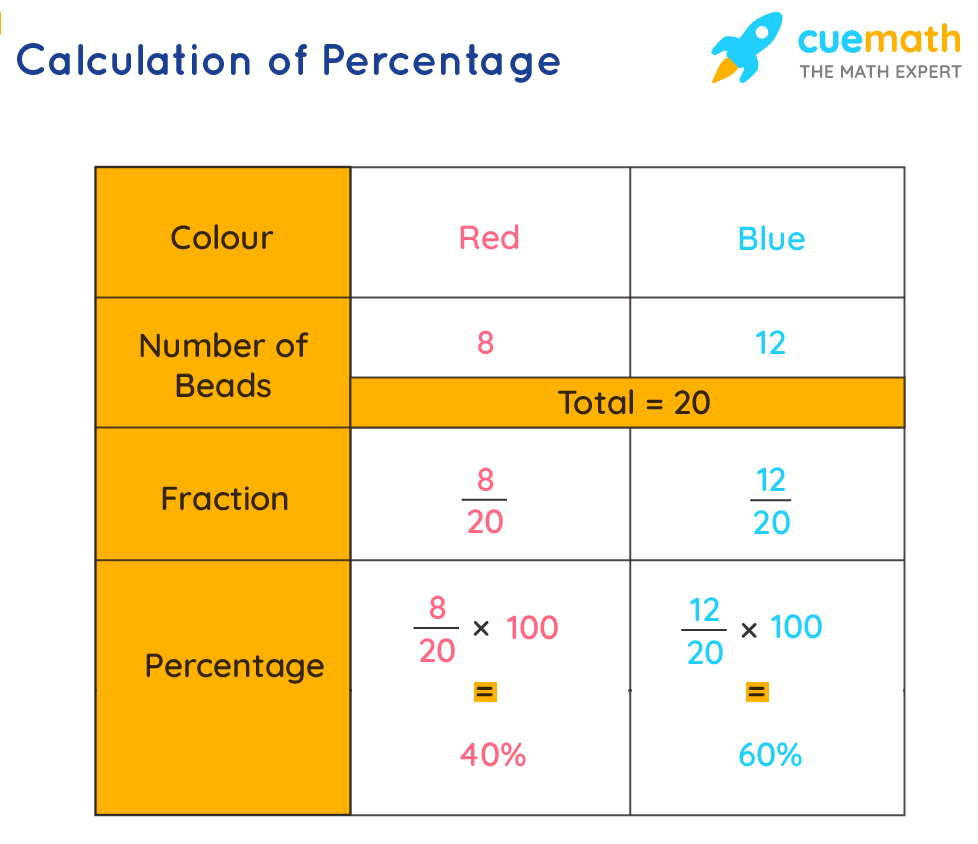
At its heart, a percentage is a way of expressing a number or ratio as a fraction of 100. The word “percentage” derives from the Latin “per centum,” meaning “by the hundred.” It’s a standardized way to represent a proportion, making it easier to compare different quantities even when their underlying totals vary. Mathematically, a percentage is represented by the symbol “%”.
To convert a fraction or decimal into a percentage, the basic formula is straightforward:
Percentage = (Part / Whole) * 100
For instance, if you have 25 apples out of a total of 100 apples, you have (25/100) * 100 = 25% of the apples. If you have 25 apples out of 50 apples, you have (25/50) * 100 = 50% of the apples. This simple conversion allows for direct comparison regardless of the base quantity.
Why Percentages are Indispensable in Finance
The power of percentages in finance lies in their ability to standardize and simplify complex information. Consider these key advantages:
-
Standardized Comparison: Percentages provide a common baseline for comparing different financial scenarios. Whether evaluating interest rates on loans, investment returns, or changes in revenue, expressing these figures as percentages allows for an apples-to-apples comparison, irrespective of the absolute dollar amounts involved.
-
Expressing Change: Financial health is dynamic. Percentages are the most effective way to communicate growth, decline, or fluctuation. A stock price increasing by $10 means little without context, but an increase of 5% immediately conveys its magnitude relative to its previous value.
-
Simplifying Complex Data: Financial reports, budgets, and market analyses often contain vast amounts of data. Reducing this data into key percentages (e.g., profit margin, debt-to-equity ratio, market share) makes it digestible and actionable for decision-makers.
-
Goal Setting and Tracking: From saving a percentage of your income to achieving a certain percentage return on investment, percentages provide clear, measurable targets for financial planning and allow for easy tracking of progress.
Fundamental Percentage Calculations for Personal Finance
For individuals managing their daily finances, understanding basic percentage calculations is paramount. These skills empower you to make smarter decisions about spending, saving, and debt.
Calculating Simple Percentages (e.g., Discounts, Tips, Sales Tax)
Everyday transactions frequently involve percentages.
-
Discounts: If an item costs $80 and is on sale for 20% off, the discount amount is $80 * 0.20 = $16. The final price is $80 – $16 = $64.
-
Tips: If a restaurant bill is $50 and you want to leave a 15% tip, the tip amount is $50 * 0.15 = $7.50.
-
Sales Tax: If an item costs $100 and the sales tax is 7%, the tax amount is $100 * 0.07 = $7. The total cost is $100 + $7 = $107.
These calculations rely on converting the percentage into a decimal (by dividing by 100) and then multiplying it by the base amount.
Determining Percentage Increase or Decrease (e.g., Salary Raises, Price Changes)
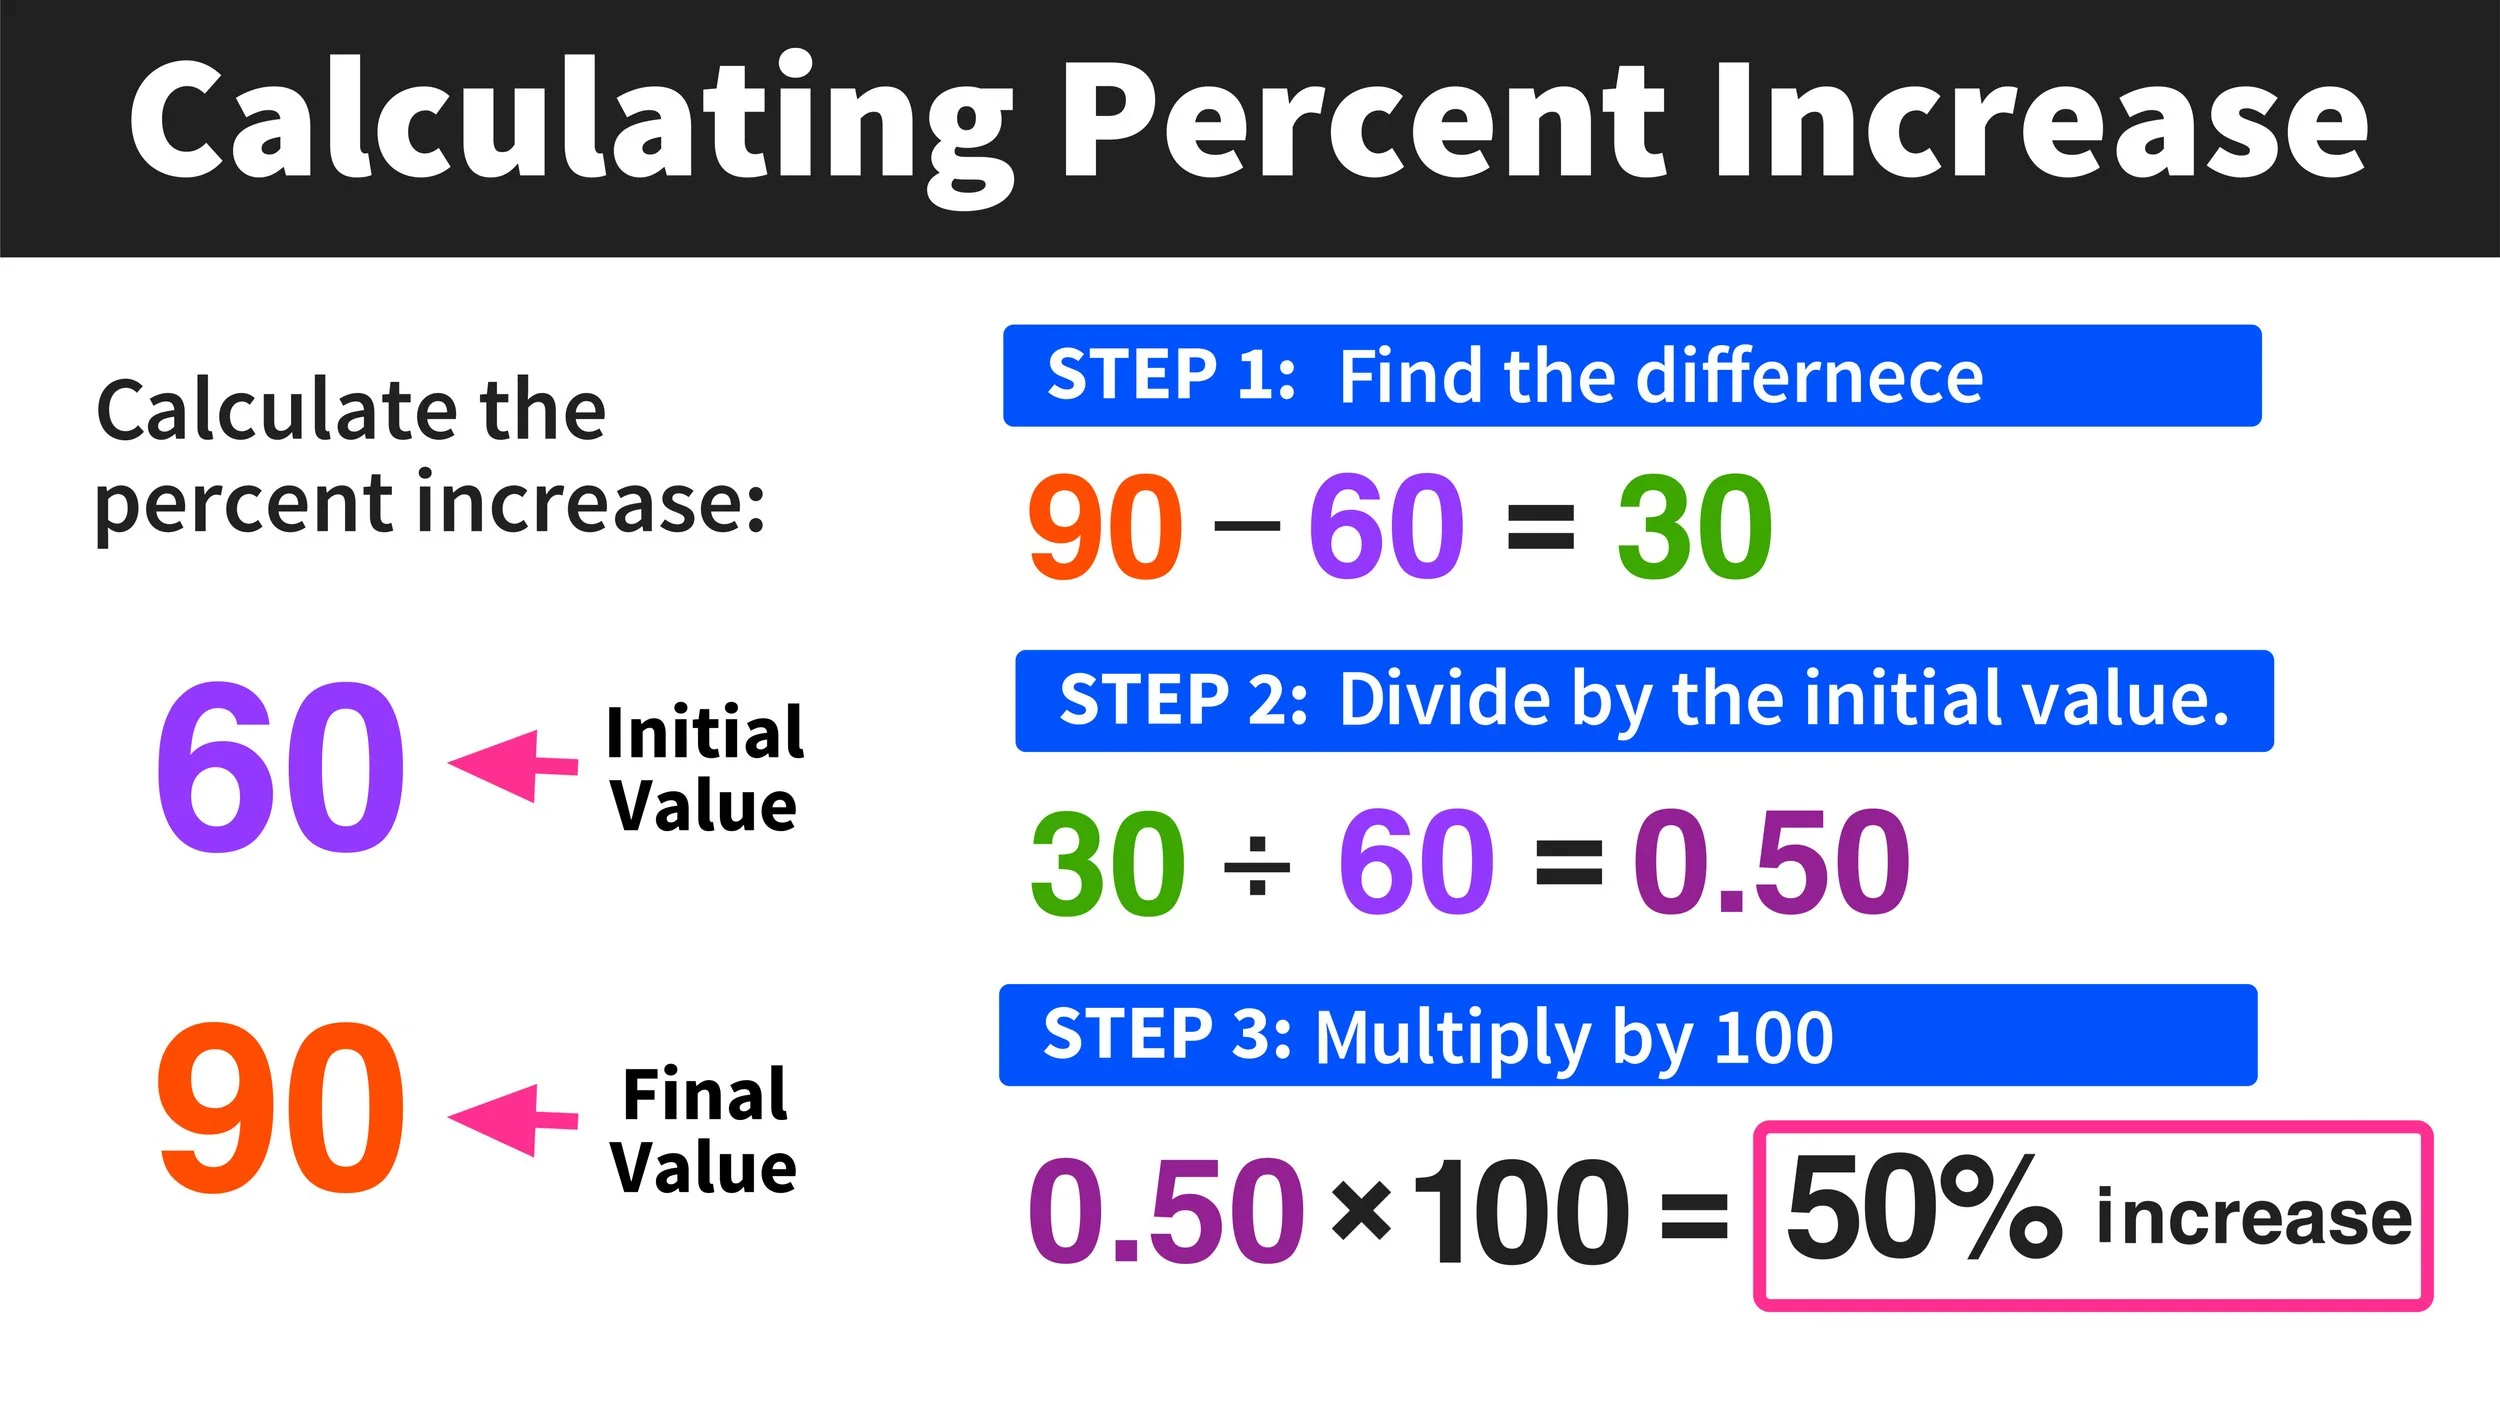
Understanding how to calculate percentage change is crucial for evaluating growth or reduction over time. This formula is vital for tracking income growth, expense changes, or investment performance.
Percentage Change = ((New Value – Old Value) / Old Value) * 100
-
Salary Increase: If your salary increased from $50,000 to $53,000, the percentage increase is (($53,000 – $50,000) / $50,000) * 100 = ($3,000 / $50,000) * 100 = 6%.
-
Expense Decrease: If your monthly utility bill decreased from $150 to $120, the percentage decrease is (($120 – $150) / $150) * 100 = (-$30 / $150) * 100 = -20%. (A negative result indicates a decrease).
Working with Percentages of a Total (e.g., Budget Allocation)
Budgeting often involves allocating portions of your income to different categories using percentages. This provides a clear framework for managing your money.
For example, if your monthly take-home income is $4,000, and you aim to follow the popular 50/30/20 rule (50% for needs, 30% for wants, 20% for savings/debt repayment):
-
Needs (50%): $4,000 * 0.50 = $2,000
-
Wants (30%): $4,000 * 0.30 = $1,200
-
Savings/Debt (20%): $4,000 * 0.20 = $800
These calculations help you visualize how your income is distributed and ensure you’re allocating funds in line with your financial goals.
Advanced Applications of Percentages in Investing and Business Finance
Moving beyond personal budgets, percentages become even more sophisticated and critical in the realms of investing and business management.

Understanding Investment Returns (ROI, Annualized Returns)
Investors rely heavily on percentages to evaluate the performance of their assets.
-
Return on Investment (ROI): This fundamental metric measures the profitability of an investment relative to its cost.
ROI = ((Current Value of Investment – Initial Cost of Investment) / Initial Cost of Investment) * 100
If you invested $10,000 and it grew to $12,000, your ROI is (($12,000 – $10,000) / $10,000) * 100 = 20%.
-
Annualized Returns: This standardizes returns over a one-year period, allowing for comparison between investments held for different durations. Calculating this can be complex, involving geometric averages for multi-year periods, but the core idea is to express the rate of return per year.
Percentages also apply to dividend yields, expense ratios of funds, and capital gains tax rates, all of which impact an investor’s net return.
Analyzing Interest Rates (Simple vs. Compound Interest)
Interest rates, universally expressed as percentages, are perhaps the most pervasive financial application of this concept.
-
Simple Interest: Calculated only on the principal amount. If you borrow $1,000 at 5% simple interest for 3 years, the interest is $1,000 * 0.05 * 3 = $150.
-
Compound Interest: The “interest on interest” phenomenon. This is where interest is calculated not only on the initial principal but also on the accumulated interest from previous periods. This is a powerful force, either for your benefit (savings, investments) or detriment (debt). The Annual Percentage Rate (APR) on loans and the Annual Percentage Yield (APY) on savings accounts both reflect compound interest, standardizing the cost or return over a year. A 5% APY means your money grows faster than a 5% simple interest rate due to the compounding effect.
Understanding the difference and the power of compounding is crucial for both borrowers and savers. Even a small percentage difference in interest rates can lead to significant financial implications over time.
Evaluating Profitability (Gross Margin, Net Margin)
Businesses utilize various percentage-based metrics to assess their financial health and operational efficiency.
-
Gross Profit Margin: Measures the percentage of revenue left after deducting the cost of goods sold (COGS).
Gross Profit Margin = ((Revenue – COGS) / Revenue) * 100
If a company has $1,000,000 in revenue and $600,000 in COGS, its gross margin is (($1,000,000 – $600,000) / $1,000,000) * 100 = 40%. This indicates the efficiency of production.
-
Net Profit Margin: Represents the percentage of revenue remaining after all expenses, including COGS, operating expenses, interest, and taxes, have been deducted.
Net Profit Margin = (Net Profit / Revenue) * 100
This is a comprehensive measure of a company’s overall profitability and operational effectiveness. Investors and analysts closely monitor these percentages to compare companies within the same industry and track performance over time.
Leveraging Percentages for Strategic Financial Planning
Beyond calculations, percentages are invaluable strategic tools for setting goals, managing risk, and making forward-looking financial decisions.
Budgeting by Percentage Rules (e.g., 50/30/20 Rule)
As mentioned earlier, percentage-based budgeting rules simplify financial planning. The 50/30/20 rule is a popular guideline, but variations exist. The power of these rules lies in their adaptability to different income levels. A 20% savings rate means the same relative commitment whether you earn $30,000 or $300,000 annually. This flexibility makes them powerful tools for maintaining financial discipline without needing to constantly re-evaluate exact dollar amounts.
Setting Financial Goals and Tracking Progress
Percentages offer a clear, measurable framework for financial goal setting. Instead of vague aspirations, you can set specific, percentage-based targets:
-
“I want to save 15% of my gross income towards retirement.”
-
“I aim to reduce my credit card debt by 25% this year.”
-
“My investment portfolio should generate an average annual return of 8%.”
Tracking progress against these percentage goals provides tangible feedback, motivating continued adherence to your financial plan. Seeing your debt percentage drop or your savings percentage rise offers a clear indicator of success.
Understanding Risk and Diversification in Percentage Terms
In investing, percentages are critical for managing risk through diversification. A common strategy is to allocate your portfolio across different asset classes (stocks, bonds, real estate) based on percentages that align with your risk tolerance and financial goals. For instance, a conservative investor might allocate 70% to bonds and 30% to stocks, while an aggressive investor might reverse those percentages. These allocations are dynamic and often adjusted as one approaches retirement or as market conditions change. Understanding these percentage allocations helps balance potential returns with acceptable levels of risk.
Common Pitfalls and Best Practices When Using Percentages
While incredibly powerful, percentages can also be misleading if not interpreted carefully.
Avoiding Misinterpretation
The most common pitfall is misunderstanding the “base” or “whole” from which a percentage is derived. A “100% increase” means an amount has doubled. A “50% increase from a 20% base” is not the same as a 70% increase. Always ask: “Percentage of what?” For example, a 1% management fee on a large investment portfolio can amount to a substantial dollar figure, while a 10% discount on a small item might be negligible. Context is everything.
The Impact of Compounding (Good and Bad)
The “eighth wonder of the world,” compound interest, deserves careful attention. While it can dramatically grow investments over time, it can also lead to spiraling debt if not managed. Understanding the percentage rates on loans (especially high-interest credit cards) and recognizing how quickly they can compound against you is vital for avoiding financial distress. Conversely, starting to save and invest early, even small percentages of income, allows the power of compounding to work in your favor over decades.
Utilizing Financial Tools
While mental math and basic calculators are useful for simple percentage calculations, for more complex financial planning, investment analysis, or business accounting, leverage dedicated financial tools. Spreadsheets (like Excel or Google Sheets) are invaluable for building models and automating percentage calculations. Online financial calculators for mortgages, retirement savings, and loan interest can provide quick and accurate results. For businesses, accounting software automatically calculates and presents key financial ratios as percentages, simplifying analysis and reporting.
Conclusion
The ability to “make the percentage”—to calculate, interpret, and strategically apply these figures—is an indispensable skill in the world of money. From personal budgeting and everyday shopping decisions to complex investment strategies and business profitability analysis, percentages serve as the universal metric, providing clarity, enabling comparison, and facilitating informed action. Mastering this fundamental concept empowers individuals to take control of their personal finances, allows investors to make smarter decisions, and equips businesses with the insights needed for sustainable growth. In an increasingly data-driven world, understanding percentages isn’t just about crunching numbers; it’s about unlocking financial literacy and paving the way for greater financial success.
aViewFromTheCave is a participant in the Amazon Services LLC Associates Program, an affiliate advertising program designed to provide a means for sites to earn advertising fees by advertising and linking to Amazon.com. Amazon, the Amazon logo, AmazonSupply, and the AmazonSupply logo are trademarks of Amazon.com, Inc. or its affiliates. As an Amazon Associate we earn affiliate commissions from qualifying purchases.