Percentages are more than just numbers; they are the universal language of comparison, change, and proportion, especially in the realm of finance. From deciphering a discount at the supermarket to evaluating the performance of an investment portfolio, a solid understanding of percentages is not merely beneficial—it’s absolutely essential for informed financial decision-making. Whether you’re managing personal finances, strategizing business growth, or navigating the complexities of the market, mastering “how to make percentage” work for you unlocks a profound level of financial literacy and control.
This article delves into the core mechanics of percentages and explores their myriad applications across personal and business finance. We’ll break down the fundamental calculations, illustrate practical scenarios, and uncover how this seemingly simple mathematical concept underpins nearly every aspect of our financial lives. By the end, you’ll not only understand how percentages are calculated but also how to leverage them as a powerful tool for achieving your financial goals.

The Core Mechanics: What a Percentage Is and How to Calculate It
At its heart, a percentage is a way of expressing a number as a fraction of 100. The term “percent” literally means “per hundred” or “out of every hundred.” This standardization to a base of 100 makes it incredibly easy to compare proportions of different sizes, providing a common ground for analysis.
Understanding the Basic Concept
Imagine you have a pie cut into 100 slices. If you eat 25 slices, you’ve eaten 25 percent of the pie. If you have 50 apples and 10 of them are red, then 10 out of 50 apples are red. To express this as a percentage, we ask: if the total was 100 apples, how many would be red? This concept of scaling to 100 is what makes percentages so versatile.
The simplicity of percentages lies in their ability to contextualize quantities. A raw number, like “a profit of $500,” tells you something, but “a profit of 10%” tells you much more, especially if you know the initial investment was $5,000. It immediately provides a sense of scale and efficiency.
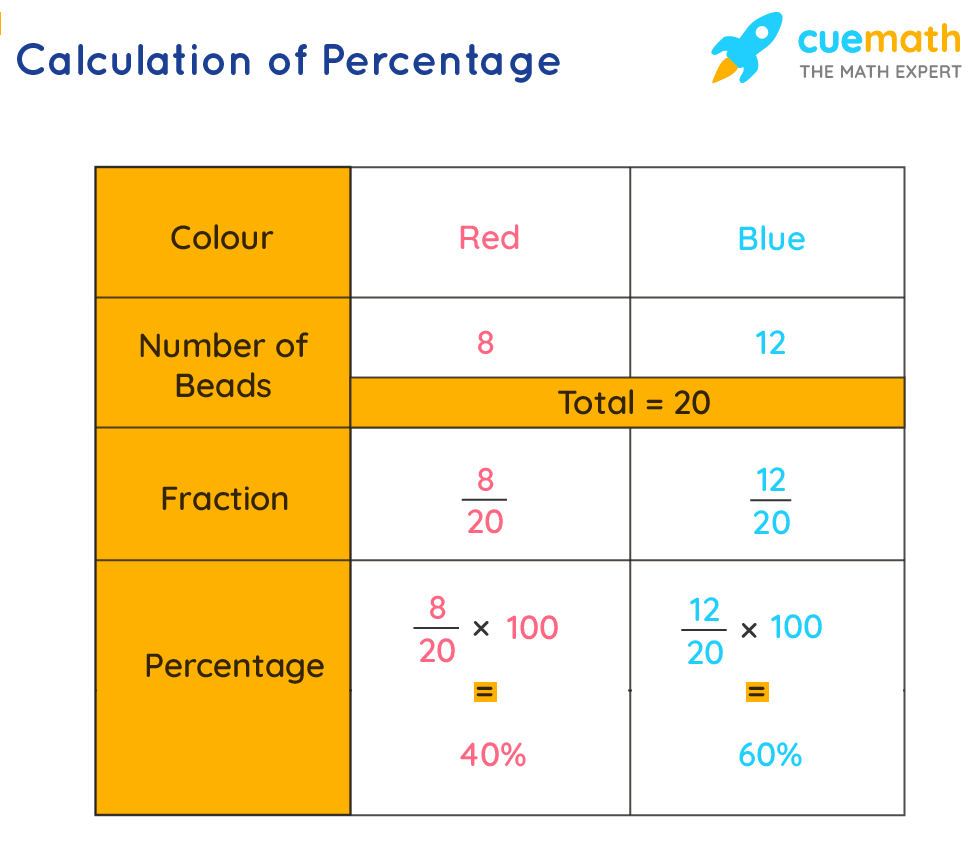
The Fundamental Formula: Part/Whole x 100%
Calculating a percentage is straightforward and relies on one fundamental formula:
Percentage = (Part / Whole) × 100%
Let’s break this down with an example:
- Scenario: You spent $30 on groceries from a total budget of $200. What percentage of your budget did you spend on groceries?
- Part: $30 (the amount spent)
- Whole: $200 (your total budget)
- Calculation: ($30 / $200) × 100% = 0.15 × 100% = 15%
So, you spent 15% of your budget on groceries. This basic formula is the cornerstone of all percentage calculations, whether you’re calculating a discount, a tax rate, or a profit margin.
Converting Between Decimals, Fractions, and Percentages
Fluency in converting between fractions, decimals, and percentages is crucial for quick and accurate financial calculations.
- Decimal to Percentage: Multiply the decimal by 100.
- Example: 0.25 = 0.25 × 100% = 25%
- Percentage to Decimal: Divide the percentage by 100.
- Example: 75% = 75 / 100 = 0.75
- Fraction to Percentage: First, convert the fraction to a decimal by dividing the numerator by the denominator, then multiply by 100.
- Example: 1/4 = 1 ÷ 4 = 0.25 = 0.25 × 100% = 25%
- Percentage to Fraction: Write the percentage as a fraction over 100, then simplify.
- Example: 50% = 50/100 = 1/2
These conversions are fundamental tools in your financial toolkit, allowing you to quickly interpret and manipulate financial data presented in various forms.
Practical Applications of Percentages in Personal Finance
For individuals, percentages are not abstract mathematical concepts but practical tools that influence daily spending, saving, and financial planning. Understanding them can significantly improve your personal financial health.
Budgeting and Expense Tracking
A budget is a plan for how you’ll spend and save your money. Percentages make budgeting intuitive and manageable:
- Allocating Income: Many financial experts recommend the 50/30/20 rule: 50% of your income for needs, 30% for wants, and 20% for savings and debt repayment. These are clear percentage allocations that guide your spending decisions.
- Tracking Spending Habits: By calculating the percentage of your income spent on various categories (e.g., housing, transport, food), you can identify areas where you might be overspending or where adjustments could lead to more savings. If 40% of your income goes to housing, for instance, you have a clear metric to evaluate its affordability and compare it to recommended benchmarks.
- Goal Setting: If you aim to save $5,000 and have already saved $1,000, you’re 20% towards your goal ($1,000/$5,000 x 100%). This provides clear progress indicators.
Saving and Debt Management
Percentages are at the heart of how savings grow and how debt accrues.
- Interest Rates (APY & APR): Annual Percentage Yield (APY) for savings accounts and Annual Percentage Rate (APR) for loans are crucial percentages. APY tells you how much your savings will grow in a year, including compound interest. APR tells you the annual cost of borrowing. Understanding these percentages helps you choose the best savings accounts and avoid high-interest debt. A 0.5% APY versus a 2.0% APY might seem small, but over time, especially with larger sums, the percentage difference can be substantial.
- Loan Repayments: Mortgage rates, car loan interest, and credit card interest are all expressed as percentages. Calculating the percentage of your payment that goes towards principal versus interest helps you understand the true cost of borrowing and strategize for faster debt reduction.
- Debt Reduction Strategies: Whether you’re following a debt snowball or debt avalanche method, understanding the percentage interest on each debt helps you prioritize which debts to tackle first to minimize overall interest paid.
Discounts, Sales, and Taxes
Every shopper encounters percentages in the form of discounts and sales tax.
- Calculating Savings: A “20% off” sale means you save 20% of the original price. If an item is $50 and has a 20% discount, you save $10 ($50 × 0.20 = $10), paying $40. Understanding this ensures you truly grasp the value of a sale.
- Understanding Final Costs: Sales tax is added as a percentage of the purchase price. If an item is $100 and sales tax is 8%, you pay an additional $8 ($100 × 0.08 = $8), for a total of $108. Failing to account for sales tax can lead to budget shortfalls.
Percentages in Investment and Wealth Growth
For investors, percentages are the primary language for measuring performance, assessing risk, and planning for future wealth.
Understanding Investment Returns
The success of an investment is almost always measured in percentages.
- Return on Investment (ROI): This is a key metric, showing the percentage gain or loss relative to the initial investment. If you invest $1,000 and it grows to $1,200, your gain is $200. Your ROI is ($200 / $1,000) × 100% = 20%.
- Compound Interest: Often called the “eighth wonder of the world,” compound interest means earning interest on your initial principal and on the accumulated interest from previous periods. The higher the percentage interest rate and the longer the investment horizon, the more significant the compounding effect. A 7% annual return compounded over 30 years can turn a modest sum into a substantial retirement nest egg.
- Growth Rates: Stock market indices, mutual funds, and individual stocks report their performance as percentage changes over various periods (daily, monthly, annually). A stock that grew by 15% last year provides a clear, comparable metric of its performance.
Risk Assessment and Portfolio Allocation
Percentages are critical for building a diversified investment portfolio and managing risk.
- Diversification: Investors allocate their assets across different categories (stocks, bonds, real estate, cash) using percentages. A common strategy might be 60% stocks, 30% bonds, and 10% cash, tailored to an individual’s risk tolerance and time horizon. These percentages dictate the risk-reward profile of your portfolio.
- Risk Tolerance: Your comfort level with potential losses is often expressed in terms of percentages. How much of your portfolio are you willing to see fluctuate by a certain percentage in a given period?
- Asset Rebalancing: Over time, the performance of different assets can shift your portfolio’s original percentage allocations. Rebalancing involves selling high-performing assets and buying low-performing ones to restore your desired percentages, managing risk and potentially locking in gains.
Inflation and Purchasing Power
Inflation, the rate at which the general level of prices for goods and services is rising, is expressed as a percentage.
- Erosion of Purchasing Power: If inflation is 3% annually, your money buys 3% less than it did a year ago. Understanding this percentage helps you realize that your investments need to generate returns higher than the inflation rate to truly grow your wealth in real terms.
- Real vs. Nominal Returns: A nominal return of 5% on an investment might sound good, but if inflation is 3%, your real return (the actual increase in purchasing power) is only 2% (5% – 3%). Percentages help you differentiate between apparent growth and actual wealth accumulation.
Business Finance: Leveraging Percentages for Strategic Decisions
In the business world, percentages are indispensable for analyzing performance, making strategic decisions, and communicating financial health.
Profit Margins and Markups
For businesses, percentages are vital for pricing, profitability, and operational efficiency.
- Gross Profit Margin: This is the percentage of revenue remaining after deducting the cost of goods sold (COGS). Formula: (Gross Profit / Revenue) × 100%. A high gross profit margin indicates efficient production.
- Net Profit Margin: This represents the percentage of revenue left after all expenses, including COGS, operating expenses, interest, and taxes, have been deducted. Formula: (Net Profit / Revenue) × 100%. It’s a key indicator of a company’s overall profitability.
- Markup: Businesses use markup percentages to price products. If an item costs $20 to produce and you want a 50% markup, you add $10 ($20 × 0.50) to the cost, selling it for $30.
Market Share and Growth Rates
Understanding where a business stands in its market and how it’s growing relies heavily on percentages.
- Market Share: This is the percentage of total sales in an industry generated by a particular company. Formula: (Company Sales / Total Industry Sales) × 100%. A growing market share indicates increasing competitive advantage.
- Revenue Growth Rate: The percentage increase in a company’s revenue over a specific period. Formula: ((Current Revenue – Previous Revenue) / Previous Revenue) × 100%). It’s a critical metric for investors and management to assess a company’s expansion and vitality.
- Customer Retention Rate: The percentage of existing customers a business retains over a period. High retention percentages often correlate with strong customer loyalty and sustainable growth.
Financial Ratios and Performance Metrics
Financial ratios, nearly all expressed as percentages, provide deep insights into a company’s liquidity, solvency, efficiency, and profitability.
- Debt-to-Equity Ratio: Measures the percentage of a company’s financing that comes from debt versus equity. A high percentage might indicate higher financial risk.
- Current Ratio: While often expressed as a decimal, it implies a percentage relationship of current assets to current liabilities, indicating a company’s ability to meet short-term obligations.
- Operating Expense Ratio: The percentage of revenue consumed by operating expenses. A lower percentage suggests greater operational efficiency.
- Return on Equity (ROE): The percentage of net income returned as a percentage of shareholders’ equity. It indicates how effectively management is using investors’ money to generate profits.
Common Pitfalls and Advanced Percentage Concepts
While percentages are powerful, misinterpreting them can lead to significant errors. Awareness of common pitfalls and slightly more advanced concepts is crucial.
The Difference Between Percentage Point and Percentage Change
This is a frequent source of confusion, particularly in financial news.
- Percentage Point Change: Refers to the absolute difference between two percentages. If a stock market index goes from 10% growth to 12% growth, that’s a 2 percentage point increase.
- Percentage Change: Refers to the relative change of a percentage. If an index goes from 10% growth to 12% growth, the percentage change in its growth rate is ((12-10)/10) * 100% = 20%. The growth rate itself increased by 20%, not just 2%. Understanding this distinction is vital when discussing rates, interest, and economic indicators.
Cumulative Percentages and Sequential Changes
When dealing with multiple percentage changes applied sequentially, it’s crucial not to simply add or subtract them.
- Example: A stock drops by 10% one day and then rises by 10% the next. Many assume it’s back to its original value.
- Initial Value: $100
- Drops 10%: $100 – ($100 * 0.10) = $90
- Rises 10% (of the new value): $90 + ($90 * 0.10) = $90 + $9 = $99
- The stock is now at $99, not $100. This is because the second percentage change is applied to a different base. This concept is critical for understanding investment volatility and compound returns.
Using Financial Tools and Spreadsheets
While manual calculation is essential for understanding, for complex scenarios or large datasets, financial calculators and spreadsheet software (like Excel or Google Sheets) are invaluable. They can automatically apply percentage formulas, calculate compound interest, and perform advanced financial modeling, saving time and reducing error. Knowing how to set up percentage calculations in these tools amplifies your financial analysis capabilities.

Conclusion
The ability to “make percentage” calculations and interpret their meaning is far more than a mathematical skill; it’s a foundational element of financial literacy. From the everyday decisions of personal budgeting and smart shopping to the complex strategies of investing and business management, percentages provide clarity, allow for meaningful comparisons, and empower informed choices.
By mastering the core concepts—how to calculate a percentage, convert between formats, and apply them across diverse financial scenarios—you equip yourself with a powerful lens through which to view and navigate the financial world. Embracing this fundamental tool ensures that you can confidently analyze financial data, make sound decisions, and ultimately achieve greater financial success, security, and independence.
aViewFromTheCave is a participant in the Amazon Services LLC Associates Program, an affiliate advertising program designed to provide a means for sites to earn advertising fees by advertising and linking to Amazon.com. Amazon, the Amazon logo, AmazonSupply, and the AmazonSupply logo are trademarks of Amazon.com, Inc. or its affiliates. As an Amazon Associate we earn affiliate commissions from qualifying purchases.