
In the intricate world of finance, numbers tell a story. But to truly understand that narrative, to grasp the scale, impact, and relationships between various financial figures, we often need to translate them into a universal language: percentages. While converting a number into a percent might seem like a basic mathematical operation, its mastery is an indispensable cornerstone for navigating personal finance, making savvy investment decisions, and understanding the health of businesses. It’s the difference between merely observing a change and comprehending its true significance in the grand financial scheme.

This article delves into the fundamental process of transforming raw numbers into percentages, explaining not just the “how,” but crucially, the “why” within the context of money. From dissecting your personal budget to evaluating market returns, understanding this conversion empowers individuals and professionals alike to analyze, compare, and communicate financial information with clarity and precision.
The Ubiquitous Role of Percentages in Finance
Percentages are more than just numerical expressions; they are the lingua franca of financial communication. Without them, comparing disparate financial data points or understanding relative change would be cumbersome, if not impossible. Their pervasive presence across all facets of finance underscores their critical importance.
Understanding Financial Metrics
From inflation rates that erode purchasing power to interest rates that define borrowing costs and investment returns, percentages are the fundamental units for quantifying financial metrics. A 3% interest rate on a savings account immediately tells you the proportional gain on your principal, regardless of the initial amount. Similarly, a 7% annual inflation rate directly communicates the decline in your money’s value over a year. These metrics, expressed as percentages, provide immediate context and allow for standardized comparison across different scales and timeframes. They simplify complex financial realities into digestible, comparable figures, enabling individuals and institutions to track progress, identify trends, and benchmark performance against expectations or competitors.
Making Informed Decisions
Whether you’re allocating funds in a household budget, deciding between investment opportunities, or evaluating a business proposal, percentages provide the framework for informed decision-making. Knowing that 20% of your income goes towards housing allows for easier adjustments than knowing you spend $1,000 on rent without context. When comparing two investment options, an annual return of 8% on one versus 5% on another provides a clear, apples-to-apples comparison of their profitability, independent of the initial capital invested. For businesses, understanding profit margins as percentages (e.g., a 15% net profit margin) allows management to assess operational efficiency and pricing strategies, guiding strategic decisions that directly impact the bottom line. This comparative power of percentages removes ambiguity, replacing raw data with actionable insights.
Communicating Financial Performance
In professional financial settings, percentages are the standard for reporting and communicating performance. Investors review quarterly earnings reports where revenue growth, profit margins, and expense ratios are all expressed as percentages. A company reporting a “10% increase in revenue” is far more impactful and easily understood than simply stating “revenue grew by $10 million,” especially if the total revenue figure isn’t immediately known. Financial analysts use percentage changes to explain market movements, economic indicators, and company valuations. This standardized language ensures that complex financial information can be conveyed efficiently and accurately to stakeholders, shareholders, and the broader market, fostering transparency and facilitating collective understanding.
The Fundamental Conversion: From Decimal to Percentage
At its core, converting a number to a percent involves a simple, yet powerful, mathematical manipulation. This process transforms a decimal or a fraction into a value out of one hundred, making it universally relatable.
The Simple Multiplication Method (Decimal * 100)
The most straightforward way to convert any decimal number into a percentage is to multiply it by 100. The logic is simple: “percent” literally means “per hundred.” So, to express a portion of a whole as a value relative to 100, you simply scale it up.
Steps:
-
Identify the decimal: This could be a direct decimal (e.g., 0.25) or the result of a division.
-
Multiply by 100: Take the decimal and multiply it by 100.
-
Add the percent symbol: Append the ‘%’ symbol to the result.
Practical Example in Personal Finance:
Imagine you want to calculate the percentage of your monthly income that goes towards debt payments.
-
Your monthly income is $4,000.
-
Your total debt payments (mortgage, car loan, credit card minimums) are $1,200.
First, convert the debt payment into a decimal representing a portion of your income:
$1,200 (debt payments) / $4,000 (income) = 0.30
Now, convert this decimal to a percentage:
0.30 * 100 = 30
So, 30% of your monthly income goes towards debt payments. This immediately highlights a significant portion of your budget and might prompt you to re-evaluate your debt load relative to your income.
Working with Fractions (Numerator / Denominator * 100)
Many financial scenarios naturally present themselves as fractions before they become decimals. For instance, calculating the proportion of a portfolio dedicated to a specific asset class or determining a discount amount.
Steps:
-
Form the fraction: Identify the “part” (numerator) and the “whole” (denominator).
-
Divide the numerator by the denominator: This converts the fraction into a decimal.
-
Multiply by 100 and add the percent symbol: As above, multiply the resulting decimal by 100 and add ‘%’.
Practical Example: Calculating a Discount Rate:
You see a coat originally priced at $250, now on sale for $200. What is the percentage discount?
-
Calculate the discount amount: $250 (original) – $200 (sale) = $50 (discount).
-
Form the fraction: The part is the discount ($50), the whole is the original price ($250).
$50 / $250
-
Convert to decimal: $50 / $250 = 0.20
-
Convert to percentage: 0.20 * 100 = 20%
You are getting a 20% discount on the coat. This method is fundamental for understanding sales, markups, and various financial fees.
Advanced Applications of Percentage Conversions in Investing and Business
Beyond basic personal finance, the ability to convert numbers into percentages becomes a powerful analytical tool in the more complex realms of investing and business operations. These applications often involve multiple steps and require a deeper understanding of financial concepts.
Calculating Investment Returns (ROI, Yields)
One of the most critical applications for investors is calculating various forms of returns, enabling them to evaluate the performance of their portfolios.
-
Return on Investment (ROI): This measures the profitability of an investment relative to its cost.
(Current Value of Investment – Original Cost of Investment) / Original Cost of Investment * 100
Example: You invest $10,000 in a stock, and it grows to $12,500.
($12,500 – $10,000) / $10,000 = $2,500 / $10,000 = 0.25
0.25 * 100 = 25% ROI.
This 25% ROI is a clear, comparable metric that tells you how profitable your investment was relative to its initial outlay.
-
Yields: Whether it’s dividend yield on stocks or bond yield, these percentages express the income generated by an investment as a proportion of its price.
(Annual Dividend or Interest Payment) / Current Price * 100
Example: A stock pays an annual dividend of $2 per share and trades at $50 per share.
$2 / $50 = 0.04
0.04 * 100 = 4% Dividend Yield.
This percentage helps investors compare the income-generating potential of different securities.
Analyzing Business Growth and Profitability (Margins, Growth Rates)
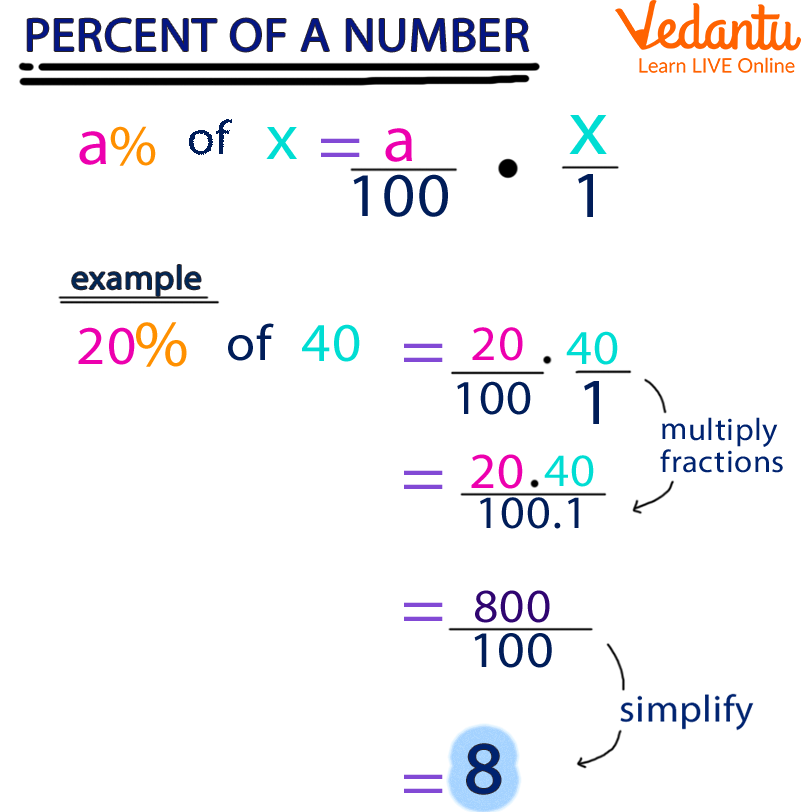
For business owners, managers, and analysts, converting raw financial data into percentages is essential for assessing operational efficiency, growth trajectories, and overall financial health.
-
Profit Margins: These percentages indicate how much profit a company makes for every dollar of revenue.
-
Gross Profit Margin: (Gross Profit / Revenue) * 100
-
Operating Profit Margin: (Operating Income / Revenue) * 100
-
Net Profit Margin: (Net Income / Revenue) * 100
Example: A company has $1,000,000 in revenue and $150,000 in net income.
($150,000 / $1,000,000) = 0.15
0.15 * 100 = 15% Net Profit Margin.
This 15% tells you that for every dollar of revenue, the company keeps 15 cents as profit after all expenses. It’s a key indicator of efficiency and pricing power.
-
-
Growth Rates: Measuring year-over-year revenue, profit, or asset growth as a percentage provides a standardized way to track progress and set future targets.
((Current Period Value – Prior Period Value) / Prior Period Value) * 100
Example: A company’s revenue grew from $800,000 last year to $1,000,000 this year.
(($1,000,000 – $800,000) / $800,000) = $200,000 / $800,000 = 0.25
0.25 * 100 = 25% Revenue Growth.
A 25% growth rate signals strong expansion and can be compared to industry averages or previous periods.
Understanding Interest Rates and Loan Payments
Interest rates are perhaps the most common percentage in daily financial life, influencing everything from credit card bills to mortgage payments and savings account growth.
-
Annual Percentage Rate (APR) and Annual Percentage Yield (APY): These are direct applications of percentages to loans and savings. While provided as percentages, understanding how they are derived from loan amounts, terms, and interest calculations requires converting various components into a proportional view. When you take out a loan, the interest calculation often starts with a principal amount, a rate, and a period. To understand the percentage of your payment that goes to interest versus principal, you need to convert fractions of your payment into percentages relative to the total.
-
Interest Paid on a Loan:
Example: You make a $500 payment on a loan, and $200 of that is interest.
($200 / $500) = 0.40
0.40 * 100 = 40% of that payment went to interest.
This helps you visualize the cost of borrowing and the amortization schedule.
Common Pitfalls and How to Avoid Them
While seemingly straightforward, misinterpreting or miscalculating percentages in financial contexts can lead to significant errors in judgment. Awareness of common pitfalls is crucial for accurate financial analysis.
Misinterpreting Basis Points vs. Percentage Points
A frequent point of confusion, especially in financial markets and economic reporting, is the difference between an absolute change in percentage (percentage points) and a percentage change of a percentage (basis points or rate change).
-
Percentage Points: This refers to the simple, absolute difference between two percentages.
Example: If an interest rate increases from 4% to 5%, that’s an increase of 1 percentage point. (5% – 4% = 1%).
-
Percentage Change: This refers to the relative change in a percentage.
Example: If an interest rate increases from 4% to 5%, the percentage change in the rate is:
((5% – 4%) / 4%) * 100 = (1% / 4%) * 100 = 0.25 * 100 = 25%.
This means the rate itself increased by 25% of its original value.
-
Basis Points (bps): Often used in bond markets and interest rates, one basis point is 0.01% (or 1/100th of a percentage point). So, 100 basis points equals 1 percentage point. If a rate goes up by 50 basis points, it means it increased by 0.50 percentage points (e.g., from 4% to 4.5%).
Understanding this distinction is vital for accurately interpreting financial news and making precise comparisons.
The Impact of Compounding on Percentage Growth
Compounding is a powerful force in finance, where returns on an investment also earn returns. Misunderstanding how percentages compound can lead to vastly inaccurate projections. A 10% annual return compounded over 10 years does not simply mean a 100% total return (10% * 10 years). Due to compounding, the total return would be significantly higher, as each year’s 10% is calculated on an ever-growing principal.
Example: $100 with a 10% annual return:
-
Year 1: $100 + ($100 * 0.10) = $110
-
Year 2: $110 + ($110 * 0.10) = $121
-
Year 10: Approximately $259.37 (a 159.37% total return, not 100%).
Always consider the compounding period when evaluating percentage-based growth or interest.
Ensuring Context in Financial Reporting
A percentage, in isolation, can be misleading. A 50% increase in revenue sounds fantastic, but if the base revenue was only $1,000, it’s less impressive than a 5% increase on $1 billion. Similarly, a 20% decline in a highly volatile stock might be less concerning than a 2% decline in a typically stable asset. Always seek the absolute numbers and the context behind the percentages to avoid misinterpretations. Understanding the “whole” from which the “part” percentage is derived is critical for a balanced financial perspective.
Leveraging Technology for Percentage Calculations
While the underlying math for converting numbers to percentages is straightforward, modern financial environments often involve large datasets and complex scenarios. Fortunately, technology makes these calculations efficient and minimizes human error.
Spreadsheet Software (Excel, Google Sheets)
Spreadsheets like Microsoft Excel and Google Sheets are indispensable tools for financial analysis. They automate percentage calculations, allowing users to build dynamic models and analyze vast amounts of data.
-
Direct Calculation: If you have a value in cell A1 and a total in cell B1, typing
=A1/B1in cell C1 will give you the decimal. Then, applying the “Percentage” format to cell C1 will automatically convert it to a percent (and multiply by 100). -
Formulas for Specific Applications: Spreadsheets can handle complex formulas for ROI, growth rates, debt-to-income ratios, and more, all relying on the fundamental number-to-percent conversion.
Financial Calculators and Apps
Dedicated financial calculators (both physical and app-based) often have specific functions for percentage changes, interest rate calculations, and compounding. These are particularly useful for quick on-the-go analysis or for complex scenarios involving multiple variables, such as loan amortization schedules.
Online Tools and Resources
Numerous websites offer free online calculators for various financial scenarios, including percentage calculators, ROI calculators, mortgage payment calculators, and compound interest calculators. These tools are excellent for quick checks, learning, and validating manual calculations. They demystify complex financial computations, presenting results in clear percentage terms.

Conclusion
The ability to convert a number into a percent is far more than a basic math skill; it is a foundational pillar of financial literacy. From understanding the nuances of your personal budget and debt obligations to making informed investment choices and comprehending the performance of businesses, percentages provide the context, clarity, and comparability essential for sound financial decision-making.
By mastering the simple multiplication and division methods, and recognizing the broader applications in calculating returns, analyzing growth, and interpreting interest rates, individuals can unlock deeper insights into their financial lives. Furthermore, being aware of common pitfalls—such as distinguishing between percentage points and percentage changes, and appreciating the power of compounding—ensures that these insights are accurate and robust.
In an increasingly data-driven world, leveraging technology like spreadsheets and financial calculators can streamline these calculations, freeing up cognitive resources for strategic analysis rather than manual arithmetic. Ultimately, transforming raw numbers into meaningful percentages empowers you to speak the language of money fluently, navigate complex financial landscapes with confidence, and build a more secure and prosperous future.
aViewFromTheCave is a participant in the Amazon Services LLC Associates Program, an affiliate advertising program designed to provide a means for sites to earn advertising fees by advertising and linking to Amazon.com. Amazon, the Amazon logo, AmazonSupply, and the AmazonSupply logo are trademarks of Amazon.com, Inc. or its affiliates. As an Amazon Associate we earn affiliate commissions from qualifying purchases.