
Data visualization is the cornerstone of modern data science. Whether you are performing exploratory data analysis, preparing a report for stakeholders, or academic publishing, the ability to translate raw numbers into meaningful visual narratives is indispensable. In the R ecosystem, ggplot2 stands as the gold standard for statistical graphics. Built on the “Grammar of Graphics”—a framework that allows you to layer components to build complex visualizations intuitively—it has become the most widely used visualization package in the R community. Installing and setting up this powerhouse is the first step toward mastering professional-grade data storytelling.

Understanding the ggplot2 Ecosystem
Before diving into the technical installation process, it is helpful to understand what ggplot2 actually is. Created by Hadley Wickham, ggplot2 is not just a collection of functions for making bar charts or scatter plots; it is a system for declaratively creating graphics. By separating the data, the aesthetic mappings (how data is displayed), and the geometric objects (the shapes themselves), it allows for a highly modular approach to plotting.
ggplot2 is a core member of the tidyverse, a collection of R packages designed for data science that share a common philosophy, grammar, and data structure. Because of this integration, learning to install and use ggplot2 effectively opens the door to other powerful tools like dplyr for data manipulation and tidyr for data cleaning.
Prerequisites for Installation
To ensure a smooth installation process, you must have the foundational environment correctly configured on your machine.
The R Environment
ggplot2 requires a functional version of the R language. If you have not yet installed R, visit the Comprehensive R Archive Network (CRAN) and download the version appropriate for your operating system (Windows, macOS, or Linux).
Integrated Development Environments (IDEs)
While you can run R from the terminal or the basic R GUI, it is highly recommended to use RStudio. RStudio provides a comprehensive IDE that simplifies package management, provides a user-friendly interface for viewing plots, and integrates perfectly with ggplot2. Ensure that your RStudio installation is up to date to avoid compatibility issues with the latest version of the tidyverse.
Step-by-Step Installation Process
Installing ggplot2 is a straightforward process within the R console. You have two primary methods: installing the package individually or installing the entire tidyverse suite.
Installing ggplot2 Individually
If you want to keep your environment lightweight and only require the visualization capabilities, you can install the package in isolation. Open your R or RStudio console and execute the following command:
install.packages("ggplot2")
Once the command runs, R will connect to CRAN, download the package files, and compile them for your system. You will see a series of messages in the console indicating the progress of the installation.
Installing the Tidyverse Suite
For most data scientists, installing the individual package is insufficient because ggplot2 works best when paired with data wrangling tools. It is widely recommended to install the entire tidyverse collection. This ensures that all dependencies are managed automatically and that your tools are updated in sync.
install.packages("tidyverse")
This method installs ggplot2, dplyr, tidyr, readr, purrr, tibble, stringr, and forcats simultaneously. By adopting this approach, you are equipping your machine with a complete, integrated toolkit for the entire data science lifecycle.
Verifying the Installation and Loading the Library
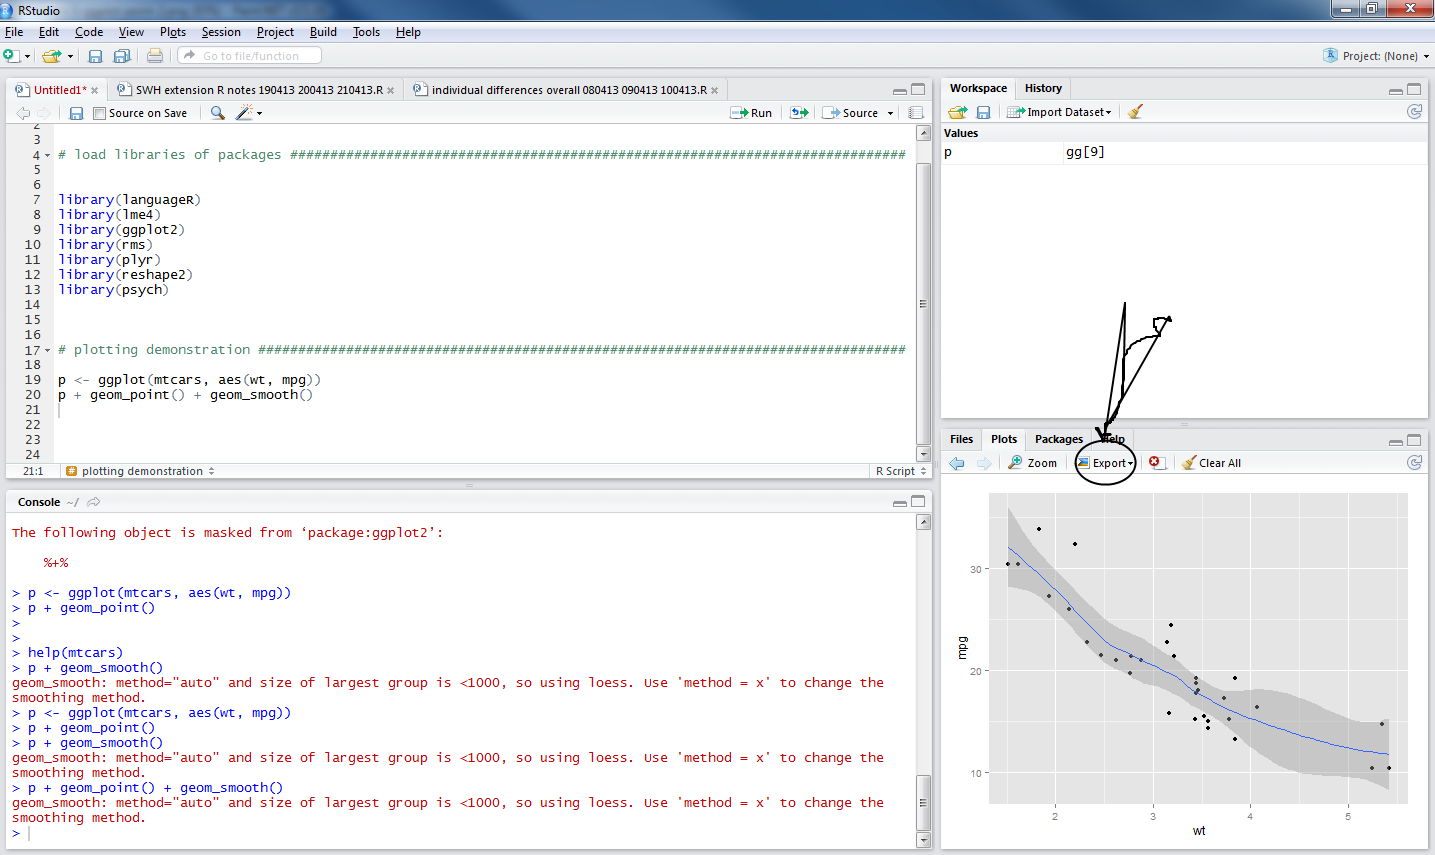
Once the installation process completes, you must verify that the package is correctly installed and ready for use. A package installation only copies the files to your machine; to use the functions within your current R session, you must load the library.
Loading the Package
Execute the following command in your console:
library(ggplot2)
If the package loads without error messages, the installation was successful. If you installed the tidyverse, you can load all the core packages using:
library(tidyverse)
Testing with a Simple Plot
To ensure that everything is functioning correctly, it is good practice to run a quick test plot using one of R’s built-in datasets. Use the mpg dataset that comes pre-loaded with ggplot2:
ggplot(data = mpg, aes(x = displ, y = hwy)) +
  geom_point()
If a scatter plot appears in your RStudio “Plots” pane, your environment is fully functional and ready for advanced visualization work.
Troubleshooting Common Installation Issues
Despite the simplicity of the installation process, users occasionally encounter hurdles, particularly regarding system dependencies or permission errors.
Dependency Errors
Sometimes, R packages require specific system libraries to be present on your OS (such as libxml2 or openssl). If you receive an error stating that a dependency is missing, identify the specific library mentioned in the console error and install it via your operating system’s package manager (e.g., apt-get for Ubuntu, brew for macOS).
Permission Denied
If you are working on a shared computer or a managed server, you might encounter a “Permission Denied” error during installation. This usually happens when R attempts to write to the system-level library directory. To resolve this, you can specify a local library path where you have write permissions:
- Create a local folder for your libraries:
dir.create("my_R_library") - Update your
.libPaths()to include this directory. - Re-run
install.packages("ggplot2", lib = "my_R_library").
Keeping Packages Up to Date
The R ecosystem evolves rapidly. To maintain performance and security, it is critical to keep your packages updated. Periodically run update.packages() in your R console. This command scans your installed packages and fetches the latest versions from CRAN, ensuring that your ggplot2 visualizations benefit from the latest features, bug fixes, and performance enhancements.
Why ggplot2 Remains the Industry Standard
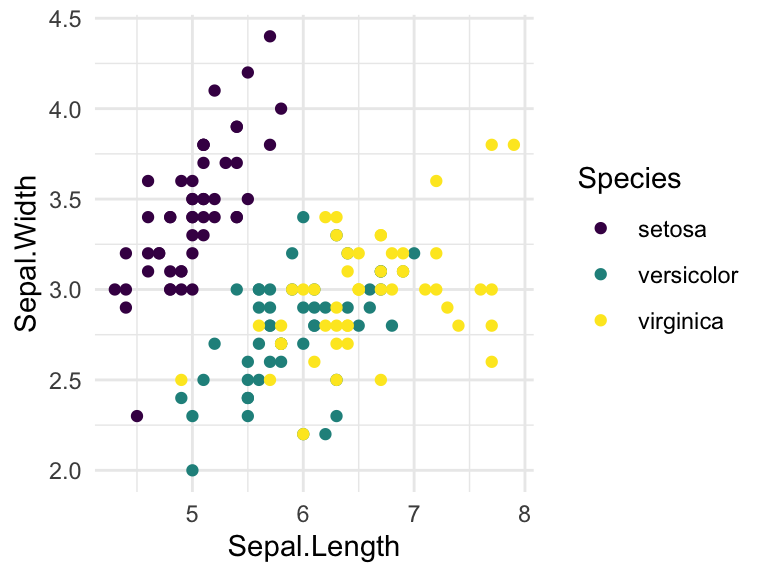
After successfully installing ggplot2, it is worth reflecting on why this package remains the default choice for professionals worldwide. Beyond its technical elegance, ggplot2 fosters a specific mindset toward data visualization. It forces the user to think about the data structure first—asking what variables need to be mapped to the x-axis, y-axis, color, or shape before even considering the visual output.
By adopting this grammatical approach, you move away from the “trial and error” method of plotting and toward a programmatic, reproducible workflow. When you write a script to generate a plot in ggplot2, you create a recipe that can be applied to different subsets of data or updated automatically as new data arrives. This reproducibility is the hallmark of modern professional analysis.
Furthermore, the extensibility of ggplot2 is unmatched. Because it is an open-source platform, hundreds of supplementary packages exist—such as ggthemes, ggrepel, and patchwork—that allow you to customize, label, and combine plots in ways that go far beyond the base functionality. From static academic figures to interactive web-ready dashboards, ggplot2 provides the solid foundation upon which all these sophisticated outputs are built.
With your installation now complete, you are positioned to explore the depths of data visualization. Whether you are creating simple distributions or complex multi-layered statistical models, the mastery of ggplot2 will significantly enhance your ability to communicate data-driven insights with clarity and impact.