
In the rapidly evolving landscape of educational technology and data science, the ability to bridge the gap between abstract mathematical concepts and visual data representation is more critical than ever. At the heart of this bridge lies the linear equation, specifically the “standard form.” While traditional pedagogy often focuses on manual plotting with graph paper and pencils, the modern tech ecosystem offers a suite of powerful tools—from browser-based graphing calculators to sophisticated AI models—that transform how we interact with these functions.
Graphing an equation in standard form ($Ax + By = C$) is a foundational skill that serves as a gateway to more complex data visualization, algorithm design, and even UI layout logic. This guide explores the most efficient digital workflows, software selections, and automated techniques for graphing standard form equations in the modern era.
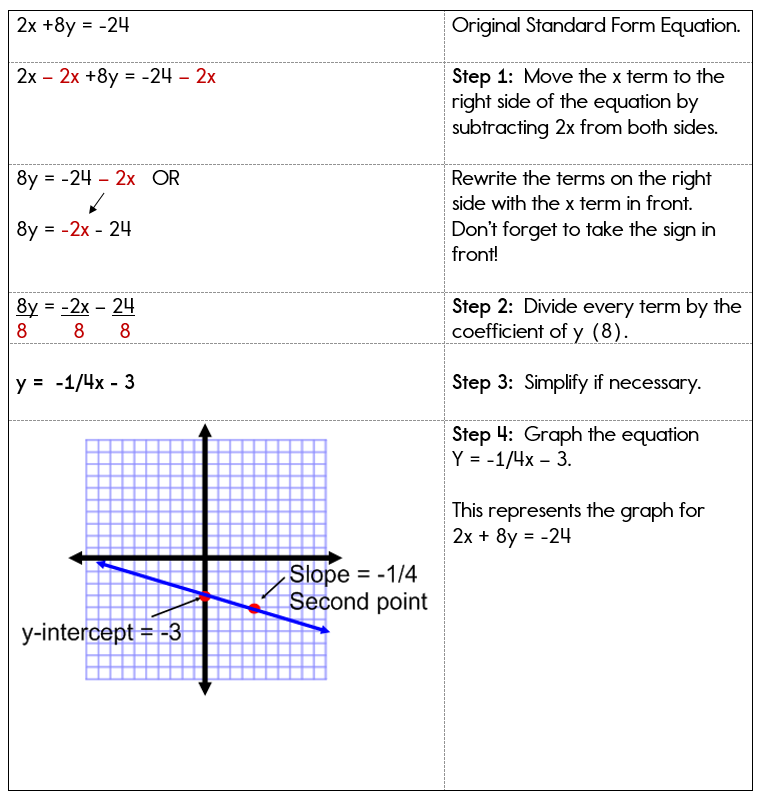
1. The Digital Evolution of Algebraic Visualization
For decades, the standard form was often overlooked in favor of the slope-intercept form ($y = mx + b$) because the latter is more intuitive for manual graphing. However, in the world of computer science and digital engineering, the standard form is often the “cleaner” data structure. It avoids the undefined slope issues associated with vertical lines and presents a balanced relationship between variables that is easier for algorithms to parse.
The Shift Toward Computational Thinking
Modern technology has shifted our focus from the process of plotting points to the analysis of the resulting visualization. Tools like Desmos, GeoGebra, and WolframAlpha have democratized access to high-level graphing. Instead of spending ten minutes calculating coordinates, a user can input a string of text and receive an interactive, high-fidelity visualization in milliseconds. This shift allows engineers and students alike to focus on what the graph represents—trends, constraints, and intersections—rather than the mechanics of the Cartesian plane.
Standard Form as a Data Set
In tech-centric fields, we view $Ax + By = C$ not just as a math problem, but as a set of constraints. Whether you are defining a boundary for a collision detection algorithm in game development or setting a budget constraint in a financial tool, the standard form provides a robust framework. Understanding how to graph this form digitally is the first step in mastering professional-grade data visualization software.
2. Leveraging Modern Graphing Software and Web Apps
The tech market is saturated with “math solvers,” but only a few offer the precision and versatility required for professional use. When your goal is to graph an equation in standard form, the choice of platform dictates the depth of analysis you can perform.
Desmos: The Gold Standard of Browser-Based Graphing
Desmos has revolutionized the classroom and the workspace with its intuitive, reactive interface. To graph a standard form equation in Desmos, the user experience is designed around “natural language input.” You do not need to isolate $y$ or perform any algebraic manipulation.
- Direct Input: Simply type
3x + 2y = 12. The software immediately renders the line. - Dynamic Sliders: By replacing constants with variables (e.g., $Ax + By = C$), Desmos allows you to create sliders for $A$, $B$, and $C$. This creates a “live” visualization where you can see how changing the coefficient of $x$ affects the steepness of the line in real-time.
GeoGebra: Beyond 2D Visualization
While Desmos excels in 2D simplicity, GeoGebra provides a more comprehensive suite for those moving into 3D modeling and dynamic geometry. GeoGebra’s “Algebra View” treats the standard form equation as an object. This is particularly useful for tech professionals who need to export their graphs as SVG files or embed them into web applications using JavaScript.
WolframAlpha: The Computational Intelligence Engine
WolframAlpha doesn’t just graph the line; it provides a comprehensive data sheet. If you input a standard form equation, the engine returns the graph, the x- and y-intercepts, the alternate forms (like slope-intercept), the derivative, and even the integral. For a developer or a technical writer, this provides all the necessary metadata for a project in a single query.
3. Step-by-Step Digital Workflow for Graphing Standard Form
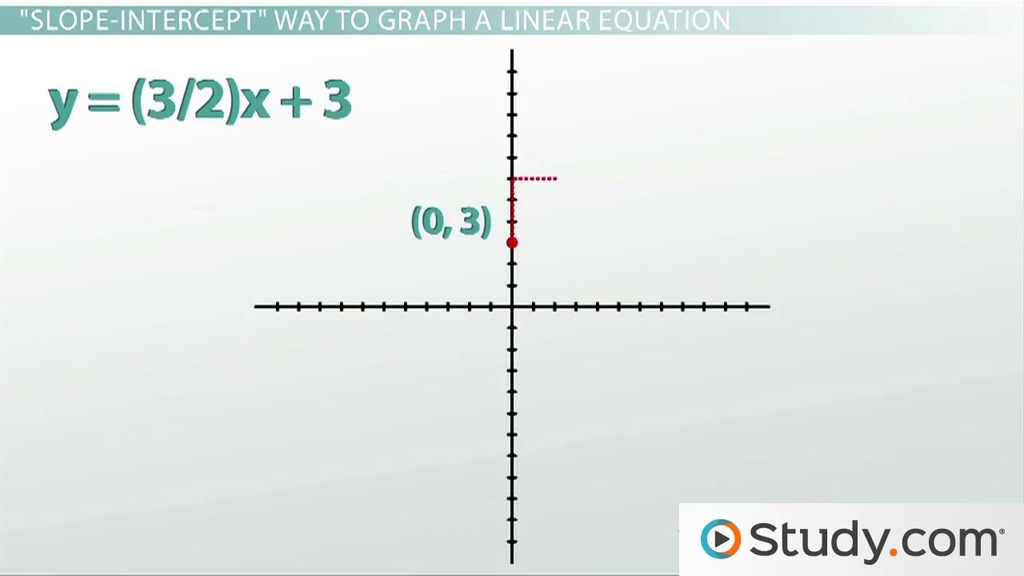
To use these tech tools effectively, one must understand the logic they use to render data. Most software utilizes the “Intercept Method” to visualize the standard form, as it is computationally the most efficient path.
Identifying Intercepts via Software
In the standard form $Ax + By = C$, the easiest way to graph the line is to find where it crosses the axes.
- Finding the X-intercept: Set $y = 0$. The software solves $Ax = C$, meaning $x = C/A$.
- Finding the Y-intercept: Set $x = 0$. The software solves $By = C$, meaning $y = C/B$.
When using a digital tool, you can often hover your cursor over these points on the rendered graph to see the exact coordinates. This “hover-to-reveal” feature is a staple of modern UI, ensuring that precision isn’t lost to the scale of the visual.
Converting and Verifying with Algorithmic Checks
A common tech-forward workflow involves verifying a standard form graph by converting it to slope-intercept form. While you can do this manually, many specialized apps and browser extensions can perform this transformation instantly. This is crucial for debugging code where a linear relationship might be causing an error in a software’s logic. If the graph looks “off,” a quick conversion tool can confirm if the coefficients were entered correctly into the database.
4. Integrating AI and Automation in Mathematical Analysis
The newest frontier in graphing standard form is the integration of Large Language Models (LLMs) and specialized AI. We are moving away from manual input and toward generative visualization.
Using AI for Problem Decomposition
AI tools like ChatGPT (with the Advanced Data Analysis plugin) or Claude can now take a verbal description of a linear relationship and output the standard form equation and its corresponding graph. For example, a user can prompt: “Generate a graph in standard form representing a scenario where the total cost is $50, with item X costing $5 and item Y costing $10.” The AI identifies the equation $5x + 10y = 50$, simplifies it, and uses Python libraries like Matplotlib to render the image.
Automation via Python and Matplotlib
For those in software development or data science, graphing standard form is often done through code rather than a GUI. Using Python is the professional standard for this:
- NumPy is used to create a range of x-values.
- Matplotlib is used to plot the equation.
The tech-savvy approach involves writing a function where $A$, $B$, and $C$ are parameters. This allows for the automated generation of thousands of graphs for data sets, a task that would be impossible using traditional graphing methods.
5. Troubleshooting and Precision in Digital Graphing
Despite the power of modern software, technical errors can still occur. Understanding the “edge cases” of graphing standard form is essential for maintaining data integrity.
Dealing with Vertical and Horizontal Lines
One of the primary technical advantages of the standard form is its ability to represent vertical lines (where $B = 0$) and horizontal lines (where $A = 0$). Some lower-end graphing apps struggle with “division by zero” errors if they try to convert everything to $y = mx + b$ first. When choosing a tool, ensure it supports “implicit equations.” This ensures that an equation like $5x = 20$ (a vertical line) renders correctly without crashing the script.
Resolution and Scaling Issues
When graphing for high-resolution displays or print media, “aliasing” can be an issue. Tech professionals should prioritize tools that use Vector Graphics (SVG or PDF) rather than Raster Graphics (PNG or JPEG). Vector-based graphing ensures that the line remains perfectly sharp regardless of the zoom level, which is vital for UI design and technical documentation.

The Future of Graphing: AR and VR
As we look toward the future, the “graphing” of standard form is moving into Augmented Reality (AR). Tech tools currently in development allow engineers to overlay linear constraints directly onto physical spaces. Imagine looking through an AR headset and seeing a “standard form” boundary line projected onto a construction site or a manufacturing floor. The math remains the same, but the tech through which we view the “graph” is becoming more immersive and integrated into our physical reality.
By mastering these digital tools and workflows, graphing standard form ceases to be a chore of manual calculation and becomes a powerful method of data storytelling and technical problem-solving. Whether you are using a simple web app or writing custom Python scripts, the intersection of algebra and technology provides a clearer view of the patterns that define our world.
aViewFromTheCave is a participant in the Amazon Services LLC Associates Program, an affiliate advertising program designed to provide a means for sites to earn advertising fees by advertising and linking to Amazon.com. Amazon, the Amazon logo, AmazonSupply, and the AmazonSupply logo are trademarks of Amazon.com, Inc. or its affiliates. As an Amazon Associate we earn affiliate commissions from qualifying purchases.