
The process of graphing an equation has undergone a radical transformation over the last two decades. While the fundamental mathematical principles remains the same—representing a relationship between variables on a coordinate plane—the tools we use to achieve this have migrated from physical graph paper and pencils to sophisticated computational engines and cloud-based software. In the contemporary tech landscape, graphing an equation is no longer just about plotting points; it is about data visualization, algorithmic precision, and interactive exploration.
As technology continues to integrate into education and professional engineering, understanding how to navigate the digital ecosystem of graphing tools is essential. This guide explores the most advanced software, AI-driven applications, and programmatic methods available today to turn complex equations into clear, insightful visual data.
1. The Digital Evolution: From Hand-Drawn Plots to Real-Time Rendering
The transition from manual graphing to digital rendering represents a shift toward “dynamic mathematics.” In the past, a student or engineer would spend significant time calculating a table of values (x, y coordinates) and manually marking them on a grid. Today, software handles the heavy lifting of computation, allowing users to focus on the behavior of the function itself.
The Rise of SaaS Graphing Platforms
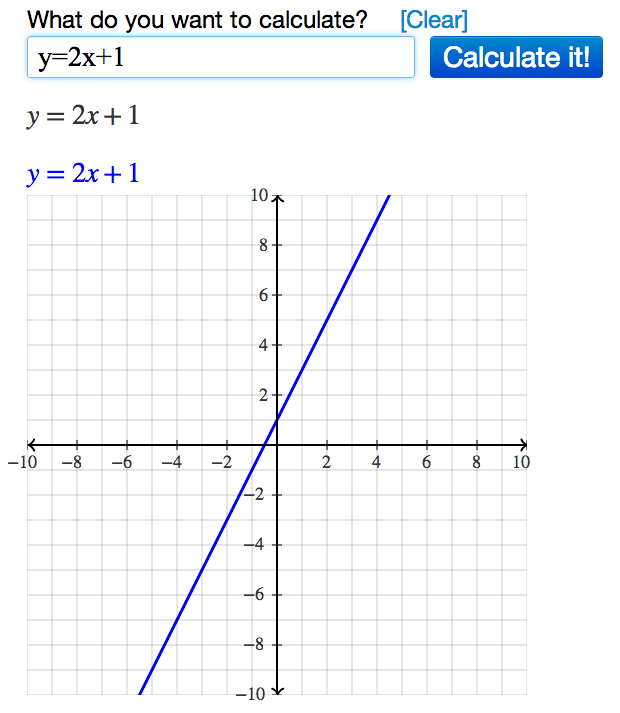
Software-as-a-Service (SaaS) platforms have revolutionized mathematical accessibility. Tools like Desmos and GeoGebra have replaced the need for expensive, standalone hardware for many users. These platforms use high-performance JavaScript engines to render functions in real-time. As you type an equation, the software interprets the syntax and updates the visual output instantaneously. This “live-feedback” loop is a hallmark of modern educational technology, enabling a deeper intuitive understanding of how changing a single variable—such as the slope in a linear equation—affects the entire geometric structure.
The Hardware Legacy: Graphing Calculators in the Modern Era
Despite the rise of web apps, hardware manufacturers like Texas Instruments and Casio have adapted. Modern graphing calculators now feature high-resolution color displays and Python integration. These devices are essentially specialized microcomputers designed for offline reliability. In high-stakes testing environments or remote field research where internet connectivity is limited, these handheld gadgets remain the tech standard for graphing equations.
2. Leading Digital Platforms for Visualizing Equations
When selecting a tool for graphing, the choice often depends on the complexity of the equation and the specific needs of the user. The tech industry has produced several specialized engines that cater to different niches, from secondary education to advanced physics research.
Desmos: The Gold Standard for Web-Based Visualization
Desmos has become synonymous with digital graphing. Its engine is designed for speed and beauty, utilizing a proprietary rendering system that can handle implicit equations, inequalities, and parametric equations with ease.
- Key Tech Feature: The “Slider” functionality. Desmos allows users to assign variables to sliders, enabling the animation of equations. This creates a 4D experience where time (represented by the sliding variable) shows the evolution of a function.
- Accessibility: Desmos is highly optimized for mobile browsers and tablets, making it a ubiquitous tool in the EdTech space.
GeoGebra: Bridging Algebra and Geometry
GeoGebra takes a more holistic approach by linking algebraic equations with geometric constructions. If you are graphing a conic section or a complex 3D surface, GeoGebra’s engine provides a more robust framework than standard plotters.
- 3D Calculator: Unlike basic 2D plotters, GeoGebra uses WebGL (Web Graphics Library) to render three-dimensional surfaces, allowing users to rotate, zoom, and intersect planes in a digital 3D space.
WolframAlpha: The Computational Intelligence Engine
WolframAlpha does not just graph; it understands. Built on the Wolfram Language, this tool uses symbolic computation to analyze an equation before plotting it. When you input an equation into WolframAlpha, the backend AI identifies the domain, range, derivatives, and integrals associated with that graph. It provides a comprehensive mathematical profile, making it the preferred tool for researchers who need more than just a visual representation.
3. Integrating AI and Machine Learning in Mathematical Graphing

The most significant recent advancement in graphing technology is the integration of Artificial Intelligence. We are moving away from manually typing LaTeX code or complex syntax and toward natural language processing and image recognition.
AI-Powered Equation Recognition (OCR)
Mobile applications such as Photomath and Microsoft Math Solver utilize Optical Character Recognition (OCR) and deep learning models to “read” handwritten equations. Once the AI identifies the characters, it parses the equation into a machine-readable format and generates an interactive graph. This bridge between the physical and digital worlds has significantly lowered the barrier to entry for students struggling with syntax errors.
Generative AI and Programmatic Graphing
Large Language Models (LLMs) like ChatGPT and Claude have introduced a new way to graph equations: through natural language prompts. A user can describe a complex scenario—”Graph a sine wave that decays over time and has a frequency of 5Hz”—and the AI will generate the precise mathematical function and provide the code (usually in Python) to render it. This shift represents a move toward “Intent-Based Graphing,” where the user’s goal is prioritized over their mastery of mathematical syntax.
4. Professional and Programmatic Graphing for Data Science
For engineers, data scientists, and developers, graphing an equation is often part of a larger technical workflow. In these scenarios, standalone apps are replaced by libraries and programming environments.
Python Libraries: Matplotlib, Seaborn, and Plotly
Python has become the leading language for technical computing. To graph an equation in a professional tech environment, one typically uses Matplotlib. This library allows for granular control over every pixel of the graph, from the thickness of the line to the DPI of the output.
- Plotly: For those needing interactive, web-ready graphs, Plotly offers a way to turn equations into JSON-based visualizations that can be embedded into dashboards. This is vital for tech firms that need to monitor real-time data trends based on predictive equations.
MATLAB and Mathematica: The Powerhouses of R&D
In the realms of aerospace, telecommunications, and high-level physics, MATLAB (Matrix Laboratory) remains the industry standard. It is designed for matrix-based mathematics, which is the foundation of graphing multi-dimensional equations. These tools provide “High-Fidelity” graphing, capable of simulating fluid dynamics, heat maps, and complex signal processing that exceed the capabilities of consumer-grade software.
5. Best Practices for Digital Equation Management
As you utilize these technological tools to graph equations, it is important to follow best practices to ensure accuracy, security, and collaborative efficiency.
Ensuring Computational Accuracy
While software is powerful, it is not infallible. Digital “artifacts” can occur when a graphing engine struggles with asymptotes or discontinuities (points where the equation is undefined).
- Resolution Settings: When using professional software, always check the “sampling rate” or “step size.” If the step size is too large, the software may “connect the dots” in a way that inaccurately represents a sharp curve or a gap in the function.
Cloud Collaboration and Version Control
Modern math tech allows for seamless collaboration. Platforms like Desmos and GeoGebra allow users to save their graphs to the cloud and share them via unique URLs. For those using programmatic methods (like Python), using GitHub for version control ensures that changes to the underlying equations are tracked. This is a critical component of “Reproducible Research”—the idea that others should be able to run your code and see the exact same graph you produced.
Data Security and Privacy in EdTech
When using AI-based apps or cloud-enabled graphing calculators, data privacy is a growing concern. Many of these tools collect user data to train their machine learning models. Professionals and educational institutions must ensure that the tools they use comply with data protection regulations (like GDPR or COPPA) to prevent the leakage of proprietary research or student information.
Conclusion
Graphing an equation has evolved from a static exercise into a dynamic technical discipline. Whether you are using the intuitive interface of Desmos, the computational power of WolframAlpha, or the programmatic flexibility of Python, the modern “tech stack” for mathematics offers unprecedented power to visualize the abstract. By mastering these digital tools, you can transform a simple string of variables into a vivid, interactive window into the laws of mathematics. As AI continues to advance, the gap between imagining a function and seeing it rendered on a screen will only continue to shrink, making the world of mathematical visualization more accessible and insightful than ever before.
aViewFromTheCave is a participant in the Amazon Services LLC Associates Program, an affiliate advertising program designed to provide a means for sites to earn advertising fees by advertising and linking to Amazon.com. Amazon, the Amazon logo, AmazonSupply, and the AmazonSupply logo are trademarks of Amazon.com, Inc. or its affiliates. As an Amazon Associate we earn affiliate commissions from qualifying purchases.