In the complex world of finance, from personal budgeting to corporate strategy, percentages are the universal language that translates raw numbers into actionable insights. They allow us to compare different values on a common scale, understand growth or decline, evaluate profitability, and make informed decisions about our money. Far from being just a mathematical exercise, mastering how to “get the percentage” is a fundamental skill that empowers individuals and businesses alike to navigate financial landscapes with confidence and clarity. This article will delve into the essential applications of percentages across various financial domains, providing practical guidance on how to calculate and interpret them effectively.

The Foundational Role of Percentages in Finance
At its heart, a percentage is a way of expressing a number as a fraction of 100. The term “percent” literally means “per hundred.” This simple concept becomes incredibly powerful when applied to financial data, providing context and comparability that raw figures often lack.
Understanding the Core Concept: What Exactly is a Percentage?
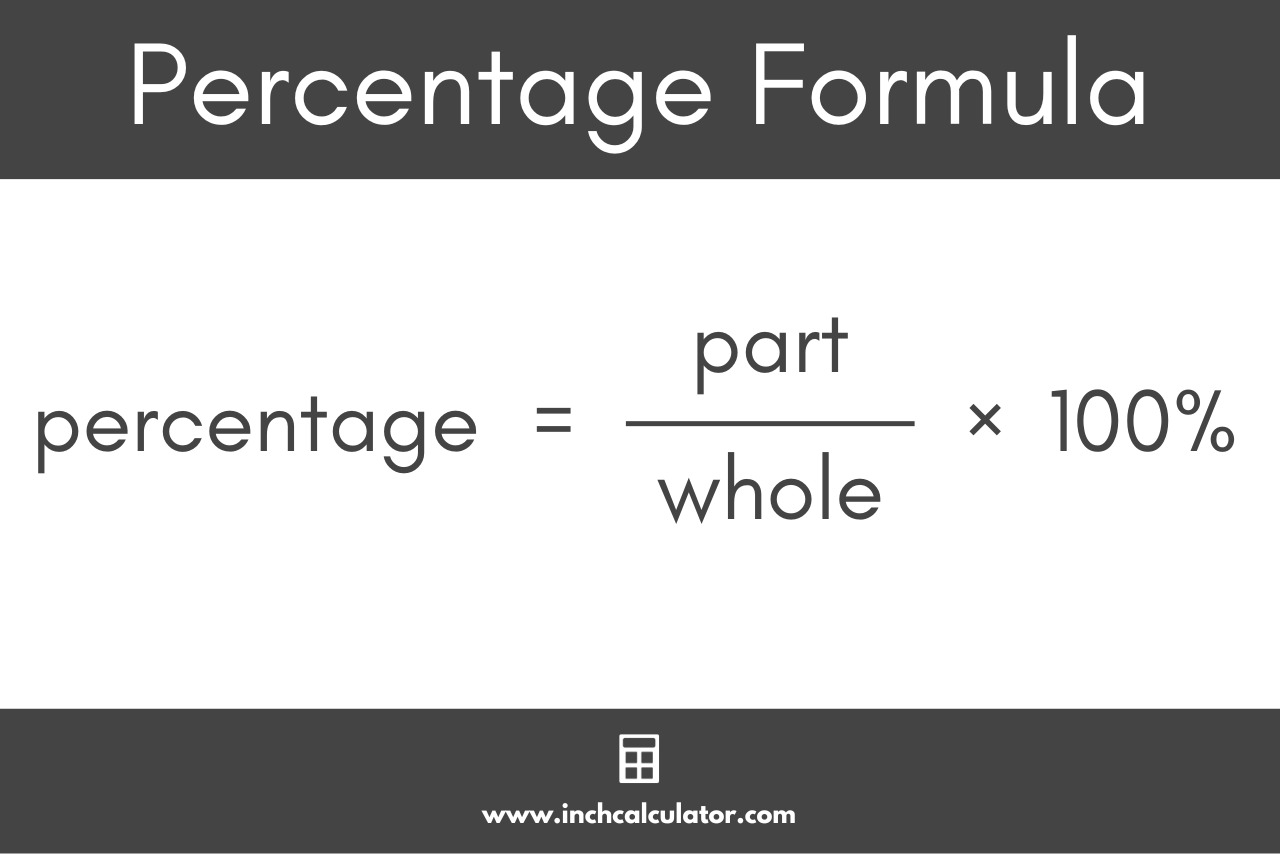
A percentage is calculated by dividing a part by the whole and then multiplying the result by 100. The basic formula is:
Percentage = (Part / Whole) × 100
For instance, if you spent $300 out of an income of $3000, your spending percentage would be ($300 / $3000) × 100 = 10%. This allows for quick understanding and comparison, regardless of the absolute scale of the numbers involved. Whether we’re talking about a small personal budget or a multi-million dollar corporate report, percentages standardize the comparison.
Why Financial Percentages Are Indispensable for Decision-Making
Percentages bring clarity and perspective to financial figures. A $100 increase in your investment might seem small, but if your initial investment was $500, a 20% return is significant. Conversely, if your initial investment was $10,000, a 1% return for the same $100 gain would signal a very different outcome.
- Comparability: Percentages allow for an apples-to-apples comparison between different entities or over different time periods, even if their base values are vastly different. You can compare the profit margin of a small local business to that of a multinational corporation.
- Context: They provide context for absolute numbers. A $5,000 expense is just a number until you express it as a percentage of your monthly income or annual revenue, revealing its true impact.
- Trend Analysis: By tracking percentage changes over time (e.g., year-over-year revenue growth, month-over-month expense reduction), you can identify trends, forecast future performance, and spot potential issues early.
- Goal Setting and Tracking: Financial goals, whether saving for retirement or increasing sales, are often set and measured in percentages, making progress tracking straightforward.
Without percentages, financial analysis would be a cumbersome task, making it difficult to gauge performance, assess risk, or allocate resources efficiently.
Essential Percentage Calculations for Personal Finance Management
For individuals, understanding percentages is key to effective personal finance, enabling smarter decisions about income, expenses, savings, and debt.
Mastering Your Budget: Income, Expenses, and Savings Rates
Budgeting is fundamentally about managing percentages. To understand where your money goes and how much you’re saving, you need to convert your income and expenditure into percentages.
- Expense Ratios: To calculate what percentage of your income goes to housing, food, transportation, or entertainment, simply divide the amount spent on each category by your total net income and multiply by 100. For example, if your net income is $4,000 and you spend $1,200 on rent, your housing expense is ($1,200 / $4,000) × 100 = 30%. This helps you identify areas where you might be overspending relative to financial guidelines (like the 50/30/20 rule).
- Savings Rate: This crucial metric indicates how much of your income you are setting aside for future goals. Calculate it by dividing your total monthly savings by your total monthly net income and multiplying by 100. A higher savings rate accelerates your journey towards financial independence.
- Debt-to-Income Ratio (DTI): Lenders often use this to assess your ability to manage monthly payments. It’s calculated by dividing your total monthly debt payments by your gross monthly income. For example, if your total debt payments (mortgage, car loan, credit cards) are $1,500 and your gross income is $5,000, your DTI is ($1,500 / $5,000) × 100 = 30%.
Deciphering Loans and Debt: Interest Rates and Repayment Percentages
Loans, mortgages, and credit cards are all heavily influenced by percentages, specifically interest rates. Understanding these percentages is vital to managing debt effectively.
- Annual Percentage Rate (APR): This is the annual rate charged for borrowing or earned by an investment. When taking out a loan, the APR tells you the total cost of borrowing over a year, including interest and other fees. Understanding how to compare APRs from different lenders is crucial for minimizing borrowing costs.
- Interest Paid Percentage: To figure out what percentage of your payment goes towards interest versus principal, particularly in the early stages of a loan, you can divide the interest portion of a payment by the total payment amount. This helps visualize the true cost of borrowing over time.
- Minimum Payment as a Percentage of Balance: While calculating this isn’t usually necessary for the borrower, credit card companies might show how little of your principal you’re paying off with minimum payments, which are often just a small percentage of the outstanding balance plus all accrued interest.
Everyday Transactions: Discounts, Sales Tax, and Tips
Percentages are ubiquitous in daily consumer interactions, from shopping to dining.
- Discounts: When an item is “20% off,” you calculate the savings by multiplying the original price by 0.20 (20/100). The discounted price is then the original price minus the savings. For example, a $50 item with a 20% discount means $50 × 0.20 = $10 savings, making the new price $40.
- Sales Tax: This is usually a percentage added to the price of goods and services. If the sales tax is 8% on a $100 item, the tax is $100 × 0.08 = $8, bringing the total to $108.
- Tips/Gratuities: Typically calculated as a percentage of the service cost, usually 15-20%. For a $75 restaurant bill and a 20% tip, you would calculate $75 × 0.20 = $15 tip.
Leveraging Percentages for Investment Growth and Wealth Building
In the world of investing, percentages are the yardstick for measuring performance, assessing risk, and making strategic asset allocation decisions.
Calculating Return on Investment (ROI) and Compound Interest
These are perhaps the most critical percentage calculations for investors.
- Return on Investment (ROI): This measures the profitability of an investment relative to its cost.
ROI = [(Current Value of Investment – Original Cost of Investment) / Original Cost of Investment] × 100
A positive ROI indicates a gain, while a negative ROI signifies a loss. This percentage allows investors to compare the efficiency of different investments. - Compound Interest/Growth Rate: Often called “interest on interest,” compound interest significantly accelerates wealth accumulation. While the direct calculation involves exponents, understanding the percentage growth rate per period is crucial. For example, an investment growing at 7% annually will double approximately every 10 years (using the Rule of 72: 72 / interest rate = years to double).
- Annualized Returns: This percentage normalizes investment returns over different time frames, allowing for fair comparison of performance over different periods (e.g., comparing a 6-month return to a 3-year return).
Portfolio Allocation and Risk Management
Percentages are central to designing a diversified investment portfolio that aligns with your risk tolerance and financial goals.
- Asset Allocation: This refers to dividing your investment portfolio among different asset categories, such as stocks, bonds, and cash. It’s typically expressed in percentages (e.g., 60% stocks, 30% bonds, 10% cash). Rebalancing your portfolio means adjusting these percentages back to your target allocation.
- Risk Exposure: While complex, many risk metrics are derived from percentages, indicating the potential percentage loss or volatility of an investment.
Analyzing Market Performance and Benchmarking
Investors use percentages to gauge how their investments are performing against relevant market benchmarks.
- Index Performance: Stock market indices like the S&P 500 or Dow Jones Industrial Average are often quoted in terms of percentage gains or losses over a day, month, or year. This allows investors to quickly understand the overall market sentiment.
- Relative Performance: By comparing the percentage return of your portfolio to the percentage return of a benchmark index, you can determine if your investments are outperforming or underperforming the broader market.
Percentages in Business Finance and Entrepreneurial Success
For businesses, percentages are vital for operational analysis, strategic planning, and communicating financial health to stakeholders.
Assessing Profitability: Gross and Net Profit Margins
These are fundamental profitability metrics that show how efficiently a business is turning revenue into profit.
- Gross Profit Margin: This indicates the percentage of revenue left after deducting the cost of goods sold (COGS).
Gross Profit Margin = [(Revenue – COGS) / Revenue] × 100
A higher gross margin suggests good control over production costs. - Net Profit Margin: This is the ultimate measure of profitability, showing the percentage of revenue remaining after all expenses (COGS, operating expenses, interest, and taxes) have been deducted.
Net Profit Margin = (Net Profit / Revenue) × 100
It reveals how much profit a company makes from every dollar of sales.
Understanding Growth: Revenue Growth Rates and Market Share
Businesses constantly track growth, and percentages are the primary way to do so.
- Revenue Growth Rate: This measures the percentage increase in a company’s revenue over a specific period (e.g., quarter-over-quarter, year-over-year).
Revenue Growth Rate = [(Current Period Revenue – Prior Period Revenue) / Prior Period Revenue] × 100
It’s a key indicator of a company’s expansion and market acceptance. - Market Share: This represents the percentage of total sales within an industry that a particular company holds.
Market Share = (Company’s Sales / Total Industry Sales) × 100
A growing market share indicates increasing competitive advantage.
Operational Efficiency: Expense Ratios and Cost Analysis
Controlling costs is crucial for business success, and percentages help identify inefficiencies.
- Operating Expense Ratio: This calculates operating expenses as a percentage of revenue, showing how efficiently a company manages its overheads.
- Contribution Margin Percentage: For specific products or services, this shows the percentage of sales revenue that contributes to covering fixed costs and generating profit after variable costs are accounted for.
- Break-Even Point (in Percentage Terms): While the break-even point is typically expressed in units or sales dollars, understanding the percentage of sales needed to cover all costs provides a clear target for sales teams.
Practical Tools and Best Practices for Accurate Percentage Calculations
While the basic formula for percentages is straightforward, using the right tools and adopting best practices ensures accuracy and efficiency in financial calculations.
Harnessing Spreadsheets for Financial Modeling and Tracking
Spreadsheet software like Microsoft Excel or Google Sheets are indispensable for financial calculations involving percentages. They allow for dynamic modeling, easy tracking of multiple variables, and automated calculations.
- Formulas: You can directly input percentage formulas. For example, to calculate 20% of a value in cell A1, you’d use
=A1*0.20or=A1*20%. To find the percentage of a part (B1) out of a whole (A1), you’d use=(B1/A1)*100or simply=(B1/A1)and format the cell as a percentage. - Data Visualization: Spreadsheets enable you to create charts and graphs (e.g., pie charts for budget allocation, line graphs for growth rates) that visually represent percentages, making complex data easily digestible.
- Scenario Planning: You can easily adjust variables (e.g., interest rates, growth assumptions) to see how different percentage outcomes impact your financial projections.
Utilizing Online Calculators and Financial Software
For quick, one-off calculations or more complex financial scenarios, a plethora of online calculators and specialized financial software are available.
- Basic Percentage Calculators: Many websites offer simple tools for calculating percentages, discounts, or tax.
- Loan and Mortgage Calculators: These tools often show the percentage breakdown of principal and interest in each payment, as well as the total interest paid as a percentage of the loan amount.
- Investment Calculators: Compound interest calculators, ROI calculators, and retirement planners often rely heavily on percentage inputs and outputs, helping you visualize long-term financial growth.
- Budgeting Apps: Many personal finance apps automatically categorize expenses and display them as percentages of your income, simplifying budget analysis.
Avoiding Common Pitfalls and Ensuring Accuracy
Even with simple percentage calculations, mistakes can happen.
- Incorrect Base Value: Always double-check that you are dividing by the correct “whole” or base value. A common error is calculating a percentage change based on the wrong starting point.
- Order of Operations: When dealing with multiple steps (e.g., discount then tax), ensure you apply them in the correct sequence.
- Percentage Points vs. Percent Change: Understand the difference. If an interest rate goes from 4% to 5%, that’s an increase of 1 percentage point, but a 25% percentage change (1/4 = 0.25).
- Rounding Errors: Be mindful of rounding, especially in large-scale financial models, as small errors can compound.
- Context is King: A percentage alone can be misleading. Always consider the absolute numbers and the underlying context. A 100% growth on $100 is different from 100% growth on $1 million.
In conclusion, understanding “how to get the percentage” is more than just a mathematical formula; it’s a fundamental financial literacy skill. From managing personal budgets and investments to driving business profitability and growth, percentages provide the critical framework for analysis, comparison, and informed decision-making. By mastering these calculations and utilizing the right tools, you can unlock deeper financial insights and empower yourself to achieve your monetary goals.
aViewFromTheCave is a participant in the Amazon Services LLC Associates Program, an affiliate advertising program designed to provide a means for sites to earn advertising fees by advertising and linking to Amazon.com. Amazon, the Amazon logo, AmazonSupply, and the AmazonSupply logo are trademarks of Amazon.com, Inc. or its affiliates. As an Amazon Associate we earn affiliate commissions from qualifying purchases.