
In the intricate world of finance, percentages are not just mathematical constructs; they are the universal language that underpins every decision, every forecast, and every analysis. From the personal budget you meticulously craft each month to the sprawling financial statements of multinational corporations, understanding “how to get percentages” is an indispensable skill. It empowers you to decode interest rates, evaluate investment returns, analyze discounts, comprehend tax burdens, and generally navigate the economic landscape with clarity and confidence. This guide will equip you with the fundamental knowledge and practical applications of percentages, strictly within the realm of money, ensuring you become a more astute financial navigator.

The Ubiquity of Percentages in Finance
Percentages permeate every facet of our financial lives, often unnoticed until a critical decision looms. They provide a standardized way to compare parts to a whole, or to express change, making complex financial information digestible and comparable across different contexts. Without a firm grasp of percentages, interpreting financial news, making sound investment choices, or even understanding your credit card statement becomes a significant challenge.
Understanding the Basics: What is a Percentage?
At its core, a percentage is simply a way of expressing a number as a fraction of 100. The word “percent” literally means “per hundred.” So, 50% means 50 out of 100, or 50/100, which simplifies to 1/2. This standardized representation allows us to compare proportions easily. For instance, knowing that your housing costs represent 30% of your income is more informative than just saying they are $1,500, because 30% tells you their relative impact regardless of your total income.
Why Percentages Matter for Your Money
In finance, percentages are critical for several reasons:
- Comparison: They allow for easy comparison of different financial figures, even if the absolute numbers are vastly different. Comparing the growth rate of two investments, for example, is best done using percentage change.
- Standardization: They normalize data, making it easier to understand relative proportions. A 2% interest rate is readily understood, regardless of the loan amount.
- Decision Making: They directly influence financial decisions. Should you take a loan with an 8% APR or a 6% APR? Is a stock with a 15% annual return better than one with 10%? Percentages provide the metrics for these choices.
- Clarity and Communication: Financial reports, economic indicators, and market analyses frequently use percentages to convey information concisely and effectively.
Mastering percentages means mastering a fundamental aspect of financial literacy, paving the way for more informed and strategic monetary decisions.
Core Calculations: Mastering the Fundamentals
Before diving into complex financial scenarios, it’s essential to solidify your understanding of the core percentage calculations. These foundational methods are the building blocks for almost every financial analysis you’ll undertake.
Calculating a Percentage of a Whole (e.g., Sales Tax, Discounts)
This is perhaps the most common percentage calculation you’ll encounter daily. It involves finding a specific portion of a given total.
Formula: Percentage of Whole = (Percentage / 100) * Whole Value
Example: Discounts on Purchases
Imagine you’re buying a new appliance priced at $500, and it’s on sale for 20% off. To find the discount amount:
Discount Amount = (20 / 100) * $500 = 0.20 * $500 = $100
So, the discount is $100, making the final price $500 – $100 = $400.
Example: Sales Tax
If the appliance costs $400 after the discount, and the sales tax is 7%, to find the sales tax amount:
Sales Tax Amount = (7 / 100) * $400 = 0.07 * $400 = $28
Your total payment would be $400 + $28 = $428.
Determining Percentage Increase or Decrease (e.g., Investment Growth, Inflation)
This calculation measures the relative change between two values, often used to track growth, decline, or inflation over time.
Formula: Percentage Change = ((New Value - Old Value) / Old Value) * 100
Example: Stock Returns
Suppose you invested $1,000 in a stock, and a year later, its value grew to $1,150.
Percentage Increase = (($1,150 - $1,000) / $1,000) * 100 = ($150 / $1,000) * 100 = 0.15 * 100 = 15%
Your investment saw a 15% return.
Example: Inflation Rates
If the cost of a basket of goods was $200 last year and $206 this year, the inflation rate is:
Inflation Rate = (($206 - $200) / $200) * 100 = ($6 / $200) * 100 = 0.03 * 100 = 3%
This indicates that prices, on average, increased by 3%.
Finding the Original Value (Reverse Percentages)
Sometimes, you know the final value after a percentage change and need to work backward to find the original value. This is particularly useful when dealing with items priced after discounts or including tax.
Formula (after increase): Original Value = Final Value / (1 + (Percentage Increase / 100))
Formula (after decrease): Original Value = Final Value / (1 - (Percentage Decrease / 100))
Example: Calculating Original Price Before Tax
You bought an item for $107, including 7% sales tax. To find the original price before tax:
Original Price = $107 / (1 + (7 / 100)) = $107 / (1 + 0.07) = $107 / 1.07 = $100
The original price before tax was $100.
Example: Item Priced After Discount
An item is on sale for $80 after a 20% discount. What was its original price?
Original Price = $80 / (1 - (20 / 100)) = $80 / (1 - 0.20) = $80 / 0.80 = $100
The original price before the discount was $100.
Practical Applications in Personal Finance and Investing
The ability to calculate percentages translates directly into powerful insights for managing your personal finances and making savvy investment decisions.
Budgeting and Expense Analysis
Percentages are invaluable tools for creating and sticking to a budget. They allow you to allocate your income proportionally and quickly identify areas where you might be overspending.
Example: The 50/30/20 Rule
A popular budgeting guideline suggests allocating 50% of your after-tax income to needs, 30% to wants, and 20% to savings and debt repayment. If your monthly take-home pay is $4,000:
- Needs: 50% of $4,000 = $2,000
- Wants: 30% of $4,000 = $1,200
- Savings/Debt: 20% of $4,000 = $800
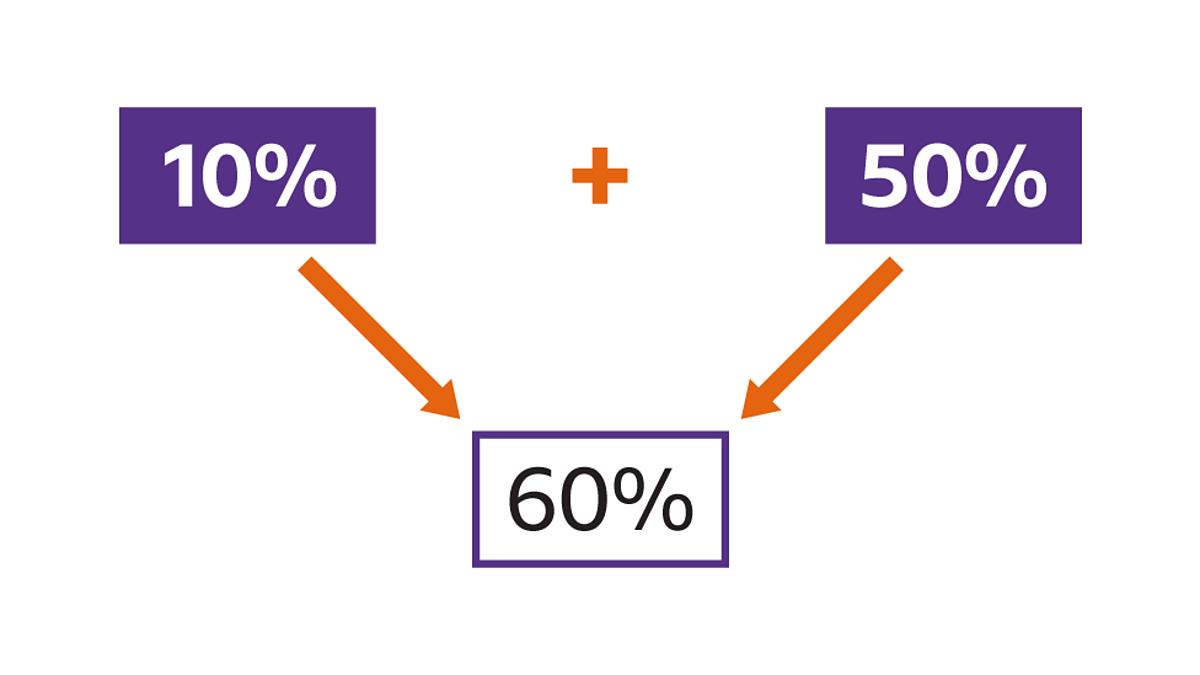
By calculating these percentages, you can quickly assess if your current spending aligns with your financial goals and make adjustments as needed.
Evaluating Investment Returns
When evaluating investments, percentages are the standard metric for comparing performance across different assets, timeframes, and investment vehicles.
Example: Annualized Returns
If an investment grew from $10,000 to $12,000 over two years, its total percentage gain is 20%. To annualize this (assuming simple annual growth for simplicity):
Annual Growth = ((Ending Value / Beginning Value)^(1/Number of Years) - 1) * 100
Annual Growth = (($12,000 / $10,000)^(1/2) - 1) * 100 = ((1.2)^(0.5) - 1) * 100 = (1.0954 - 1) * 100 = 9.54%
This means the investment grew by approximately 9.54% per year on average. Understanding metrics like Compound Annual Growth Rate (CAGR) relies heavily on these principles.
Decoding Loan and Interest Rates
Interest rates, expressed as percentages, are fundamental to understanding the cost of borrowing and the returns on savings.
Example: Annual Percentage Rate (APR)
Your credit card might have an APR of 18%. This means for every $100 you borrow over a year, you’ll pay $18 in interest (assuming no payments). If you carry an average balance of $500:
Annual Interest = (18 / 100) * $500 = 0.18 * $500 = $90
This helps you understand the true cost of carrying a balance.
Understanding Inflation’s Impact
Inflation, measured as a percentage, directly impacts your purchasing power. A 3% inflation rate means that what $100 could buy last year now costs $103. This insight is crucial for financial planning, especially retirement planning, as it highlights the need for investments to outpace inflation to maintain wealth.
Business Finance: Leveraging Percentages for Growth
In the corporate world, percentages are the language of performance, efficiency, and profitability. Businesses use them extensively to analyze operations, set strategies, and communicate financial health to stakeholders.
Analyzing Profit Margins and Revenue Growth
Profit margins are vital indicators of a company’s efficiency and profitability, always expressed as a percentage.
Example: Gross Profit Margin
Gross Profit Margin = ((Revenue - Cost of Goods Sold) / Revenue) * 100
If a company has $1,000,000 in revenue and $600,000 in Cost of Goods Sold:
Gross Profit Margin = (($1,000,000 - $600,000) / $1,000,000) * 100 = ($400,000 / $1,000,000) * 100 = 40%
This indicates that 40 cents of every dollar of revenue remains after covering the direct costs of producing goods.
Example: Net Profit Margin
Net Profit Margin = (Net Income / Revenue) * 100
If the same company has a Net Income of $150,000:
Net Profit Margin = ($150,000 / $1,000,000) * 100 = 15%
This shows how much profit is left after all expenses, including taxes, are accounted for.
Revenue Growth is typically measured as a percentage increase year-over-year, indicating how fast a business is expanding.
Assessing Financial Ratios
Many critical financial ratios that assess liquidity, solvency, efficiency, and profitability are often presented as percentages or are directly derived from percentage calculations. While some, like the Current Ratio, are expressed as a factor (e.g., 2:1), their components are often analyzed in percentage terms. For instance, understanding the percentage breakdown of assets or liabilities can offer profound insights into a company’s financial structure.
Strategic Pricing and Discounting
Businesses use percentages extensively in pricing strategies. Markups are a percentage added to the cost to determine the selling price, while markdowns are percentage reductions.
Example: Markup Percentage
If a product costs a retailer $50 to acquire, and they want a 60% markup:
Markup Amount = 60% of $50 = 0.60 * $50 = $30
Selling Price = $50 + $30 = $80
Understanding these calculations is critical for setting competitive prices and managing profit expectations.
Avoiding Common Pitfalls and Enhancing Accuracy
While percentages are powerful, they can also be misleading if not interpreted carefully. Awareness of common pitfalls and best practices for accuracy is crucial.
The Importance of the Base Value
Always be clear about what the percentage is “of.” A “2% increase” sounds small, but if it’s 2% of a multi-billion-dollar economy, it represents a substantial sum. Conversely, a 50% increase in a very small number might still be numerically insignificant. Misinterpreting the base value is a frequent source of financial confusion.
Distinguishing Between Percentage Points and Percentage Change
This is a critical distinction, especially in discussions about interest rates or economic data.
- Percentage Change refers to the relative increase or decrease in a value (as discussed earlier).
- Percentage Points refer to the absolute difference between two percentages.
Example: If an interest rate increases from 5% to 7%, it’s an increase of “2 percentage points.” However, the percentage change in the interest rate itself is ((7 - 5) / 5) * 100 = (2 / 5) * 100 = 40%. Saying the interest rate increased by “40%” sounds much more dramatic than “2 percentage points,” but both are technically correct depending on what you’re measuring. Always clarify which is being used.

Utilizing Financial Tools for Complex Calculations
While mental math and basic calculators are sufficient for simple percentage tasks, spreadsheets (like Excel or Google Sheets) and specialized financial calculators become indispensable for more complex financial modeling, especially when dealing with compound interest, annuities, or large datasets. Learning basic spreadsheet functions for percentages can significantly enhance your financial analysis capabilities, improving both speed and accuracy.
In conclusion, understanding “how to get percentages” is far more than a basic arithmetic skill; it’s a foundational element of financial literacy. By mastering these calculations and their diverse applications across personal and business finance, you gain an invaluable tool for making informed decisions, managing your money effectively, and confidently navigating the economic currents that shape our world. Embrace the power of percentages, and transform your financial outlook.
aViewFromTheCave is a participant in the Amazon Services LLC Associates Program, an affiliate advertising program designed to provide a means for sites to earn advertising fees by advertising and linking to Amazon.com. Amazon, the Amazon logo, AmazonSupply, and the AmazonSupply logo are trademarks of Amazon.com, Inc. or its affiliates. As an Amazon Associate we earn affiliate commissions from qualifying purchases.