In the realms of personal finance, investment management, and corporate strategy, the ability to accurately measure progress is the cornerstone of informed decision-making. Whether you are tracking the performance of a burgeoning stock portfolio, evaluating the health of a startup, or managing a household budget, understanding “how to find the percentage of growth” is a fundamental skill. Growth is not merely a sign of success; it is a metric that provides context, identifies trends, and dictates future allocations of capital.
This guide explores the mathematical foundations of growth calculations, their diverse applications across financial sectors, and the nuanced ways in which these figures should be interpreted to ensure long-term wealth preservation and business scalability.

The Fundamentals of Calculating Growth
Before diving into complex financial models, one must master the core arithmetic that governs growth. In its simplest form, the percentage of growth measures the change in value over a specific period relative to the starting point.
The Basic Growth Formula
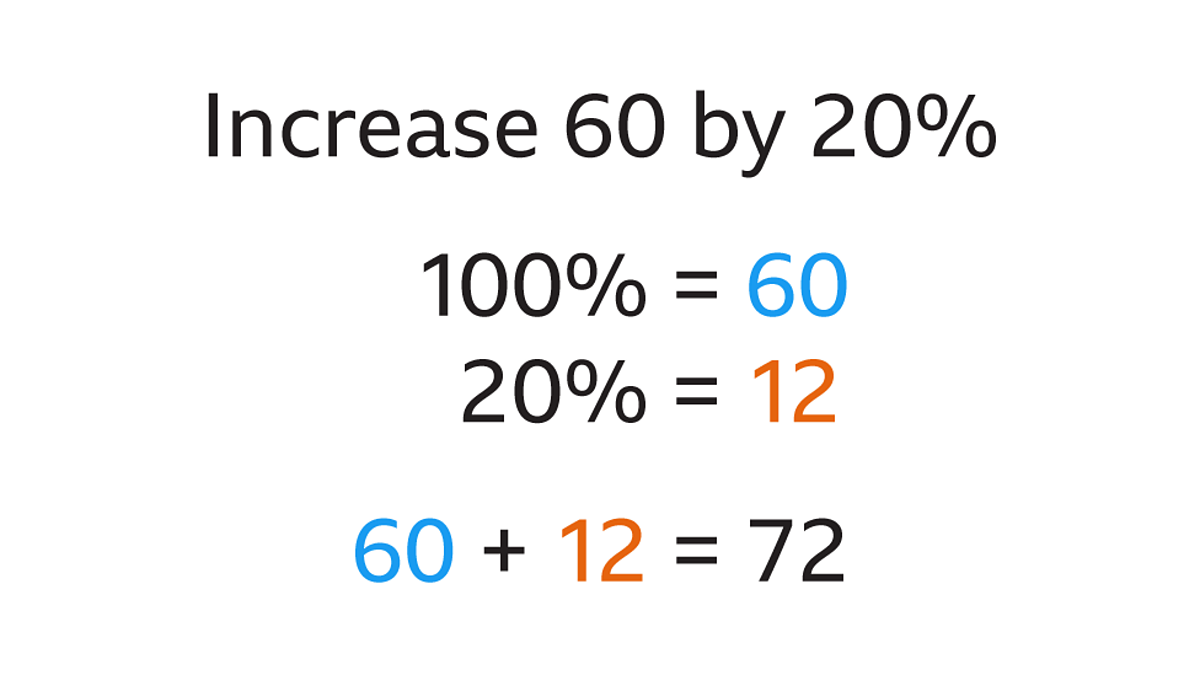
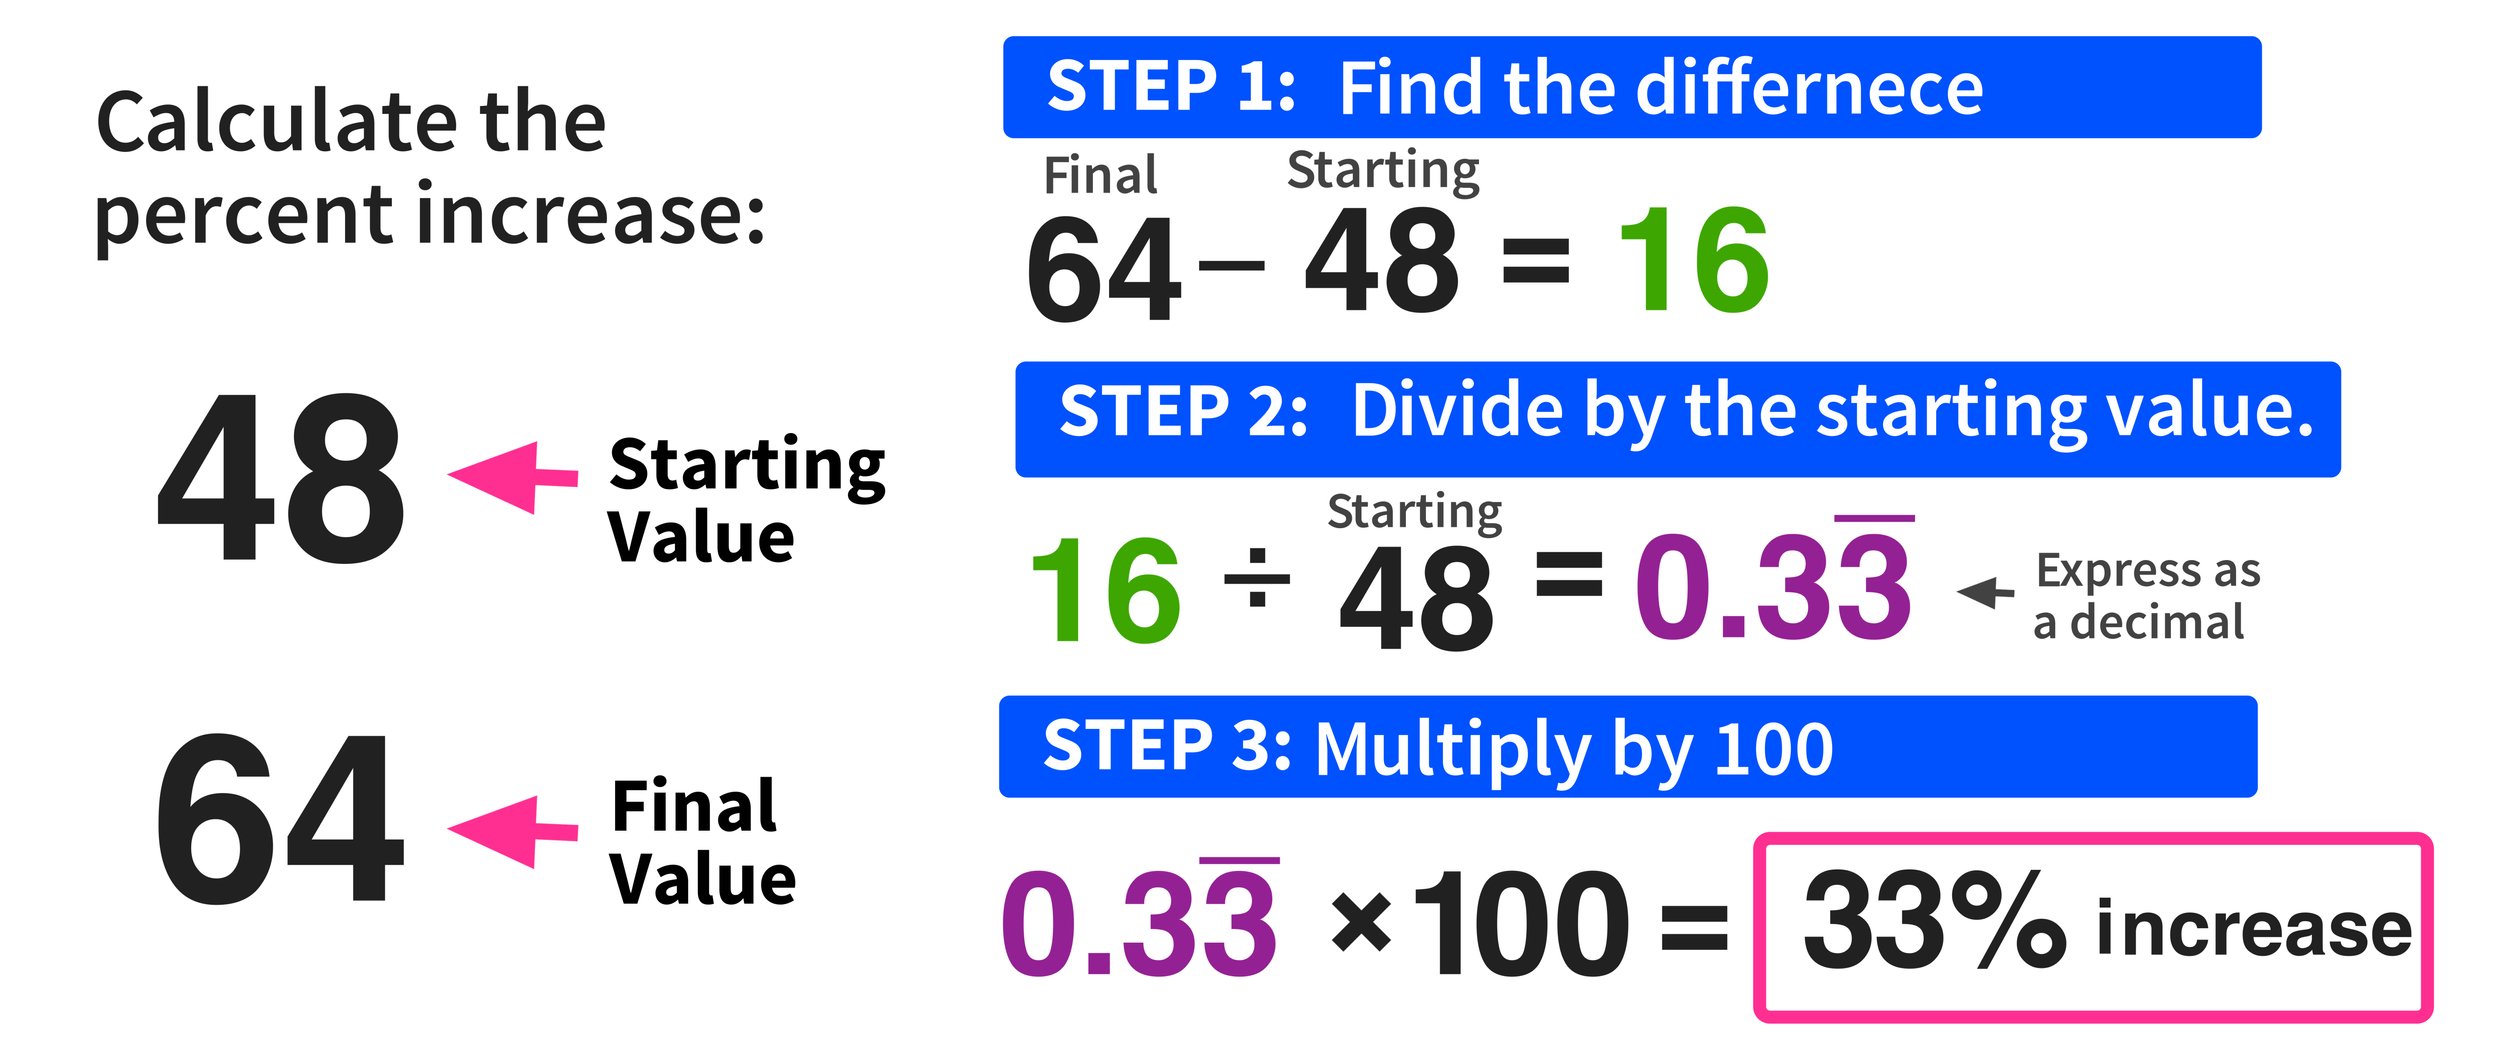
The standard formula for calculating growth is universal:
((Current Value – Original Value) / Original Value) x 100.
To apply this, you subtract the initial value from the final value to determine the absolute change. You then divide that change by the initial value to find the decimal growth rate. Finally, multiplying by 100 converts that decimal into a percentage. For example, if a small business earned $100,000 in revenue last year and $125,000 this year, the calculation would be ($125,000 – $100,000) / $100,000, resulting in a 25% growth rate.
Understanding the Significance of Baseline Figures
The baseline—or the “original value”—is the most critical component of the formula. In financial analysis, the choice of a baseline can significantly alter the perception of performance. Using an exceptionally low baseline (such as a “trough” year during an economic downturn) can make subsequent growth appear inflated. Conversely, a high baseline (a “peak” year) can make steady progress look like a decline. Professionals must ensure that the baseline selected is representative of typical performance to avoid the “base effect” fallacy, where small absolute changes appear as massive percentage swings simply because the starting number was low.
Applying Growth Calculations to Personal Finance and Investing
For the individual investor, percentage growth is the primary metric used to evaluate the efficiency of an investment. Unlike absolute dollar gains, percentages allow for an “apples-to-apples” comparison between different asset classes, such as real estate, equities, and fixed-income bonds.
Measuring Portfolio ROI
Return on Investment (ROI) is the most common application of the growth formula in personal finance. It calculates the percentage increase of an investment’s value inclusive of dividends or interest. However, simple growth calculations can be misleading when investments are held over different time horizons. If Investment A grows 50% over ten years and Investment B grows 20% over two years, Investment B is arguably the superior performer on an annualized basis. This necessitates a more sophisticated look at growth.
Compound Annual Growth Rate (CAGR)
The Compound Annual Growth Rate (CAGR) is a vital tool for long-term investors because it provides a smoothed annual rate of return. Unlike simple growth, which only looks at the start and end points, CAGR accounts for the effect of compounding over time. The formula is:
[(Ending Value / Beginning Value)^(1 / Number of Years)] – 1.
CAGR is particularly useful for comparing the performance of volatile assets. It tells you what the annual return would have been if the investment had grown at a steady rate each year. For anyone serious about retirement planning or wealth building, CAGR is the gold standard for measuring the “true” growth of a portfolio.
The Impact of Inflation on Real Growth
A common mistake in financial tracking is ignoring the “Real” vs. “Nominal” growth rate. Nominal growth is the percentage increase in the dollar amount. Real growth is that figure adjusted for inflation. If your savings account offers a 4% growth rate but inflation is running at 5%, your “real” growth is actually -1%. To find the percentage of real growth, you must subtract the inflation rate from your nominal growth rate. This distinction is vital for preserving purchasing power over decades.
Analyzing Business Growth and Revenue Performance
In the corporate world, growth is the engine of valuation. Investors and stakeholders look at growth percentages to determine if a company is capturing market share or if its business model is sustainable.
Year-over-Year (YoY) vs. Month-over-Month (MoM)
Business finance relies heavily on comparative timeframes. Year-over-Year (YoY) growth compares a specific period with the same period from the previous year. This is essential for businesses with seasonal fluctuations, such as retail or tourism. A toy store might see a 500% growth in revenue from November to December (MoM), but that doesn’t necessarily mean the business is thriving; it might actually be down 10% compared to the previous December (YoY).
Month-over-Month (MoM) growth, while more volatile, is used by early-stage startups and high-growth companies to track short-term momentum and the immediate impact of new marketing strategies or product launches.
Profit Margin vs. Revenue Growth
It is a dangerous financial trap to focus solely on revenue growth while ignoring profit margins. “Growth at all costs” can lead to a scenario where a company’s expenses outpace its income. To find the percentage of growth in profitability, one must apply the growth formula to Net Income or EBTIDA (Earnings Before Interest, Taxes, Depreciation, and Amortization). High revenue growth paired with declining profit margins suggests inefficiency or an unsustainable “burning” of cash to acquire customers.
Advanced Tools and Models for Forecasting Growth
Tracking historical growth is descriptive, but forecasting future growth is predictive and serves as the basis for financial modeling and budgeting.
Financial Modeling in Excel and Beyond
Modern financial analysts use spreadsheet software and specialized financial tools to automate growth calculations. By utilizing the “Growth” function or simple formulas in Excel, businesses can create “pro forma” financial statements. These models allow users to input various growth assumptions (conservative, moderate, and aggressive) to see how they will impact cash flow and liquidity in the future.
The Rule of 72
For a quick mental calculation of growth, the “Rule of 72” is an indispensable tool for investors. By dividing 72 by your annual growth rate, you can estimate how many years it will take for your initial investment to double. For example, an investment growing at 6% annually will double in approximately 12 years (72 / 6 = 12). This provides a tangible perspective on how small differences in growth percentages can lead to massive disparities in wealth over time.
Sensitivity Analysis in Growth Projections
Sophisticated financial planning involves sensitivity analysis—examining how changes in one variable (like a 1% increase in interest rates or a 2% drop in sales growth) affect the overall financial health of a project. By calculating growth under different scenarios, investors can perform “stress tests” on their portfolios to ensure they can survive market volatility.
Interpreting the Data: When Growth Percentages Tell a Deeper Story
While the math behind finding the percentage of growth is objective, the interpretation is subjective. A high growth percentage is not always a positive sign, and a low percentage is not always a failure.
Contextualizing High Percentages
High growth rates are common in the early stages of a business or an investment’s life cycle. However, as an entity grows larger, maintaining those same percentages becomes mathematically impossible—a phenomenon known as the “Law of Large Numbers.” A company with $1 million in revenue can easily achieve 100% growth to reach $2 million. A company with $100 billion in revenue (like Apple or Amazon) would find it nearly impossible to grow 100% in a single year. Investors must adjust their expectations based on the size and maturity of the asset.
The Pitfalls of Linear Thinking
Human psychology often falls into the trap of linear projection—assuming that because an asset grew by 10% last year, it will grow by 10% every year moving forward. In the world of money, growth is rarely linear; it is cyclical and subject to external shocks. Understanding how to find the percentage of growth should always be paired with an understanding of market cycles.
In conclusion, mastering growth calculations is more than a mathematical exercise; it is a vital component of financial literacy. By understanding how to calculate simple growth, CAGR, and real returns, and by learning how to apply these metrics to both personal portfolios and business ventures, you gain the clarity needed to navigate the complex world of finance. Growth is the pulse of the economy, and knowing how to measure it ensures that you remain in control of your financial destiny.
aViewFromTheCave is a participant in the Amazon Services LLC Associates Program, an affiliate advertising program designed to provide a means for sites to earn advertising fees by advertising and linking to Amazon.com. Amazon, the Amazon logo, AmazonSupply, and the AmazonSupply logo are trademarks of Amazon.com, Inc. or its affiliates. As an Amazon Associate we earn affiliate commissions from qualifying purchases.