In the world of finance, numbers are the raw data, but percentages are the narrative. Whether you are tracking the growth of a retirement portfolio, analyzing the quarterly revenue of a startup, or comparing the interest rates of two different high-yield savings accounts, the ability to calculate the percentage difference is a fundamental skill. It transforms abstract figures into actionable insights, allowing investors and business owners to measure performance, volatility, and value with precision.
Understanding how to find the percentage difference between two numbers is more than just a mathematical exercise; it is a prerequisite for financial literacy. In this guide, we will explore the core formulas, the strategic importance of these calculations in wealth management, and how to apply them to optimize your financial trajectory.

The Fundamental Formula: Why Percentage Difference Matters in Finance
In financial analysis, we often need to compare two distinct values to understand their relationship. However, it is vital to distinguish between “percentage difference” and “percentage change,” as they serve different analytical purposes. Percentage change is used when there is an “old” value and a “new” value (like a stock price over time), whereas percentage difference is typically used to compare two independent values that represent the same category (like comparing the fees of two different mutual funds).
The Core Calculation Method
The mathematical formula for the percentage difference between two numbers is designed to show the relationship between two values relative to their average. This ensures that the direction of the comparison doesn’t unfairly skew the result. The formula is as follows:
Percentage Difference = (|Value A – Value B| / [(Value A + Value B) / 2]) × 100
To break this down for financial application:
- Subtract the two financial figures to find the absolute difference.
- Add the two figures together and divide by two to find their average.
- Divide the absolute difference by the average.
- Multiply by 100 to convert the decimal into a percentage.
For example, if you are comparing two investment properties—one with a projected annual return of $12,000 and another with $15,000—the percentage difference helps you understand the gap in their earning potential relative to their scale.
Percentage Change vs. Percentage Difference: Knowing the Nuance
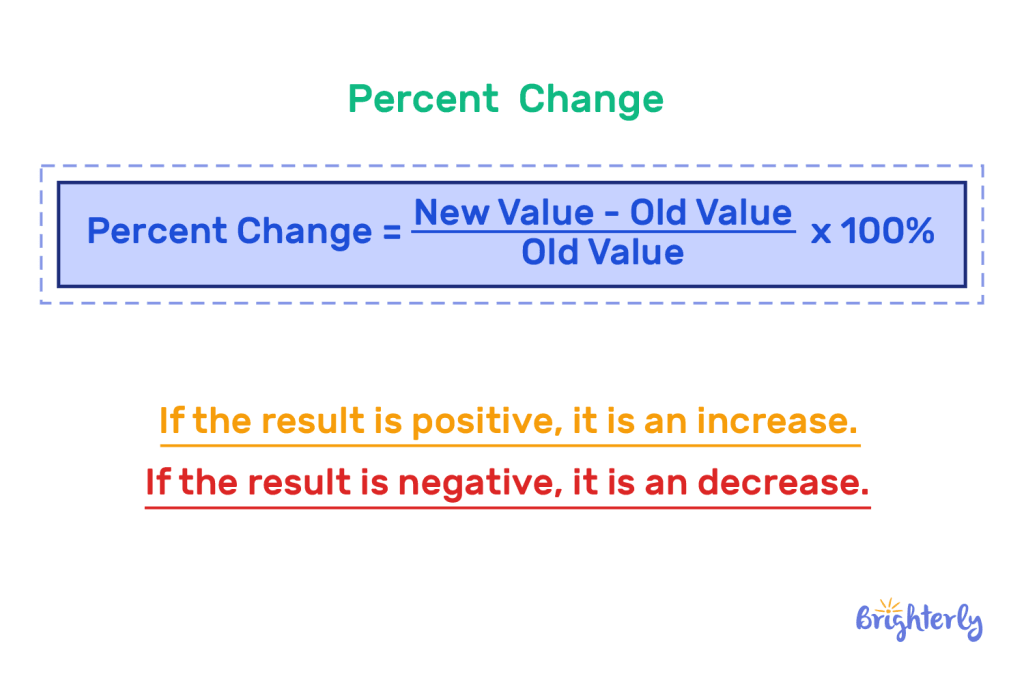
In personal finance, “percentage change” is often the more frequently used metric. It measures the growth or decline of a single asset over time. The formula for percentage change is: [(New Value – Old Value) / Old Value] × 100.
If your brokerage account was worth $100,000 last year and is worth $115,000 today, that is a 15% increase. Knowing when to use each formula is key to professional financial reporting. Use percentage change for growth tracking and percentage difference for comparative analysis between two static options.
Measuring Investment Performance and Portfolio Growth
For the modern investor, percentages are the ultimate equalizer. They allow you to compare a $1,000 investment in a tech stock against a $100,000 investment in a real estate syndicate. By focusing on the percentage difference in returns rather than the dollar amount, you can determine which asset is working harder for your capital.
Tracking Year-over-Year (YoY) Growth
Wealth is rarely built overnight; it is the result of consistent, incremental growth. Financial professionals use Year-over-Year (YoY) analysis to strip away seasonal volatility and look at the core health of an investment. By calculating the percentage difference between your total net worth on December 31st of last year versus December 31st of this year, you gain a clear picture of your financial momentum.
A positive percentage change indicates that your savings, investments, and debt reduction strategies are working. Conversely, a negative change serves as an early warning system, prompting a review of your asset allocation or spending habits.
Evaluating Asset Volatility and Rebalancing
Risk management is the cornerstone of sustainable investing. When comparing two different exchange-traded funds (ETFs), an investor might look at the percentage difference in their standard deviation or maximum drawdown. If Fund A has a 12% volatility rate and Fund B has a 15% rate, the percentage difference helps you quantify the additional risk you are taking on for a potentially higher return.
Furthermore, percentage calculations are essential for “rebalancing.” If your target allocation is 60% stocks and 40% bonds, but a market rally pushes your stocks to 70%, you must calculate the percentage difference from your target to determine how much capital to move to maintain your risk profile.
Business Finance: Analyzing Profit Margins and Cost Efficiency
For business owners and corporate finance professionals, the percentage difference is a tool for survival. It is used to monitor the “spread” between various financial metrics, such as the cost of goods sold (COGS) and the final sale price.
Comparing Actual vs. Budgeted Expenses
One of the most critical applications of this math in business is variance analysis. At the end of a fiscal quarter, a business must compare its actual spending against its initial budget.
If the marketing department was budgeted $50,000 but spent $58,000, the percentage difference (or variance) is roughly 14.8%. In a professional setting, any variance over a certain threshold (often 5% or 10%) triggers a “deep dive” to identify inefficiencies. This disciplined approach to numerical differences ensures that a company remains profitable and avoids “budget creep.”
Revenue Growth Analysis for Scaling Operations
When a company seeks venture capital or a bank loan, lenders look at the percentage difference in revenue between periods. A business that grows from $1 million to $1.2 million has a 20% growth rate. However, if the industry average growth rate is 30%, that 10-percentage-point gap (the difference between the two growth rates) indicates that the company is losing market share. Professional financial analysts use these percentages to benchmark a company’s performance against its competitors, providing a macro view of the business’s health.
Personal Finance Applications: Beating Inflation and Increasing Net Worth
On a personal level, understanding these calculations can save you thousands of dollars over a lifetime. From mortgage rates to grocery bills, the “hidden” percentages dictate your purchasing power.
Calculating Real Returns in an Inflationary Environment
One of the most overlooked concepts in money management is the “real rate of return.” This is the percentage difference between your investment gains and the inflation rate. If your savings account offers a 4% interest rate, but inflation is running at 5%, the percentage difference reveals a harsh reality: your “real” wealth is actually shrinking by approximately 1%.
By mastering the math of percentage differences, you can better evaluate whether an investment is truly preserving your wealth or simply giving you the illusion of growth. This insight often leads savvy investors to pivot toward assets like Treasury Inflation-Protected Securities (TIPS) or equity markets that historically outpace inflation.
Monitoring Savings Rate Increases
Your savings rate—the percentage of your take-home pay that you keep—is perhaps the most important number in personal finance. If you receive a 5% raise at work, many people succumb to “lifestyle inflation” and increase their spending by 5%.
However, if you keep your spending static and move that entire 5% raise into your 401(k), the percentage difference in your long-term wealth accumulation can be staggering. Using these formulas to calculate the “future value” of small percentage shifts allows you to see the power of compounding interest in action.
Digital Tools for Financial Calculations
While manual calculation is a great way to understand the logic, the modern financial landscape moves too quickly for pen and paper. Utilizing technology ensures accuracy and allows for complex modeling.
Using Spreadsheets for Automated Analysis
Microsoft Excel and Google Sheets are the industry standards for financial modeling. To find the percentage difference between two cells (A1 and B1), you can use a formula like =ABS(A1-B1)/((A1+B1)/2). For percentage change, you would use =(B1-A1)/A1.
Automating these calculations in a monthly budget or an investment tracker allows you to visualize trends through charts and graphs. Seeing a visual representation of the percentage difference in your monthly expenses can highlight “spending leaks” that might go unnoticed in a simple list of transactions.
The Role of Financial Calculators in Long-term Planning
For more complex scenarios—such as comparing the percentage difference in total interest paid between a 15-year and a 30-year mortgage—specialized financial calculators are invaluable. These tools take the manual math out of the equation and allow you to focus on the strategy.
By inputting different interest rate percentages, you can see how a seemingly small 0.5% difference in a loan rate can result in tens of thousands of dollars in savings over the life of the loan. This realization often empowers individuals to negotiate more aggressively or wait for better market conditions before making major financial commitments.

Conclusion: The Strategic Advantage of Numerical Literacy
In the final analysis, finding the percentage difference between two numbers is not just about the result; it is about the perspective it provides. In the realm of money—whether personal, corporate, or institutional—percentages provide a universal language for value, risk, and growth.
By mastering these calculations, you move beyond being a passive observer of your bank statements. You become an active analyst of your financial life, capable of identifying trends, spotting inefficiencies, and making data-driven decisions that lead to long-term prosperity. Whether you are comparing two stocks, two job offers, or two different ways to pay down debt, the percentage difference is your most reliable guide to choosing the path of greatest financial advantage.
aViewFromTheCave is a participant in the Amazon Services LLC Associates Program, an affiliate advertising program designed to provide a means for sites to earn advertising fees by advertising and linking to Amazon.com. Amazon, the Amazon logo, AmazonSupply, and the AmazonSupply logo are trademarks of Amazon.com, Inc. or its affiliates. As an Amazon Associate we earn affiliate commissions from qualifying purchases.