
In the dynamic world of personal finance, investing, and business operations, understanding the magnitude of change is paramount. Whether you’re tracking the growth of your investment portfolio, analyzing a company’s sales figures, or managing a household budget, the ability to accurately calculate percent increase or decrease provides invaluable insight. It transforms raw numbers into actionable intelligence, revealing trends, highlighting performance, and informing critical decisions. This guide will demystify the process, offering a clear, step-by-step approach to mastering this fundamental financial calculation.
The Foundation of Financial Change: Understanding Percentages
At its core, percent change is a measure of the relative difference between an old (or original) value and a new value, expressed as a percentage of the old value. It’s a universal language in finance, allowing for apples-to-apples comparisons across different scales and timeframes. Without it, simply knowing that a stock price went up by $10 means little without context. Did it go from $10 to $20 (a 100% increase) or from $1000 to $1010 (a 1% increase)? The percentage tells the real story.

Why Percentage Change Matters in Money Matters
For individuals, percentage change is crucial for understanding the true impact of financial events. A 5% increase in grocery prices hits different than a 5% increase in your savings interest rate. Investors rely on it to gauge the performance of their assets, comparing returns against benchmarks or inflation. Business owners use it to evaluate revenue growth, cost control, and profit margins, making strategic adjustments based on whether numbers are trending up or down, and by how much. It’s the metric that contextualizes success, stagnation, or decline.
Core Concepts: Old Value, New Value, and the Difference
Before diving into formulas, let’s define the key components:
- Old Value (or Original Value): This is the starting point, the baseline number from which the change is measured. It could be last year’s revenue, last month’s expense, or the initial price of an investment.
- New Value: This is the ending point, the number you are comparing against the old value. It could be this year’s revenue, this month’s expense, or the current price of an investment.
- Difference: This is the absolute numerical change between the new and old values. It’s calculated as
New Value - Old Value. This difference will be positive for an increase and negative for a decrease.
The general formula for calculating percentage change is:
$$ text{Percent Change} = left( frac{text{New Value} – text{Old Value}}{text{Old Value}} right) times 100% $$
This single formula can be used for both increases and decreases. A positive result indicates an increase, while a negative result indicates a decrease.
Calculating Percent Increase: Unlocking Growth Potential
When your investments yield returns, your business experiences higher sales, or your income sees a boost, you’re looking at a percent increase. Understanding how to quantify this growth is essential for celebrating successes, setting new goals, and making informed decisions about where to allocate resources next.
The Formula for Growth: Step-by-Step Calculation
The formula for percent increase is derived directly from the general percent change formula, specifically when the New Value is greater than the Old Value.
Formula for Percent Increase:
$$ text{Percent Increase} = left( frac{text{New Value} – text{Old Value}}{text{Old Value}} right) times 100% $$
Let’s break it down:
- Find the Difference: Subtract the Old Value from the New Value (
New Value - Old Value). This gives you the absolute amount of the increase. - Divide by the Old Value: Take the difference you just calculated and divide it by the Old Value. This converts the absolute change into a decimal representing the proportion of change relative to the original.
- Multiply by 100: Multiply the resulting decimal by 100 to express it as a percentage.
Example: Investment Growth
Suppose you invested $5,000 in a stock, and it grew to $6,250.
- Old Value = $5,000
- New Value = $6,250
- Difference = $6,250 – $5,000 = $1,250
- Divide by Old Value = $1,250 / $5,000 = 0.25
- Multiply by 100 = 0.25 * 100 = 25%
Your investment saw a 25% increase.
Real-World Applications: Investment Gains and Revenue Growth
Percent increase is a ubiquitous metric in financial analysis:
- Stock Appreciation: When assessing a stock’s performance, investors frequently look at its percentage gain over a quarter, year, or decade. A stock might go from $100 to $120, representing a 20% increase.
- Quarterly Sales Increase: Businesses meticulously track their sales growth. If a company’s Q1 sales were $1 million and Q2 sales reached $1.2 million, that’s a 20% increase in revenue, a strong indicator of business health.
- Salary Raises: When negotiating a raise, knowing the percentage increase helps you understand its impact on your overall compensation and purchasing power. A $5,000 raise on a $50,000 salary is a 10% increase, significantly different than a $5,000 raise on a $100,000 salary (5%).
- Inflation: Governments and economists use percent increase to measure inflation, tracking the percentage rise in the general price level of goods and services over time.
Common Pitfalls and How to Avoid Them
The most common mistake when calculating percent increase is using the wrong ‘original’ value. Always ensure you are dividing by the starting figure. Another pitfall is forgetting to multiply by 100, leaving you with a decimal instead of a percentage. Double-check your values and calculation steps for accuracy, especially when dealing with large datasets or critical financial decisions.
Mastering Percent Decrease: Navigating Financial Contraction
Just as values can increase, they can also decrease. Understanding percent decrease is crucial for recognizing losses, identifying areas for cost reduction, and adapting to market downturns. It helps you quantify the impact of expenses, depreciation, and adverse market conditions.
The Formula for Contraction: Step-by-Step Calculation
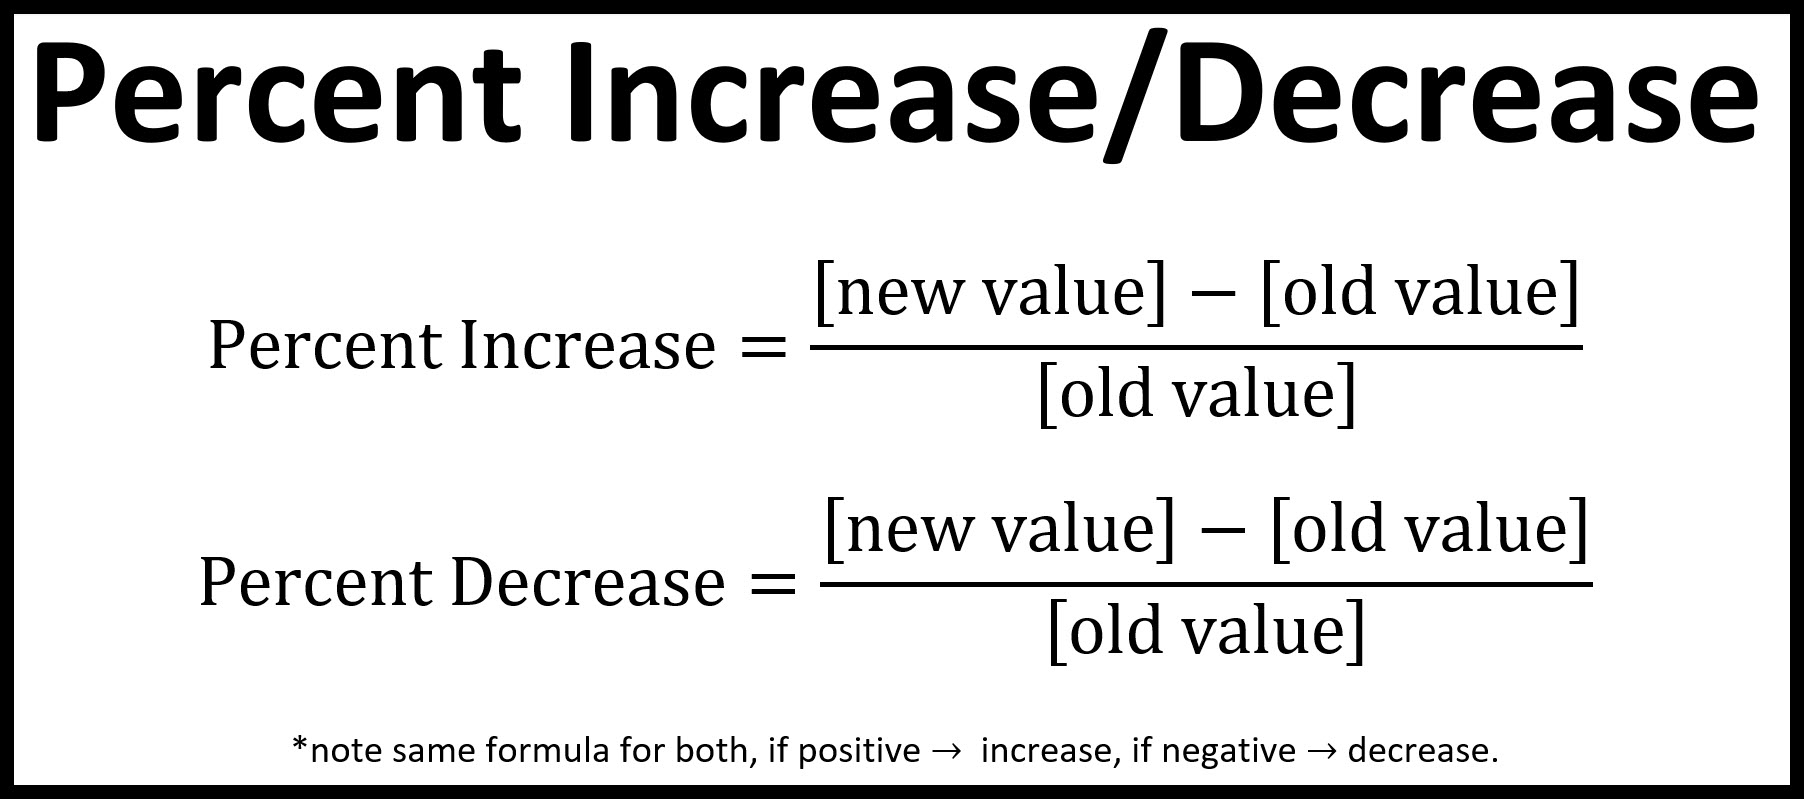
The same general formula applies, but when the New Value is less than the Old Value, the result will be a negative percentage, indicating a decrease. Often, for clarity, some prefer to present the “percent decrease” as a positive number by taking the absolute value of the difference in the numerator.
Formula for Percent Decrease (Resulting in a positive percentage representing the decrease magnitude):
$$ text{Percent Decrease} = left( frac{text{Old Value} – text{New Value}}{text{Old Value}} right) times 100% $$
Alternatively, using the general formula:
$$ text{Percent Change} = left( frac{text{New Value} – text{Old Value}}{text{Old Value}} right) times 100% $$
If the result is negative, it indicates a decrease.
Let’s use the first formula for a clear positive “percent decrease”:
- Find the Difference: Subtract the New Value from the Old Value (
Old Value - New Value). This gives you the absolute amount of the decrease. - Divide by the Old Value: Take the difference and divide it by the Old Value.
- Multiply by 100: Multiply the resulting decimal by 100 to get the percentage decrease.
Example: Portfolio Loss
Imagine your investment portfolio, which was worth $10,000, dropped to $8,500 during a market correction.
- Old Value = $10,000
- New Value = $8,500
- Difference = $10,000 – $8,500 = $1,500
- Divide by Old Value = $1,500 / $10,000 = 0.15
- Multiply by 100 = 0.15 * 100 = 15%
Your portfolio experienced a 15% decrease.
Real-World Applications: Expense Reduction and Market Downturns
Percent decrease is just as vital as percent increase in financial analysis:
- Budget Cuts: When a household or business needs to reduce spending, they might aim for a specific percentage decrease in certain expense categories. For example, reducing a $500 monthly entertainment budget to $400 is a 20% decrease.
- Market Corrections/Bear Markets: Investors track percentage drops in stock prices or market indices. A 10% drop from a peak is often termed a “correction,” while a 20% or more drop signifies a “bear market.”
- Depreciation of Assets: Assets like cars or machinery lose value over time. Understanding the annual percentage decrease in their value (depreciation) is important for accounting and financial planning.
- Sales Decline: If a product’s sales drop from 1,000 units to 750 units in a quarter, that’s a 25% decrease, signaling a need for marketing adjustments or product review.
Interpreting Negative Changes for Strategic Decisions
A percent decrease, while often undesirable, provides crucial information. It highlights areas of concern, signaling where intervention is needed. A consistent percent decrease in profit margins, for instance, could prompt a business to re-evaluate pricing strategies, supply chain efficiencies, or operational costs. For personal finance, a percentage drop in income might necessitate a reassessment of the budget to maintain financial stability. Recognizing the magnitude of the decrease allows for proportionate and effective strategic responses.
Advanced Applications and Strategic Insights
Beyond basic calculations, percent change forms the bedrock for more sophisticated financial analysis. Its versatility allows for deeper insights into long-term trends and comparative performance.
Compound Percentage Changes: The Power of Time
Many financial scenarios involve changes over multiple periods. While a simple percent change looks at two points in time, compound percentage changes account for the cumulative effect of growth or decline over several periods. For instance, compound interest on savings or the multi-year growth of a stock investment means that the percentage increase each year builds upon the new, larger principal. Understanding compound annual growth rate (CAGR) – effectively an averaged annual percent increase – is vital for comparing investments with different timelines and volatility.
Using Percentage Change in Financial Analysis Tools
Spreadsheets like Microsoft Excel or Google Sheets, and financial software like QuickBooks or specialized investment platforms, have built-in functions to easily calculate percent change. These tools automate the process, allowing users to analyze large datasets efficiently. For example, in Excel, you could calculate the percent change between two cells (e.g., =(B2-A2)/A2) and then format the result as a percentage. This functionality is indispensable for preparing financial reports, budgeting, and performance dashboards.
Benchmarking and Performance Evaluation
Percent change is the ultimate tool for benchmarking. Investors compare their portfolio’s percentage returns against major market indices (e.g., S&P 500, Dow Jones Industrial Average) to gauge relative performance. Businesses benchmark their percentage revenue growth against competitors or industry averages. For example, if your business grew by 15% but the industry average was 25%, while still a positive increase, it signals that you might be losing market share or lagging behind peers. This comparative analysis helps set realistic goals and identify areas for improvement or competitive advantage.
Practical Examples: From Personal to Business Finance
To solidify your understanding, let’s walk through diverse scenarios.
Personal Finance Scenario: Tracking Savings Growth
You start the year with $10,000 in your savings account. By year-end, thanks to deposits and interest, it grows to $10,750.
- Old Value = $10,000
- New Value = $10,750
- Percent Increase = (($10,750 – $10,000) / $10,000) * 100 = ($750 / $10,000) * 100 = 0.075 * 100 = 7.5% increase.
This shows your savings account grew by 7.5% over the year.
Investing Scenario: Analyzing Stock Performance
You bought shares of Company X for $50 each. A year later, they are trading at $42.
- Old Value = $50
- New Value = $42
- Percent Change = (($42 – $50) / $50) * 100 = (-$8 / $50) * 100 = -0.16 * 100 = -16% decrease.
Your investment in Company X decreased by 16%.

Business Finance Scenario: Evaluating Profit Margins
A small business had a profit margin of 12% last quarter. This quarter, after implementing cost-cutting measures, their profit margin increased to 15%. (Note: Here, the “values” are already percentages, but the calculation method remains the same for the change in that percentage).
- Old Value = 12% (or 0.12 as a decimal)
- New Value = 15% (or 0.15 as a decimal)
- Percent Increase = ((0.15 – 0.12) / 0.12) * 100 = (0.03 / 0.12) * 100 = 0.25 * 100 = 25% increase in the profit margin itself.
This indicates a very positive improvement in operational efficiency.
Mastering the calculation of percent increase and decrease is not just about crunching numbers; it’s about gaining a deeper understanding of financial realities. It equips you with the analytical tools necessary to make smarter decisions, whether you’re managing your personal wealth, steering a business, or evaluating market trends. By consistently applying these formulas and interpreting the results, you transform raw data into powerful insights, paving the way for financial clarity and strategic advantage.
aViewFromTheCave is a participant in the Amazon Services LLC Associates Program, an affiliate advertising program designed to provide a means for sites to earn advertising fees by advertising and linking to Amazon.com. Amazon, the Amazon logo, AmazonSupply, and the AmazonSupply logo are trademarks of Amazon.com, Inc. or its affiliates. As an Amazon Associate we earn affiliate commissions from qualifying purchases.