
In the dynamic world of finance, understanding how to quantify change is not merely a statistical exercise; it’s a fundamental skill that empowers individuals and businesses alike to make informed decisions. From tracking the performance of an investment portfolio to analyzing shifts in a company’s revenue, the ability to calculate percentage increase or decrease provides critical insights into the trajectory of financial data. This metric transcends raw numbers, offering a standardized and comparative view of growth, contraction, or stability, making it an indispensable tool for anyone navigating the complexities of personal finance, investing, or business management.

The Indispensable Role of Percentages in Finance
Percentages serve as a universal language in financial discourse, translating absolute changes into relative terms that are far more digestible and comparable. A mere increase of $100 might seem significant in one context but trivial in another, depending on the base value. By expressing this change as a percentage, we gain a clear, proportionate understanding that allows for meaningful comparison across diverse financial scenarios.
Understanding Financial Fluctuations
The financial landscape is in constant motion, characterized by fluctuations in market values, economic indicators, and personal financial metrics. Whether it’s the stock market, real estate, commodity prices, or even the cost of living, values rarely remain static. Percentage change provides the lens through which these fluctuations can be accurately measured and interpreted. For instance, knowing that a stock increased by 15% tells an investor much more than just knowing it went up by $15, especially if the original price was vastly different for two different stocks. It speaks to the rate of return, the efficiency of capital growth, and the relative impact of the change. Similarly, understanding the percentage increase in inflation helps consumers gauge the erosion of purchasing power more effectively than just looking at raw price changes.
Making Informed Decisions: From Personal Budgets to Investment Portfolios
At every level of financial decision-making, percentage change acts as a guiding star. For individuals, it’s crucial for managing personal budgets, evaluating savings growth, or understanding the true cost implications of rising expenses. If your utility bill increases by 10%, it signals a need to re-evaluate consumption or explore cost-saving measures. In investing, it’s the bedrock of performance analysis, allowing investors to compare the returns of different assets, funds, or strategies over various periods. A fund manager’s success is often measured by the percentage return on investment (ROI). For businesses, percentage calculations are vital for assessing sales growth, monitoring profit margins, controlling expenses, and understanding market share dynamics. A 5% increase in production costs, while seemingly small, can significantly impact overall profitability if not managed proactively. Without the ability to accurately calculate and interpret these percentages, financial planning becomes a guesswork, and strategic decisions lack a solid analytical foundation.
Mastering the Formula for Percentage Change
The beauty of percentage change lies in its straightforward mathematical foundation. While it can be applied to complex financial models, the core formulas are simple and intuitive, making them accessible to anyone willing to grasp the basics.
Deconstructing the Percentage Increase Formula
When a value grows over time, we use the percentage increase formula to quantify that growth in relative terms. This calculation tells us what proportion of the original value the increase represents.
The formula is as follows:
Percentage Increase = ((New Value – Original Value) / Original Value) * 100
Let’s break down its components:
- New Value: This is the current or later value after the increase.
- Original Value: This is the starting or earlier value before the increase.
- New Value – Original Value: This calculation gives us the absolute amount of the increase.
- (Absolute Increase / Original Value): This ratio determines the increase relative to the starting point. Multiplying by 100 converts this decimal ratio into a percentage.
Example in Finance (Stock Market Gain):
Imagine you purchased a stock for $50 per share (Original Value). After a year, its value rises to $65 per share (New Value).
- Absolute Increase = $65 – $50 = $15
- Percentage Increase = ($15 / $50) * 100 = 0.30 * 100 = 30%
This calculation clearly shows that your investment grew by 30%, providing a much clearer picture of your return on investment than just knowing it went up by $15.
Example in Business (Revenue Growth):
A small business reported revenues of $200,000 last year (Original Value) and $230,000 this year (New Value).
- Absolute Increase = $230,000 – $200,000 = $30,000
- Percentage Increase = ($30,000 / $200,000) * 100 = 0.15 * 100 = 15%
This 15% revenue growth allows the business owner to gauge their performance against industry benchmarks or previous periods more effectively.
Understanding the Percentage Decrease Formula
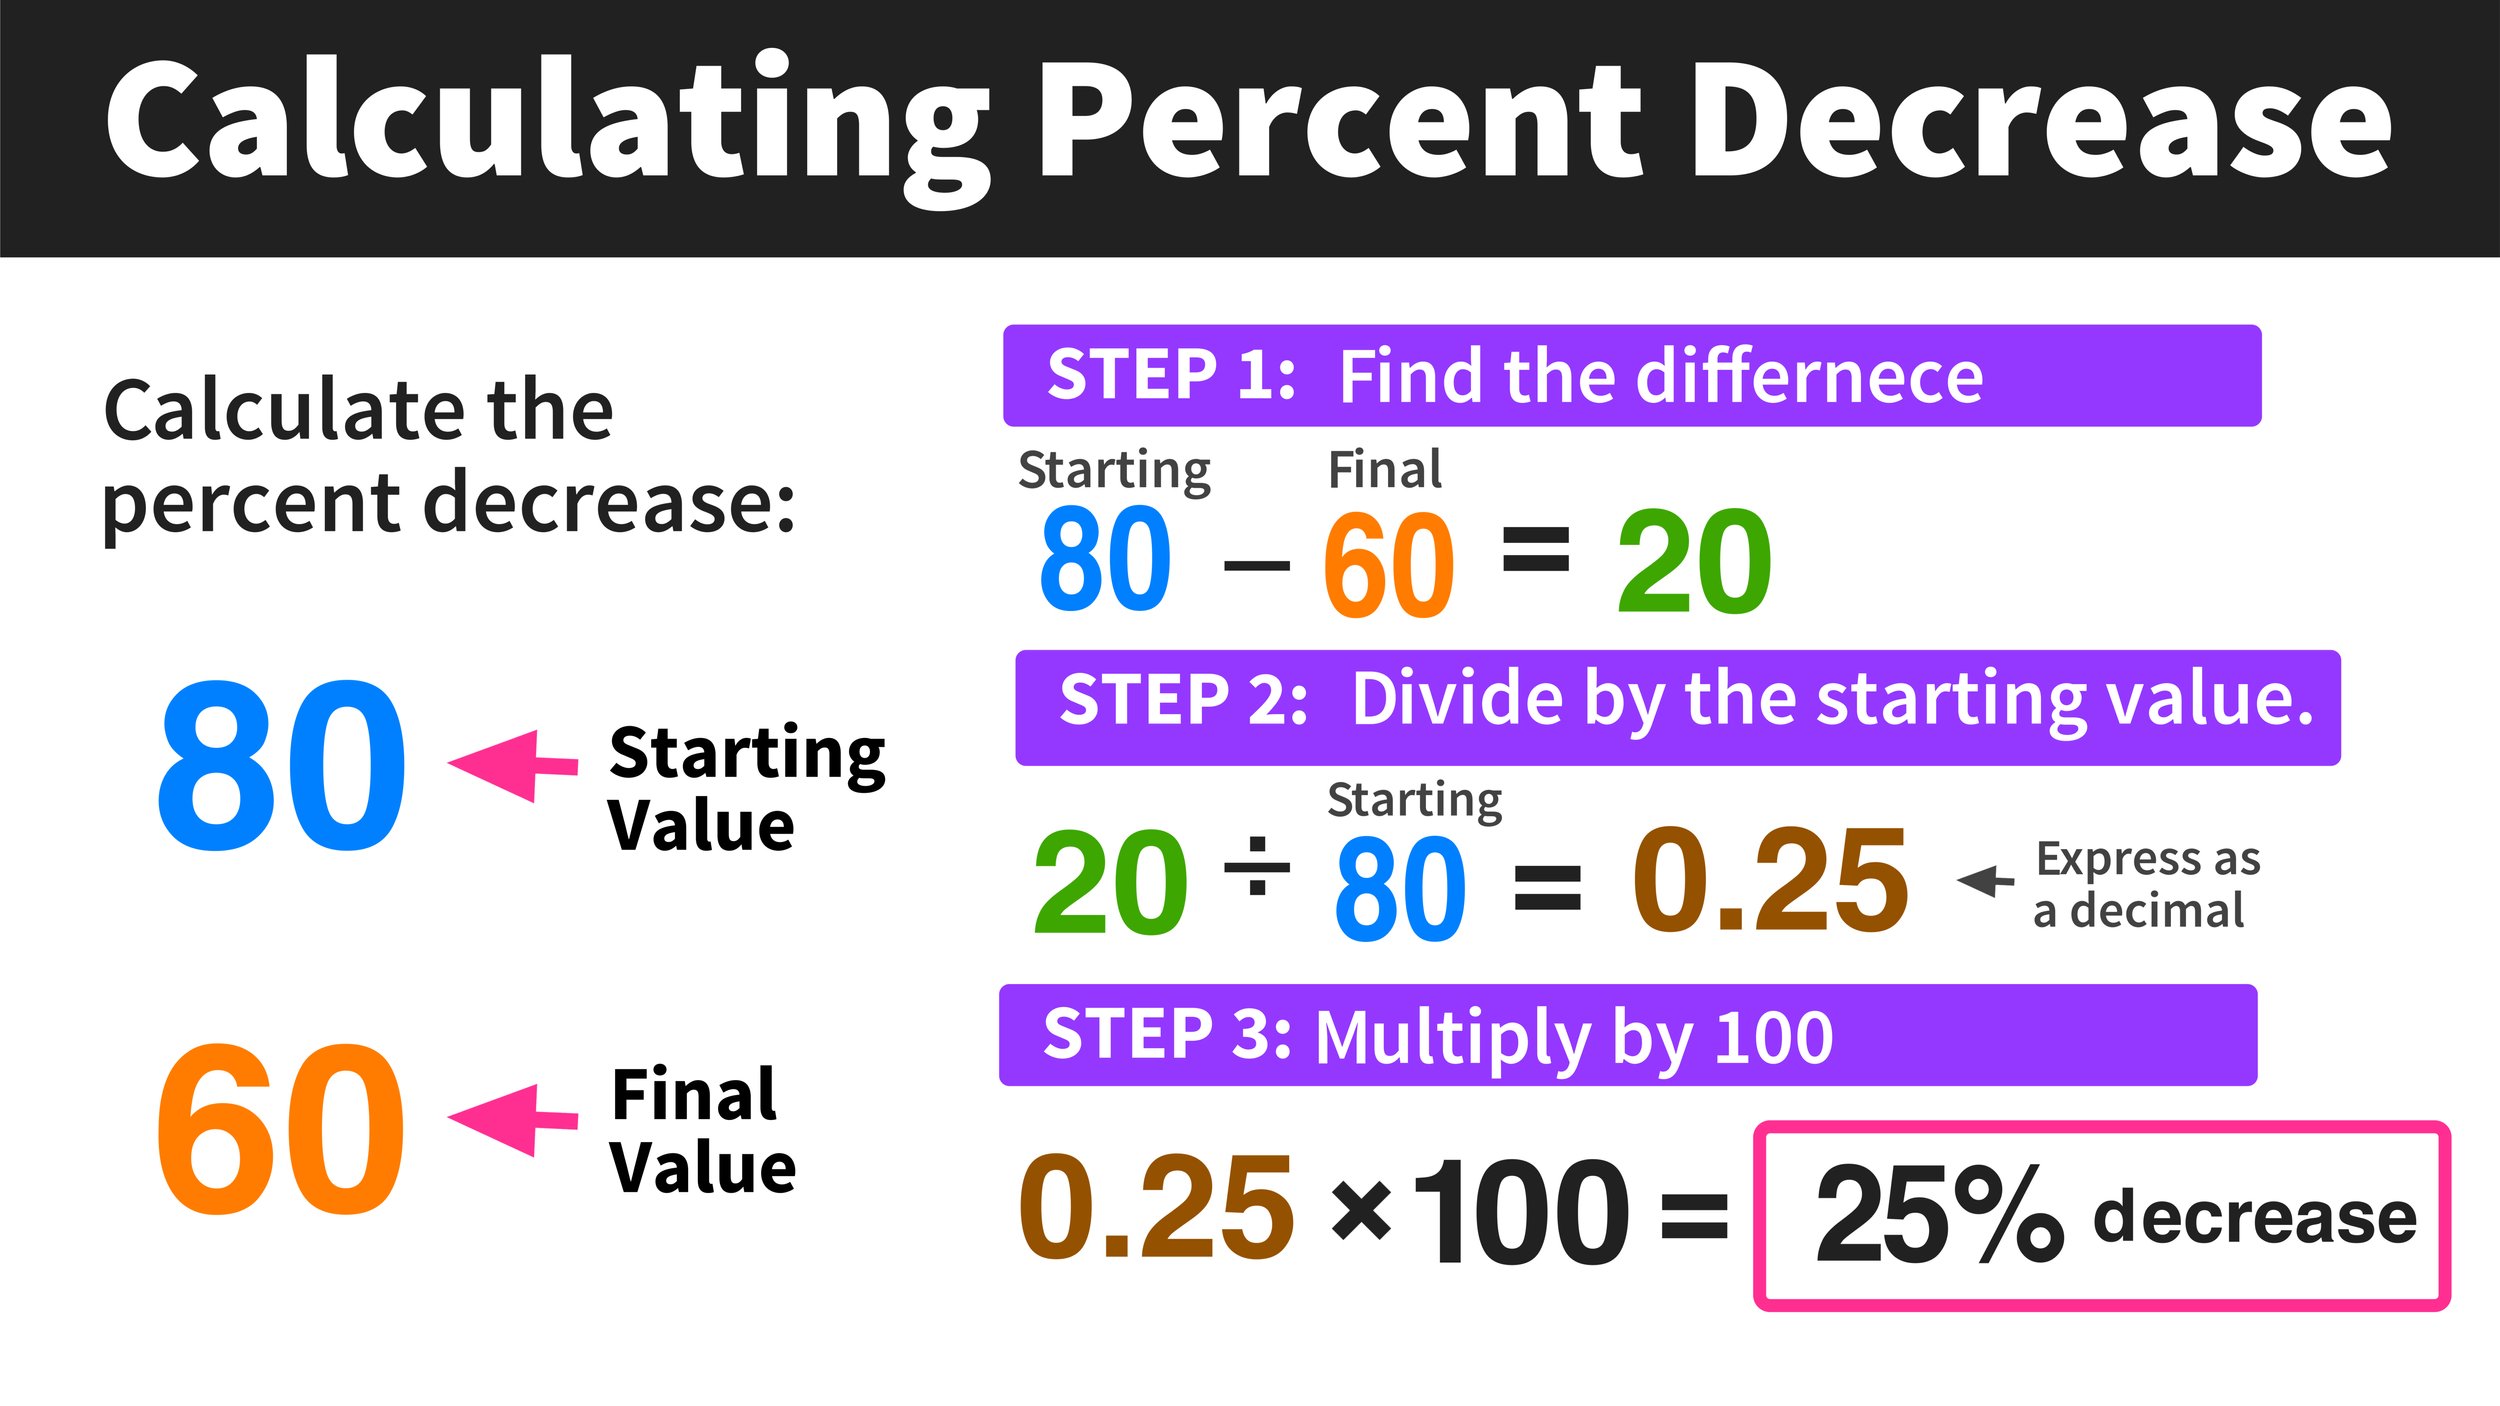
Conversely, when a value declines, the percentage decrease formula helps us understand the magnitude of that reduction relative to its initial state.
The formula is:
Percentage Decrease = ((Original Value – New Value) / Original Value) * 100
Key components:
- Original Value: The starting or earlier value before the decrease.
- New Value: The current or later value after the decrease.
- Original Value – New Value: This yields the absolute amount of the decrease.
- (Absolute Decrease / Original Value): This ratio indicates the decrease relative to the starting point, converted to a percentage by multiplying by 100.
Example in Finance (Investment Loss):
Suppose you initially invested $1,000 in a cryptocurrency (Original Value), and its value dropped to $750 (New Value).
- Absolute Decrease = $1,000 – $750 = $250
- Percentage Decrease = ($250 / $1,000) * 100 = 0.25 * 100 = 25%
A 25% loss signals a significant capital reduction, prompting potential re-evaluation of the investment.
Example in Personal Finance (Expense Reduction):
You managed to cut your monthly discretionary spending from $400 (Original Value) to $340 (New Value).
- Absolute Decrease = $400 – $340 = $60
- Percentage Decrease = ($60 / $400) * 100 = 0.15 * 100 = 15%
Achieving a 15% reduction in spending is a clear, quantifiable goal met, illustrating effective budget management.
The Importance of the “Base Value”
A critical element in both formulas is the “Original Value,” also known as the base value. This is always the starting point, the reference against which the change is measured. Using the correct base value is paramount for accurate calculations and meaningful interpretations. Mistaking the new value for the original, or vice-versa, will lead to erroneous results. The base value anchors the percentage change, providing the essential context for understanding the relative scale of increase or decrease. Without a clearly defined base, percentage calculations lose their analytical power and can lead to misguided financial conclusions.
Practical Applications in Personal Finance and Investing
The ability to calculate percentage change is a cornerstone of sound personal finance and investing strategies. It transforms raw data into actionable insights, enabling individuals to track progress, identify trends, and adjust their financial plans proactively.
Tracking Investment Performance
For investors, percentage change is the primary metric for evaluating how well their assets are performing.
- Return on Investment (ROI): Whether it’s stocks, bonds, mutual funds, or real estate, ROI is almost universally expressed as a percentage. If you invest $10,000 in a mutual fund and it grows to $11,500, that’s a 15% return. Comparing this to other investment options, or market benchmarks, helps you assess the fund’s efficiency and your portfolio’s overall health.
- Portfolio Allocation Shifts: As investments grow or shrink, their proportion within your total portfolio changes. Calculating the percentage shift helps you rebalance to maintain your desired asset allocation and risk profile. For example, if equities grow significantly, their percentage of your portfolio might exceed your target, signaling a need to sell some to reallocate to other asset classes.
- Annualized Returns: To compare investments over different timeframes, percentage changes are often annualized, providing a consistent metric for long-term growth or decline.
Budgeting and Expense Management
Managing personal finances effectively hinges on understanding where your money comes from and where it goes. Percentage calculations bring clarity to your income and expenses.
- Income Growth: Tracking the percentage increase in your salary year-over-year helps you understand your career progression and negotiate effectively.
- Expense Analysis: Monitoring percentage changes in categories like housing, utilities, food, or transportation can highlight rising costs and areas for potential savings. If your grocery bill consistently increases by 5% month-over-month without a change in consumption, it prompts a closer look at spending habits or inflation’s impact.
- Savings Rate: Expressing your savings as a percentage of your income (e.g., saving 15% of every paycheck) provides a clear, actionable target for financial independence and future planning.
Evaluating Loan and Debt Changes
Understanding the percentage implications of loans and debt is crucial for responsible borrowing and debt management.
- Interest Rate Adjustments: When mortgage or loan interest rates change, knowing the percentage increase or decrease allows borrowers to calculate the impact on their monthly payments and total interest paid over the loan’s life.
- Debt Reduction Progress: If you’re tackling credit card debt, tracking the percentage decrease in your outstanding balance provides motivation and a tangible measure of progress towards becoming debt-free. For instance, reducing a $10,000 debt to $8,000 represents a 20% decrease, a significant milestone.
- Loan-to-Value (LTV) Ratios: In real estate, LTV ratios (percentage of a loan amount compared to the appraised value of the asset) are critical for lenders and borrowers alike, influencing interest rates and refinancing options.
Business Finance: Gauging Growth and Efficiency
In the corporate world, percentage increase and decrease are the backbone of financial reporting, strategic planning, and operational analysis. They provide the metrics necessary to assess performance, identify trends, and drive profitability.
Analyzing Revenue and Profitability Trends
For businesses, the ability to interpret sales and profit data through percentages is critical for understanding market position and financial health.
- Year-over-Year (YoY) Sales Growth: This is a fundamental indicator of a company’s expansion. A 10% YoY sales growth signifies a healthy upward trajectory and is often a key metric for investors and stakeholders.
- Quarter-over-Quarter (QoQ) Performance: Similarly, tracking QoQ changes helps identify seasonal trends or immediate impacts of marketing campaigns or product launches.
- Gross Profit Margin: This percentage (Gross Profit / Revenue * 100) reveals how much profit a company makes from its sales after accounting for the cost of goods sold. Tracking changes in this margin is crucial for pricing strategies and cost control.
- Net Profit Margin: This percentage (Net Profit / Revenue * 100) indicates the overall profitability after all expenses, including taxes, are deducted. An increasing net profit margin signals greater operational efficiency and financial strength.
Monitoring Operational Costs and Efficiency
Businesses continuously seek ways to optimize operations and reduce unnecessary expenditures. Percentage analysis is vital here.
- Cost of Goods Sold (COGS) Changes: Monitoring the percentage increase or decrease in COGS relative to revenue helps assess procurement efficiency and production cost management. A rising COGS percentage could indicate issues with suppliers or production processes.
- Operating Expense Ratios: Tracking expenses like marketing, administration, or research and development as a percentage of revenue (e.g., Marketing Expense / Revenue * 100) allows management to benchmark against industry averages and ensure spending is proportionate to growth.
- Productivity Gains: A decrease in the percentage of labor costs per unit produced signifies improved operational efficiency and potentially higher profitability.
Market Share and Competitive Analysis
Understanding a company’s position within its industry requires careful analysis of market dynamics, often expressed in percentages.
- Market Share Growth/Decline: A company’s market share is its sales as a percentage of total industry sales. Tracking the percentage increase or decrease in market share is a direct measure of competitive success or struggle.
- Competitor Performance: By analyzing the percentage revenue growth or profitability changes of competitors, a company can benchmark its own performance and identify areas for strategic improvement.
- Customer Acquisition Cost (CAC) and Lifetime Value (LTV): Expressing these metrics as percentages or ratios (e.g., LTV:CAC ratio) helps businesses understand the efficiency of their marketing efforts and the long-term value of their customer base.
Common Pitfalls and Advanced Considerations
While the formulas for percentage increase and decrease are straightforward, their application in real-world financial scenarios requires careful consideration to avoid misinterpretations and ensure accurate analysis.
The Base Value Trap: Why Context Matters
One of the most common errors is misidentifying the original or base value. As highlighted earlier, the base value is the starting point from which the change is measured. Forgetting this can lead to inverted calculations and erroneous conclusions. For example, if an item’s price increases from $100 to $120, that’s a 20% increase. If it then decreases from $120 back to $100, that’s not a 20% decrease; it’s ($20/$120)*100 = 16.67% decrease. The base always shifts with the reference point. Understanding this nuance is crucial for assessing multi-period changes or cyclical trends in finance.
Compounding Effects and Long-Term Analysis
For long-term financial analysis, especially in investing, the concept of compounding plays a vital role. Simple percentage increase or decrease calculations might not fully capture the compounding effect where returns themselves generate further returns. For example, an investment growing 10% each year for five years will not simply be 50% larger due to compounding. Financial tools often use Compound Annual Growth Rate (CAGR) to provide a more accurate annualized percentage growth rate over multiple periods, smoothing out volatility and offering a true picture of sustained growth.

When to Use Absolute vs. Percentage Change
While percentages offer relative context, there are situations where absolute changes are also important. For instance, a small business experiencing a $10,000 revenue increase might be thrilled, even if it’s only a 2% gain, because $10,000 is a significant amount of cash flow. Conversely, a multi-billion dollar corporation might see a 2% increase as negligible in its overall context. The best financial analysis often involves considering both the absolute dollar value change and its percentage equivalent to gain a holistic understanding of the financial event. A critical analyst will always ask: “What does this percentage represent in actual dollars?”
In conclusion, the seemingly simple act of calculating percentage increase or decrease forms the bedrock of financial literacy and sound decision-making in the money realm. From personal budgeting and astute investment choices to rigorous business analysis and strategic planning, mastering these fundamental calculations empowers individuals and organizations to navigate financial landscapes with confidence, clarity, and precision. It’s not just about numbers; it’s about understanding the story those numbers tell, and using that narrative to forge a path towards financial prosperity and stability.
aViewFromTheCave is a participant in the Amazon Services LLC Associates Program, an affiliate advertising program designed to provide a means for sites to earn advertising fees by advertising and linking to Amazon.com. Amazon, the Amazon logo, AmazonSupply, and the AmazonSupply logo are trademarks of Amazon.com, Inc. or its affiliates. As an Amazon Associate we earn affiliate commissions from qualifying purchases.