
In the dynamic world of finance, understanding how to measure progress and change is paramount. Whether you’re a seasoned investor tracking portfolio performance, a business owner analyzing quarterly revenue, or an individual monitoring personal wealth, the concept of percent growth is an indispensable tool. It transcends mere numerical increases, offering a clear, standardized metric to gauge expansion, efficiency, and success relative to a starting point. Without this crucial calculation, financial decisions would be based on raw figures alone, lacking the contextual depth necessary for insightful analysis and strategic planning. This guide will delve into the fundamental principles, practical applications, and advanced considerations of percent growth, empowering you to unlock deeper financial insights.

Understanding the Fundamentals of Percent Growth
Percent growth is more than just a mathematical operation; it’s a lens through which we interpret financial evolution. It quantifies the proportional change in a value over a period, expressing this change as a percentage of the initial value. This standardized measure allows for easy comparison across different scales and timeframes, making it a cornerstone of financial analysis.
What is Percent Growth? Its Indispensable Role in Finance
At its core, percent growth measures the rate at which a financial metric increases or decreases. Unlike absolute growth, which simply states the numerical difference, percent growth contextualizes this difference. For instance, a $10,000 increase might seem substantial. But if it’s an increase from $100,000 to $110,000, it represents a 10% growth. If it’s an increase from $1,000,000 to $1,010,000, it’s only 1% growth. The percentage provides the true magnitude of the change relative to the initial sum, which is vital for fair comparisons and informed decision-making.
In personal finance, tracking the percent growth of your investments, savings, or net worth provides a clear picture of your financial health and trajectory. For businesses, it’s critical for assessing sales performance, profit margins, and market share expansion. Investors rely on it to evaluate the performance of stocks, bonds, and mutual funds, determining which assets are generating the most significant returns. Economists use it to gauge the health of national economies through metrics like GDP growth or inflation rates. The ability to express growth in percentage terms democratizes financial analysis, making complex changes comprehensible and comparable.
The Core Formula: A Simple Breakdown for Financial Application
The beauty of percent growth lies in its straightforward formula. While various derivatives exist for specific scenarios, the foundational calculation remains consistent.
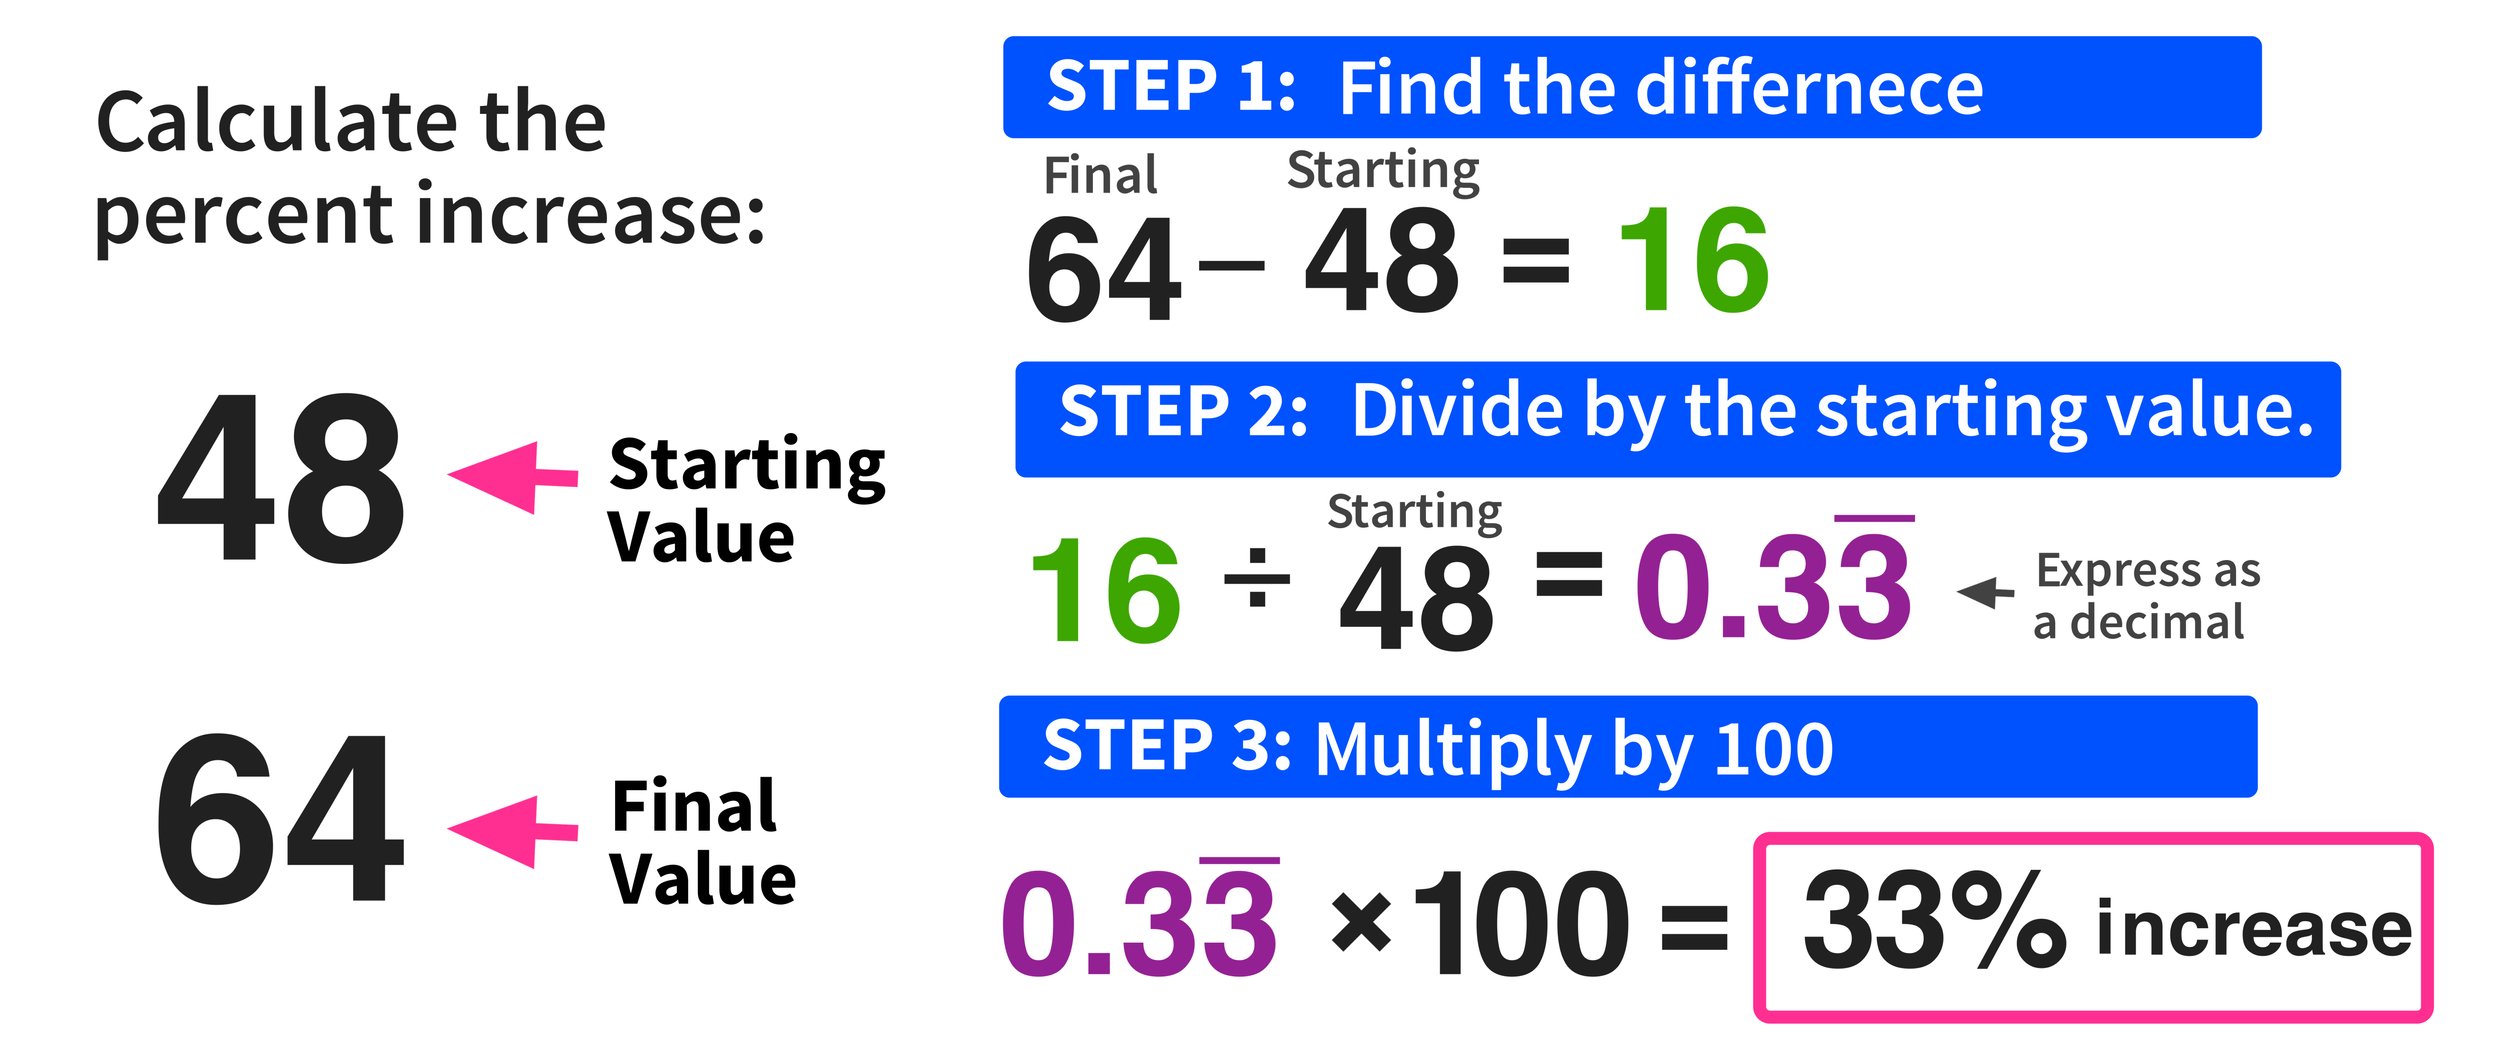
The formula for percent growth is:
$$ text{Percent Growth} = left( frac{text{Current Value} – text{Past Value}}{text{Past Value}} right) times 100 $$
Let’s break down each component in a financial context:
- Current Value (or New Value): This is the financial metric at the end of the period you are analyzing. It could be your investment portfolio’s current value, a company’s latest quarterly revenue, or your net worth today.
- Past Value (or Old Value/Initial Value): This is the financial metric at the beginning of the period. This would be your initial investment, the company’s revenue from the previous quarter, or your net worth from a year ago.
- The Difference (Current Value – Past Value): This numerator represents the absolute change in value. A positive result indicates an increase, while a negative result signifies a decrease (which would then be referred to as percent decline or negative growth).
- Divided by Past Value: By dividing the absolute change by the original value, we normalize the change, converting it into a ratio that reflects the change relative to the base.
- Multiplied by 100: This final step converts the decimal ratio into a percentage, making it easier to read and interpret.
For example, if an investment grew from $5,000 to $6,250:
$$ text{Percent Growth} = left( frac{$6,250 – $5,000}{$5,000} right) times 100 $$
$$ text{Percent Growth} = left( frac{$1,250}{$5,000} right) times 100 $$
$$ text{Percent Growth} = 0.25 times 100 = 25% $$
This investment experienced a 25% growth.
Step-by-Step Guide to Calculating Percent Growth for Financial Metrics
Calculating percent growth is a methodical process. Following these steps ensures accuracy and clarity in your financial analysis.
Identifying Your Starting and Ending Values
The first and most critical step is to accurately identify the “Past Value” and “Current Value” for the financial metric you wish to analyze. Misidentifying these values is a common source of error.
- For Investment Portfolios: Your Past Value might be the portfolio’s worth on January 1st, and your Current Value would be its worth on December 31st of the same year. Or, for a single stock, it could be its purchase price (Past Value) versus its current market price (Current Value).
- For Business Revenue/Profit: The Past Value could be last year’s total revenue, and the Current Value this year’s total revenue. For quarterly analysis, it would be the previous quarter’s figure versus the current quarter’s.
- For Personal Net Worth: The Past Value might be your net worth calculated on a specific date a year ago, with the Current Value being your net worth today.
- For Loan Balances or Debt: Here, you might be looking for negative growth. Your Past Value could be the initial loan amount, and your Current Value the outstanding balance after several payments.
Ensure that both values relate to the exact same financial metric and cover a clearly defined period. Comparing apples to oranges (e.g., revenue from one product line to profit from another) will yield meaningless results.
Performing the Calculation with Financial Examples
Once you have your two values, apply the formula. Let’s walk through a few financial examples:
Example 1: Measuring Investment Return
- You invested $10,000 in a mutual fund.
- After 3 years, the fund is worth $13,500.
- Past Value = $10,000
- Current Value = $13,500
$$ text{Percent Growth} = left( frac{$13,500 – $10,000}{$10,000} right) times 100 $$
$$ text{Percent Growth} = left( frac{$3,500}{$10,000} right) times 100 $$
$$ text{Percent Growth} = 0.35 times 100 = 35% $$
Your investment grew by 35% over three years.
Example 2: Tracking Business Sales Growth
- A small business had $500,000 in sales last year.
- This year, sales reached $580,000.
- Past Value = $500,000
- Current Value = $580,000
$$ text{Percent Growth} = left( frac{$580,000 – $500,000}{$500,000} right) times 100 $$
$$ text{Percent Growth} = left( frac{$80,000}{$500,000} right) times 100 $$
$$ text{Percent Growth} = 0.16 times 100 = 16% $$
The business achieved a 16% sales growth this year.
Example 3: Analyzing a Decline (Negative Growth)
- A specific stock you own was valued at $120 per share.
- Due to market fluctuations, it is now trading at $102 per share.
- Past Value = $120
- Current Value = $102
$$ text{Percent Growth} = left( frac{$102 – $120}{$120} right) times 100 $$
$$ text{Percent Growth} = left( frac{-$18}{$120} right) times 100 $$
$$ text{Percent Growth} = -0.15 times 100 = -15% $$
The stock experienced a 15% decline (or negative growth).
Interpreting the Results: Positive, Negative, and Zero Growth
Once calculated, interpreting the percent growth figure is key to deriving actionable insights:
- Positive Percent Growth: This indicates an increase in the financial metric. A higher positive percentage signifies stronger growth. For investments, this is profit; for businesses, it’s expansion.
- Negative Percent Growth (or Percent Decline): A negative percentage indicates a decrease. This is critical for identifying underperforming assets, declining sales, or a shrinking net worth. It signals a need for investigation and potential corrective action.
- Zero Percent Growth: If the current value is identical to the past value, the result will be 0%. This indicates stagnation or no change over the period, which in many financial contexts (like investments) is undesirable.
Understanding these interpretations allows you to not just see what happened, but to begin to understand why it matters for your financial goals.
Real-World Applications in Personal and Business Finance
The utility of percent growth extends across almost every facet of financial management, from individual wealth building to corporate strategy.
Measuring Investment Returns
For investors, percent growth is the ultimate scorecard.
- Stock Performance: Comparing a stock’s percentage gain over a year to its industry peers or a benchmark index (like the S&P 500) provides a clear picture of its relative performance.
- Mutual Funds and ETFs: Fund managers are evaluated by the percent growth (return) they generate for investors. Percent growth helps investors choose funds that consistently outperform.
- Real Estate: Calculating the appreciation of a property’s value over time as a percentage helps determine its profitability and potential as an investment.
It allows you to compare different investment opportunities with varying initial costs, giving you an “apples-to-apples” comparison of true growth.
Tracking Business Performance
Businesses thrive on growth, and percent growth metrics are central to their financial health.
- Revenue Growth: A primary indicator of a company’s market penetration and sales effectiveness. A high percentage suggests successful strategies.
- Profit Growth: Beyond just sales, profit growth (e.g., net income growth) reveals how efficiently a business converts revenue into earnings.
- Customer Growth: For subscription-based or service businesses, the percentage increase in customer base is a vital metric for assessing market share and future revenue potential.
- Expense Control: While often focused on positive growth, businesses also monitor percent reduction in expenses to improve profitability.
These metrics enable management to set targets, evaluate departmental performance, and make strategic decisions about expansion, cost-cutting, or product development.
Assessing Personal Wealth Accumulation
On a personal level, percent growth helps individuals chart their financial journey.
- Net Worth Growth: Regularly calculating the percent change in your net worth (assets minus liabilities) provides a comprehensive view of your overall financial progress. A consistent positive percentage indicates effective savings and investment strategies.
- Savings Growth: Tracking the percentage increase in your savings accounts can motivate further contributions and highlight the impact of compound interest.
- Retirement Fund Growth: Monitoring the percent growth of your 401(k) or IRA is crucial for ensuring you are on track to meet your retirement goals.
This personal financial insight empowers individuals to adjust their budgets, investment strategies, and financial habits to align with their long-term aspirations.
Analyzing Economic Indicators
At a macro level, percent growth is used to interpret the health and direction of entire economies.
- Gross Domestic Product (GDP) Growth: The percentage change in a country’s GDP is a key indicator of economic expansion or contraction. It influences policy decisions and market sentiment.
- Inflation Rate: This is the percentage increase in the price of goods and services, reflecting the purchasing power of money over time.
- Unemployment Rate Change: While often presented as an absolute change, the percentage change in the unemployment rate can be analyzed to understand the pace of job market shifts.
These macroeconomic percentages help governments, businesses, and individuals understand the broader financial landscape, impacting everything from interest rates to consumer spending power.
Beyond the Basics: Advanced Considerations and Common Pitfalls
While the basic formula is straightforward, real-world financial analysis often requires a more nuanced approach to percent growth.
Annualized Growth vs. Period Growth: The Power of CAGR
When comparing growth rates over different durations, a simple percent growth can be misleading. This is where annualized growth comes into play, particularly the Compound Annual Growth Rate (CAGR).
- Period Growth: The basic formula calculates growth over a specific, defined period (e.g., 35% over 3 years, as in our investment example).
- Annualized Growth (CAGR): This metric provides a smoothed annual growth rate over multiple periods, assuming the profits are reinvested. It’s especially useful for investments that compound over several years.
The CAGR formula is:
$$ text{CAGR} = left[ left( frac{text{Ending Value}}{text{Beginning Value}} right)^{frac{1}{text{Number of Years}}} – 1 right] times 100 $$
Using our investment example ($10,000 to $13,500 over 3 years):
$$ text{CAGR} = left[ left( frac{$13,500}{$10,000} right)^{frac{1}{3}} – 1 right] times 100 $$
$$ text{CAGR} = left[ (1.35)^{0.3333} – 1 right] times 100 $$
$$ text{CAGR} = [1.1051 – 1] times 100 = 10.51% $$
This means the investment grew at an average annual rate of 10.51% over the three years, considering compounding. CAGR provides a more accurate picture for long-term financial planning and comparative analysis.
The Impact of Compounding on Growth
Compounding is a fundamental principle in finance where the earnings from an investment are reinvested to generate additional earnings. Percent growth calculations implicitly incorporate compounding when the “Current Value” includes previously accumulated earnings. Understanding this multiplier effect is crucial for long-term wealth accumulation. A seemingly modest annual percent growth can lead to substantial wealth over time due to compounding, making consistent positive growth rates highly valuable.
Avoiding Misinterpretations: Context is King
While powerful, percent growth can be misleading if not interpreted within its proper context.
- Base Effect: A small absolute increase can appear as a massive percent growth if the initial “Past Value” was very small. For example, growing from $10 to $20 is a 100% increase, but the absolute gain is only $10. This is often seen in nascent businesses or startups reporting impressive early-stage growth percentages.
- Time Period: Ensure the timeframes for comparison are consistent and relevant. A 5% growth in a single month is vastly different from 5% growth over a year.
- Industry Benchmarks: A 10% annual revenue growth might be exceptional for a mature utility company but lackluster for a fast-growing tech startup. Always compare against industry averages or competitors.
- Inflation: Real growth (adjusted for inflation) provides a truer picture of purchasing power increase. A 3% investment growth when inflation is 4% means you’ve actually lost purchasing power.
Always ask: “Compared to what?” and “Over what period?” to ensure a comprehensive and accurate interpretation of percent growth figures.

Conclusion
The ability to calculate and interpret percent growth is an indispensable skill in the modern financial landscape. From the individual managing a personal budget to the executive steering a multinational corporation, understanding this fundamental metric empowers more informed decisions, facilitates objective comparisons, and reveals the true trajectory of financial performance. By mastering the core formula, applying it to real-world financial scenarios, and being mindful of advanced considerations like annualization and contextual interpretation, you gain a powerful analytical tool. Embrace percent growth not just as a number, but as a compass guiding you toward better financial health and strategic success.
aViewFromTheCave is a participant in the Amazon Services LLC Associates Program, an affiliate advertising program designed to provide a means for sites to earn advertising fees by advertising and linking to Amazon.com. Amazon, the Amazon logo, AmazonSupply, and the AmazonSupply logo are trademarks of Amazon.com, Inc. or its affiliates. As an Amazon Associate we earn affiliate commissions from qualifying purchases.