
Understanding inflation is crucial for making informed financial decisions, whether you’re managing personal finances, investing, or running a business. The most widely recognized and frequently cited measure of inflation is the Consumer Price Index (CPI). Far from being an obscure economic indicator, the CPI serves as a vital barometer for the health of an economy, reflecting changes in the prices of goods and services that ordinary consumers purchase. This guide will demystify the CPI, explain how to access and interpret its data, and show you precisely how to use it to calculate and understand inflation, empowering you to navigate the economic landscape with greater confidence.

The Core Concepts: Inflation and the Consumer Price Index (CPI)
Before delving into the mechanics of calculation, it’s essential to grasp the fundamental definitions of inflation and the CPI, and why they hold such significant weight in economic discourse and personal financial planning.
What is Inflation?
At its simplest, inflation refers to the rate at which the general level of prices for goods and services is rising, and consequently, the purchasing power of currency is falling. When inflation is high, your money buys less than it did before. A persistent rise in prices over time erodes the value of savings, increases the cost of living, and can significantly impact long-term financial goals. Inflation isn’t merely about the price of a single item going up; it’s about a broad, sustained increase across a wide range of products and services. Understanding this broad impact is the first step toward recognizing its importance.
Introducing the Consumer Price Index (CPI): The Key Metric
The Consumer Price Index (CPI) is an economic indicator published monthly by the U.S. Bureau of Labor Statistics (BLS). It is a measure of the average change over time in the prices paid by urban consumers for a market basket of consumer goods and services. The CPI is often considered the primary gauge of inflation in the United States because it directly reflects the cost of living for a large segment of the population. Its purpose is multifaceted: it informs monetary policy, adjusts Social Security benefits and wage contracts, and provides a benchmark for understanding economic trends that affect everyday citizens and businesses alike. Essentially, the CPI translates complex economic data into an accessible number that tells us how much more or less expensive life is becoming.
Deconstructing the CPI: What It Measures and How It’s Compiled
To accurately use the CPI to find inflation, one must first understand what it actually comprises and how its data is collected and processed. This involves looking into the metaphorical “basket” of goods and services, the methodologies employed, and the distinction between different CPI metrics.
The “Basket of Goods and Services”: A Closer Look
The core of the CPI lies in its “market basket.” This basket represents the typical goods and services purchased by urban consumers. It’s not a static list but is periodically updated to reflect changes in consumer spending habits. The categories within this basket are broad and diverse, designed to capture a comprehensive picture of household expenditures. Key components include:
- Housing: This is often the largest component, covering rent, homeowners’ equivalent rent, utilities (electricity, natural gas, water, sewage, trash collection), and household furnishings and operations.
- Food and Beverages: Groceries for home consumption, as well as restaurant meals and snacks.
- Transportation: New and used vehicles, gasoline, public transportation fares, maintenance and repair, and vehicle insurance.
- Medical Care: Prescription drugs, medical supplies, physicians’ services, hospital services, and health insurance.
- Apparel: Clothing and footwear.
- Education and Communication: Tuition fees, school books, computer software, internet services, and telephone services.
- Recreation: Televisions, sports equipment, admissions to sporting events, and hobbies.
- Other Goods and Services: Personal care products, tobacco, and miscellaneous services.
Each of these categories is assigned a weight based on its share of total consumer spending, ensuring that items like housing, which consume a larger portion of income, have a greater impact on the overall index than, say, recreational goods.
Data Collection and Calculation Methodologies
The BLS employs a rigorous process to collect price data from thousands of retail establishments, housing units, and service providers across 75 urban areas throughout the U.S. BLS field representatives visit or call stores, service establishments, and rental units to obtain prices on a sample of items. For example, for food, they might record the price of a specific brand of cereal or a certain cut of meat. For housing, they collect rent data. This vast amount of raw data is then processed.
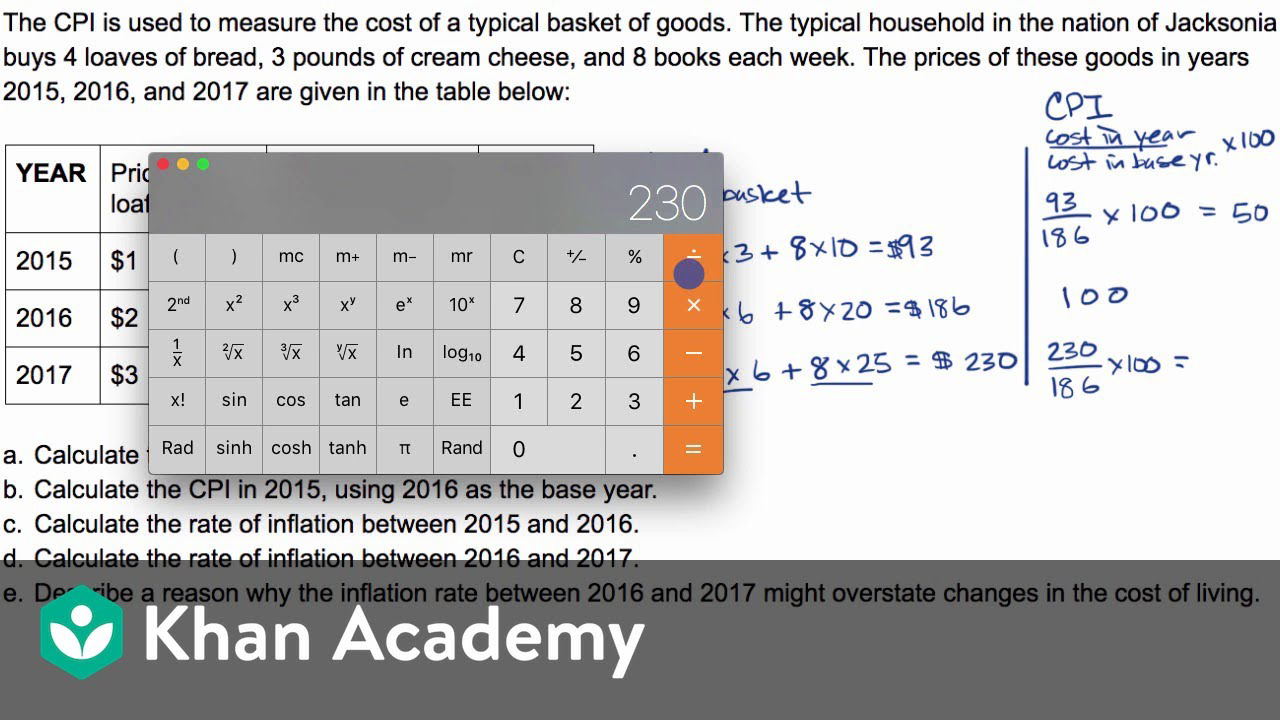
The CPI is a weighted average of price changes for all the items in the basket. It is expressed as an index number, where a specific period (the “base period”) is set to 100. For instance, if the average price of the basket in the base period was $1,000, and it rises to $1,100, the CPI for the current period would be 110 (1100/1000 * 100). The BLS calculates several CPI measures, with the two most common being:
- CPI for All Urban Consumers (CPI-U): This covers approximately 93 percent of the total U.S. population and represents the spending habits of urban wage earners and clerical workers, as well as professional, managerial, and technical workers, the self-employed, short-term workers, the unemployed, and retirees.
- CPI for Urban Wage Earners and Clerical Workers (CPI-W): This covers about 29 percent of the U.S. population and is a subset of the CPI-U, specifically used for adjusting Social Security benefits and collective bargaining agreements.
Headline vs. Core CPI: Understanding the Nuances
When discussing inflation, you’ll often hear about “headline CPI” and “core CPI.” The distinction is important for understanding the underlying trends in prices.
- Headline CPI: This is the comprehensive measure that includes all the goods and services in the market basket, including food and energy prices. It provides the most immediate picture of overall price changes impacting consumers.
- Core CPI: This measure excludes the volatile food and energy components. Food and energy prices are subject to frequent and often dramatic fluctuations due to factors like weather events, geopolitical tensions, and supply chain disruptions. While these components certainly affect household budgets, their volatility can obscure the longer-term inflationary trends that policymakers are more concerned with. For this reason, economists and central banks often pay closer attention to core inflation when making monetary policy decisions, as it’s considered a better indicator of underlying inflationary pressures.
Accessing and Interpreting CPI Data for Practical Insights
With a foundational understanding of what the CPI is, the next step is to learn where to find this crucial data and how to use it to calculate inflation rates.
Where to Find Official CPI Data
The primary and most authoritative source for CPI data in the United States is the Bureau of Labor Statistics (BLS). Their website (www.bls.gov) provides a wealth of information, including:
- Monthly CPI News Releases: These provide summary statistics and analysis for the most recent data.
- Detailed Data Tables: You can find historical CPI data for various categories and regions, allowing for in-depth analysis.
- Databases and Tools: The BLS website offers tools to customize data retrieval, chart historical trends, and perform specific calculations.
Another excellent resource for economic data, including CPI, is the Federal Reserve Economic Data (FRED) database, maintained by the Federal Reserve Bank of St. Louis (fred.stlouisfed.org). FRED offers highly customizable charts and data series, making it easy to visualize trends and compare different economic indicators. Financial news outlets and reputable economic research firms also frequently cite and analyze BLS CPI data.
Calculating Inflation Rates from CPI
Once you have the CPI numbers, calculating the inflation rate is straightforward. The most common way to express inflation is as a year-over-year percentage change, which shows how much prices have risen over the past 12 months. This is generally preferred as it smooths out seasonal fluctuations.
The formula for calculating the inflation rate between two periods is:
Inflation Rate = ((CPI in Current Period – CPI in Previous Period) / CPI in Previous Period) * 100

Let’s illustrate with an example:
- Suppose the CPI in January of Year 1 was 270.000.
- Suppose the CPI in January of Year 2 was 280.800.
Year-over-Year Inflation Rate = ((280.800 – 270.000) / 270.000) * 100
= (10.800 / 270.000) * 100
= 0.04 * 100
= 4.0%
This means that, on average, prices for goods and services increased by 4.0% from January Year 1 to January Year 2.
You can also calculate month-over-month inflation using the same formula, comparing the CPI from the current month to the previous month’s CPI. However, as noted, these figures are often seasonally adjusted to remove predictable seasonal patterns that could distort the underlying trend. It’s crucial to be aware of whether you are using seasonally adjusted or unadjusted data for short-term comparisons.
Reading and Understanding CPI Reports
CPI reports are detailed and provide more than just the headline number. When reading a report, pay attention to:
- Annualized Rates: Often, monthly changes are annualized to give a sense of what the inflation would be if that monthly rate persisted for a year.
- Component Breakdown: Look at which categories are driving the overall inflation. Is it primarily energy, housing, or food? This insight can help you understand how inflation might specifically affect your budget.
- Regional Data: The BLS also provides CPI data for specific metropolitan areas. If you live in one of these areas, checking your local CPI can give you a more accurate picture of price changes in your region.
- Seasonally Adjusted vs. Unadjusted Data: As mentioned, seasonally adjusted data removes regular seasonal patterns, making it easier to identify underlying trends, especially for month-over-month comparisons.
The Real-World Impact: How CPI-Derived Inflation Affects You
Understanding CPI and inflation isn’t an academic exercise; it has tangible, direct implications for personal finance, investment strategies, and broader economic policy.
Personal Finance and Purchasing Power
Inflation directly erodes your purchasing power. If your income doesn’t rise at the same rate as inflation, your real (inflation-adjusted) income decreases, meaning you can afford less with the same amount of money. This affects:
- Everyday Expenses: The cost of groceries, gas, rent, and utilities all increase, squeezing household budgets.
- Savings: Money held in traditional savings accounts or under the mattress loses value over time if the interest earned (or zero interest) is less than the inflation rate.
- Retirement Planning: Future expenses in retirement will be higher than current ones, requiring a larger nest egg than might initially seem necessary if inflation is not accounted for.
Understanding CPI helps individuals anticipate these changes and adjust their budgeting and saving habits accordingly.
Investment Strategies in an Inflated Environment
Inflation is a critical factor for investors. High inflation can devalue fixed-income investments and certain types of equities, while others may offer a hedge.
- Fixed Income: Bonds, particularly those with long maturities and fixed interest rates, are vulnerable to inflation, as the fixed payments become less valuable in real terms. Inflation-Protected Securities (TIPS) are an exception, as their principal value adjusts with the CPI.
- Equities: Companies with strong pricing power and low capital expenditure requirements may perform well in inflationary periods. However, inflation can also increase input costs and reduce consumer demand, impacting corporate profits.
- Real Assets: Commodities (like gold, oil, and agricultural products) and real estate are often considered inflation hedges because their value tends to rise with general price levels.
Investors use CPI data to assess the inflationary environment and make strategic adjustments to their portfolios, aiming to preserve and grow their real wealth.
Business Decisions and Economic Policy
For businesses, inflation influences pricing strategies, wage negotiations, and inventory management. Businesses need to monitor input costs (measured by the Producer Price Index, or PPI, which tracks prices from the seller’s perspective) and consumer prices (CPI) to maintain profitability and competitiveness.
Central banks, such as the U.S. Federal Reserve, closely monitor the CPI (and other inflation measures like the Personal Consumption Expenditures, or PCE, price index) to guide monetary policy. If inflation is rising above their target (typically around 2%), they may raise interest rates to cool the economy and bring prices back down. Conversely, if inflation is too low, they might lower rates to stimulate spending. The CPI is therefore a key piece of information that shapes the interest rates on loans, mortgages, and savings accounts.
Limitations and Alternative Perspectives on Measuring Inflation
While the CPI is an invaluable tool, it’s not without its limitations, and understanding these can provide a more nuanced view of inflation.
The CPI’s Imperfections: Why Your Experience Might Differ
The CPI aims to represent the “average” urban consumer, but no single average perfectly captures the experience of every individual. Several factors can lead to a discrepancy between the official CPI and an individual’s perception of inflation:
- Substitution Bias: When the price of a good rises significantly, consumers often substitute it with a cheaper alternative (e.g., buying chicken instead of beef). The CPI, while attempting to account for this, might still overstate the true cost of living increase if it doesn’t fully capture these substitutions in real-time.
- Quality Bias: Over time, goods and services often improve in quality (e.g., a smartphone today is vastly more powerful than one a decade ago). Part of a price increase might be due to improved quality rather than pure inflation. The BLS tries to adjust for quality changes, but it’s a complex task.
- New Goods Bias: The CPI basket is updated periodically, but new products and services can take time to be included, potentially missing early price declines that often accompany new technologies.
- Personal Inflation Rate: Due to differing spending patterns, individuals can experience vastly different inflation rates. A person who spends a large portion of their income on medical care might experience higher inflation than someone who doesn’t, especially if medical costs are rising faster than the overall CPI.
Other Inflation Indicators to Consider
While CPI is prominent, other indicators offer complementary perspectives on price changes:
- Producer Price Index (PPI): Measures the average change over time in the selling prices received by domestic producers for their output. It’s often seen as a leading indicator for consumer inflation, as producers’ costs can eventually be passed on to consumers.
- Personal Consumption Expenditures (PCE) Price Index: Published by the Bureau of Economic Analysis (BEA), the PCE price index is the Federal Reserve’s preferred measure of inflation for monetary policy. It differs from CPI in its formula, weightings, and scope. For instance, PCE includes a broader range of goods and services, and its weighting scheme allows for more dynamic substitution between goods as prices change.
- Employment Cost Index (ECI): Measures changes in the cost of labor, which is a significant component of production costs and can contribute to inflationary pressures.
By examining a mosaic of these indicators, economists and policymakers gain a more robust and comprehensive understanding of inflation.
Conclusion: Empowering Financial Decisions with Inflation Knowledge
The Consumer Price Index is more than just a number; it is a critical instrument for understanding the economic forces that shape our financial lives. By learning how to access, interpret, and calculate inflation using the CPI, you gain a powerful tool to protect your purchasing power, optimize your investments, and make sound personal and business financial decisions. While no single indicator tells the whole story, the CPI remains the bedrock for gauging the cost of living, providing essential insights for anyone looking to navigate the complexities of inflation in the modern economy.
aViewFromTheCave is a participant in the Amazon Services LLC Associates Program, an affiliate advertising program designed to provide a means for sites to earn advertising fees by advertising and linking to Amazon.com. Amazon, the Amazon logo, AmazonSupply, and the AmazonSupply logo are trademarks of Amazon.com, Inc. or its affiliates. As an Amazon Associate we earn affiliate commissions from qualifying purchases.