
In the world of personal finance, investing, and business management, numbers are the primary language of progress. However, raw figures—such as a $500 profit or a $200 expense—rarely tell the whole story. To truly understand the velocity of your financial growth or the severity of a budget deficit, you must master the art of calculating percentage increase and decrease. This mathematical tool provides the necessary context to move beyond surface-level data, allowing you to compare performance across different scales, timeframes, and asset classes.
Whether you are tracking the year-over-year growth of a side hustle, evaluating the volatility of a stock portfolio, or managing a household budget against the backdrop of inflation, understanding percentage changes is the foundation of financial literacy.
The Fundamental Mechanics: Mastering the Math of Growth and Decline
At its core, calculating a percentage change is an exercise in determining the relative difference between two values. In finance, we call these the “initial value” (what you started with) and the “final value” (where you are now). By expressing this difference as a percentage of the starting point, you normalize the data, making it easier to compare a small investment to a large one.
The Universal Formula Explained
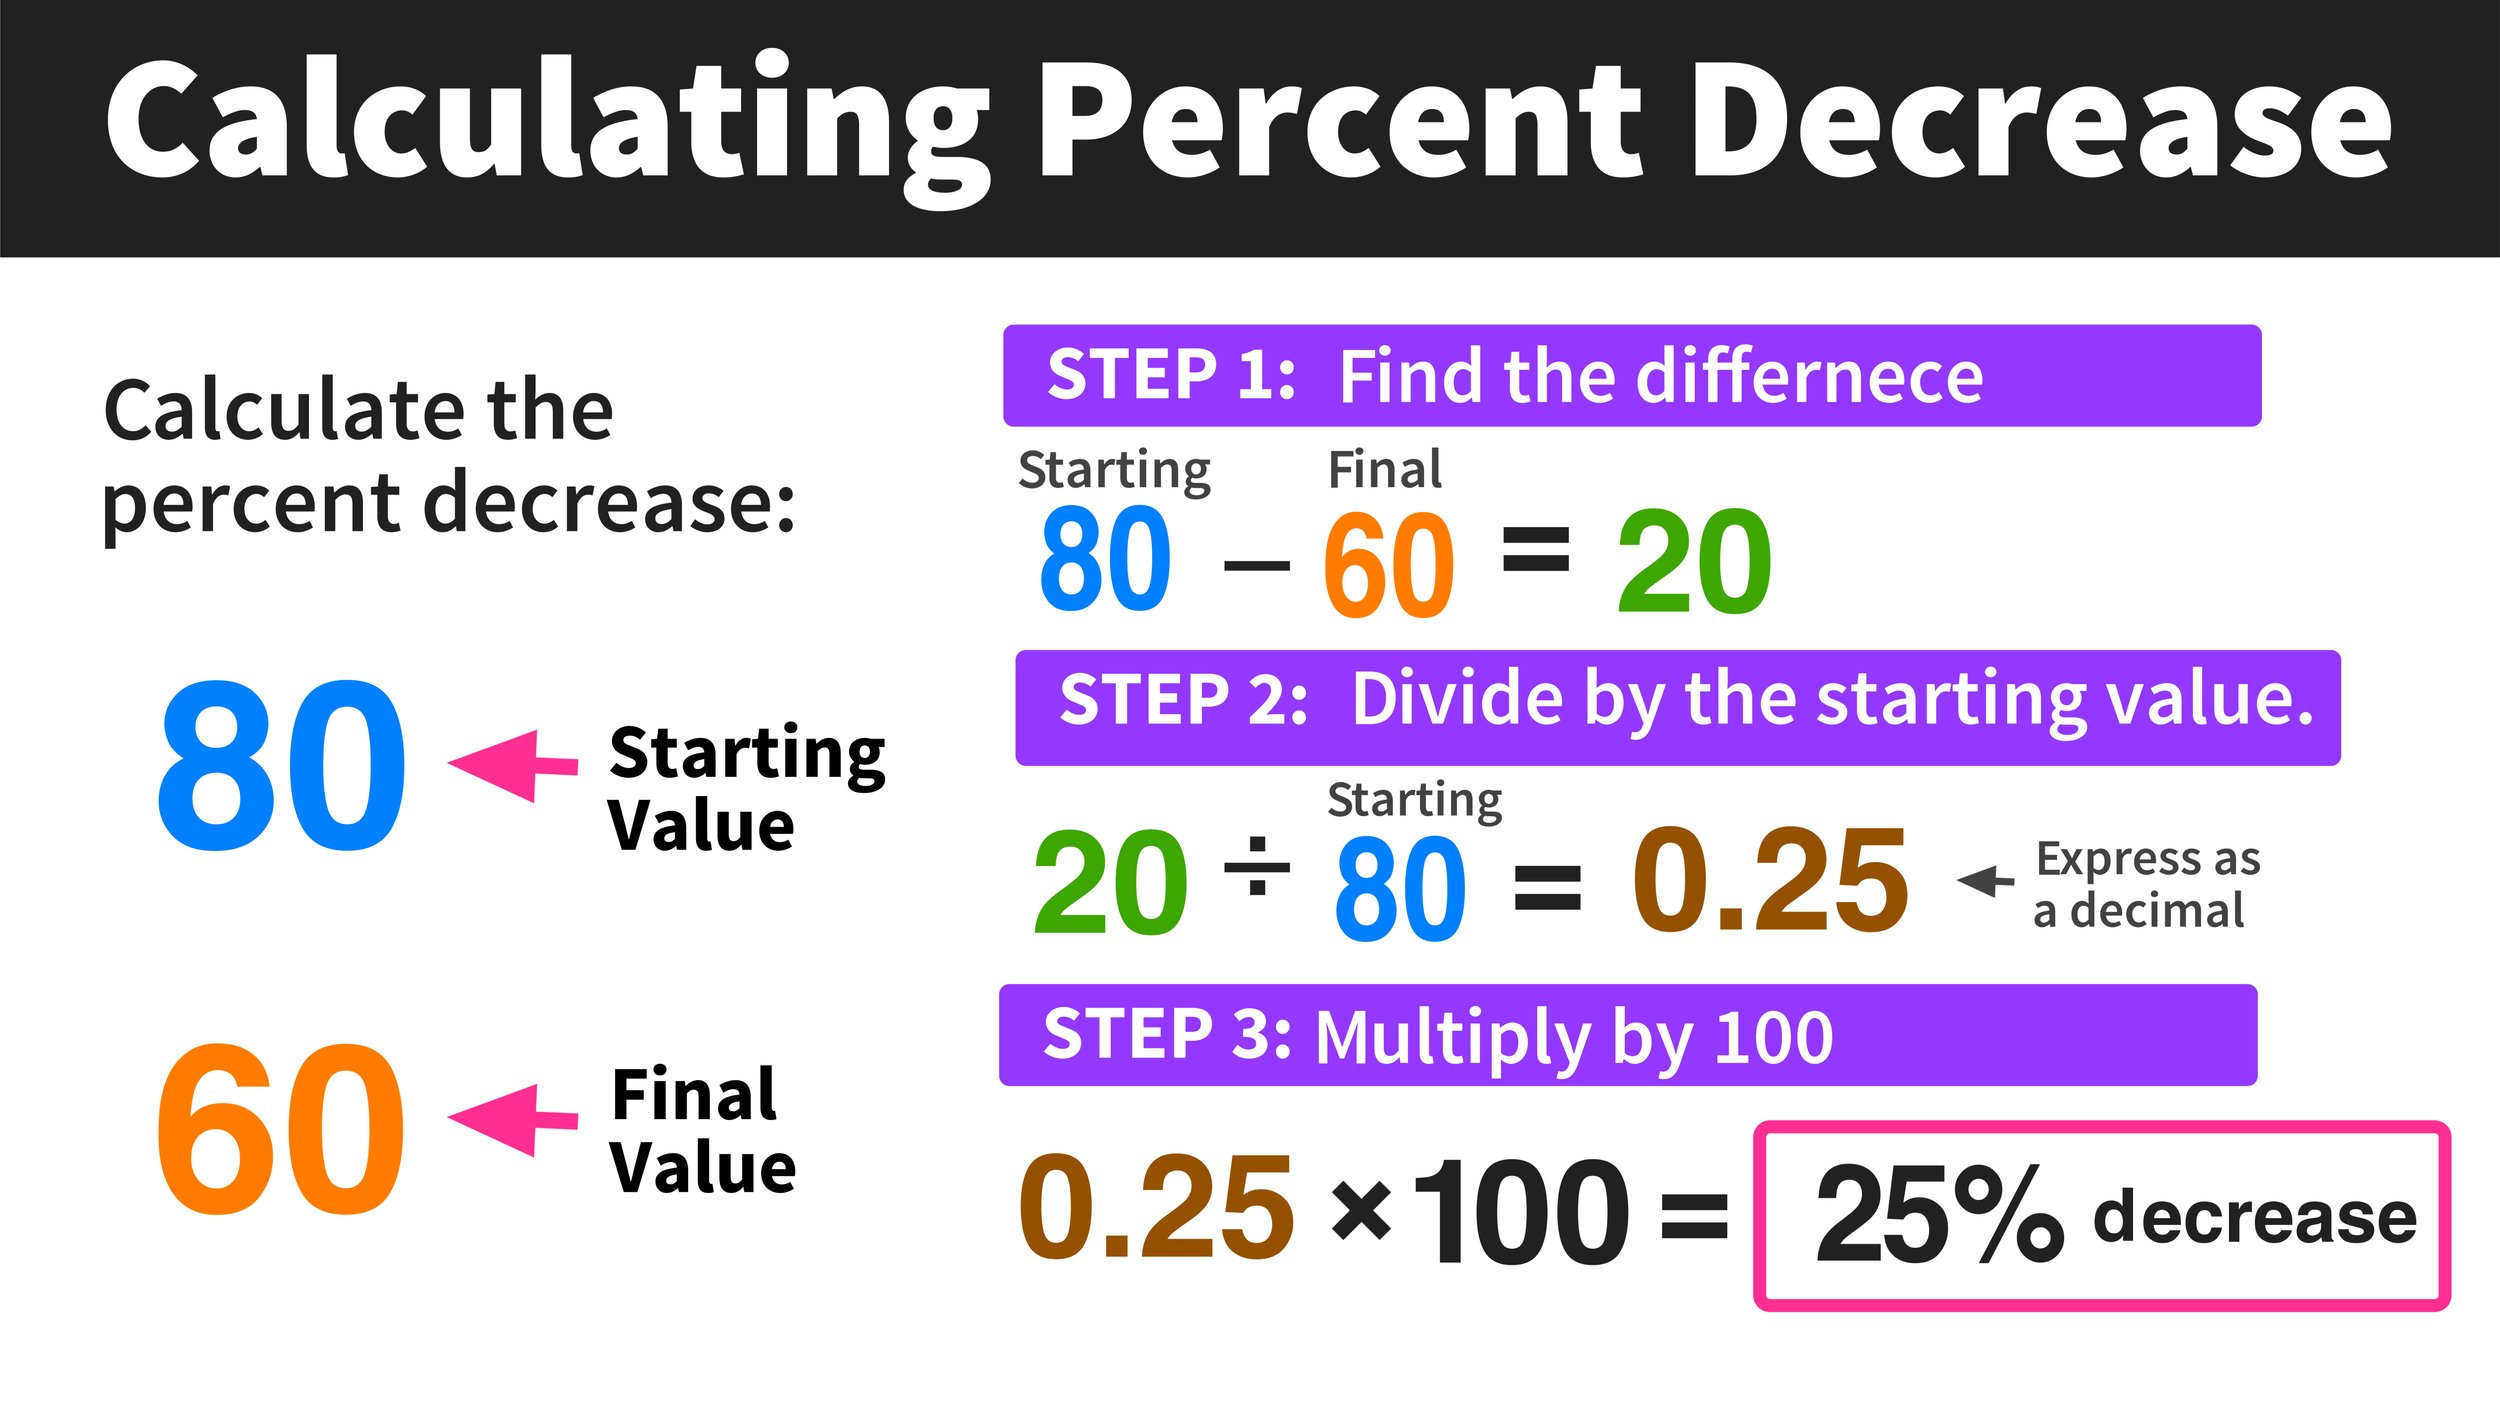
The mathematical path to finding a percentage increase or decrease is identical, regardless of whether the value went up or down. The formula is:
((New Value – Old Value) / |Old Value|) × 100
To apply this in a financial context:
-
Subtract the original value from the new value. This gives you the absolute change. If the result is positive, you have an increase; if negative, you have a decrease.
-
Divide that result by the original value. This converts the absolute change into a decimal representing its relationship to the starting point.
-
Multiply by 100. This converts the decimal into a percentage.
For example, if a share of stock was purchased for $150 (Old Value) and is now worth $180 (New Value), the calculation would be: ($180 – $150) / $150 = 0.20. Multiplying by 100 results in a 20% increase. Conversely, if the stock dropped to $120, the calculation would be: ($120 – $150) / $150 = -0.20, or a 20% decrease.
Why the “Initial Value” is the Critical Anchor
The most common mistake in financial analysis is dividing the change by the new value instead of the old value. In the world of money, your baseline is your risk or your starting capital. By always anchoring the calculation to the original amount, you maintain a consistent perspective on how much your capital has actually worked for you. This consistency is what allows an investor to compare a 5% gain on a $1,000 bond to a 5% gain on a $100,000 real estate investment. While the dollar amounts differ wildly, the efficiency of the capital is identical.
Strategic Applications in Personal Finance and Budgeting
In everyday money management, percentage calculations act as a diagnostic tool. They reveal trends that might be hidden by fluctuating monthly income or seasonal spending habits.
Tracking Cost of Living and Inflation
Inflation is essentially a percentage increase in the price of goods and services over time. For an individual, tracking personal inflation is more valuable than following the general Consumer Price Index (CPI). By calculating the percentage increase in your specific recurring costs—such as rent, groceries, and insurance—you can see exactly how much more income you need to generate just to maintain your current lifestyle.
If your monthly grocery bill was $400 last year and is now $460, you are experiencing a 15% increase in food costs. If your annual salary only increased by 3% during that same period, you have effectively taken a “real” pay cut. Identifying these percentages allows you to make informed decisions about where to trim expenses or when to negotiate a higher salary.
Measuring Savings Rate Progress
For those focused on wealth building, the “savings rate” is perhaps the most important percentage to track. It is the percentage of your take-home pay that remains after all expenses. If you earn $5,000 a month and save $500, your savings rate is 10%.
By using the percentage increase formula, you can track your progress in efficiency. If you find ways to optimize your budget and increase your monthly savings to $750, your savings have increased by 50% in absolute terms, and your savings rate has climbed to 15%. Seeing a “50% increase in monthly savings” is often more motivating than simply seeing an extra $250, as it represents a massive leap in financial discipline and future wealth potential.

Investment Performance: Evaluating Returns with Precision
In the realm of investing, percentages are the only way to objectively measure success. Because different assets require different levels of capital, the only “apples-to-apples” comparison is the rate of return.
Calculating Portfolio Gains and Losses
Investors use percentage change to determine the Return on Investment (ROI). This is vital when rebalancing a portfolio. For instance, you might have two assets: Asset A gained $2,000, and Asset B gained $5,000. At first glance, Asset B looks like the superior performer. However, if Asset A required a $10,000 investment (a 20% increase) and Asset B required a $50,000 investment (a 10% increase), Asset A is actually the more efficient engine for your wealth.
Percentage decrease is equally important for risk management. Professional traders often set “stop-loss” orders at specific percentages—such as 7% or 10% below the purchase price—to protect their capital from catastrophic declines.
The Impact of Compound Interest vs. Absolute Percentage
While percentage increase measures a static change between two points, compound interest represents a series of percentage increases where each new increase is calculated based on the previous total. Understanding how a 7% annual percentage increase compounds over 30 years is the difference between a modest retirement and a wealthy one. This “growth on growth” is the most powerful force in finance, but it begins with the simple ability to calculate a single period’s percentage change.
Business Finance: Driving Decisions with Margin Analysis
For entrepreneurs and business owners, percentage changes are the pulse of the company. They indicate whether a business is scaling healthily or moving toward a liquidity crisis.
Analyzing Revenue Growth and Profit Margins
Revenue growth is almost always discussed in percentages. A company that grows revenue from $1 million to $1.2 million has seen a 20% increase. However, the business owner must also look at the percentage change in expenses. If expenses grew by 30% during that same period, the business is actually becoming less profitable despite the higher revenue.
Profit margin is itself a percentage (Profit / Revenue). By tracking the percentage increase or decrease in margins, a business can identify “scope creep” or rising vendor costs before they threaten the bottom line. A 2% decrease in gross margin might seem negligible, but for a high-volume business, it could represent hundreds of thousands of dollars in lost net income.
Utilizing Percentage Changes for Scaling
When a business decides to scale, it uses percentage-based metrics to determine efficiency. One key metric is the Customer Acquisition Cost (CAC). If a marketing campaign sees a 15% decrease in the cost to acquire a customer while the Lifetime Value (LTV) of that customer remains steady, the business has found a highly efficient lever for growth. These percentage-based insights allow for data-driven decisions rather than emotional guesswork.
The Asymmetry of Loss: A Critical Financial Insight
Perhaps the most insightful application of percentage change is understanding the “Asymmetry of Loss.” This concept explains why protecting your downside is more important than chasing the upside.
The math of percentage decrease is cruel: if you lose a certain percentage of your money, you need a larger percentage increase just to get back to where you started.
-
If your investment loses 10%, you need an 11.1% gain to break even.
-
If your investment loses 25%, you need a 33.3% gain to break even.
-
If your investment loses 50%, you need a 100% gain to break even.
This mathematical reality is why sophisticated investors focus heavily on minimizing percentage decreases. A portfolio that avoids large percentage drawdowns can grow much faster over time than a volatile portfolio that experiences massive gains followed by massive losses, even if the “average” return seems similar.

Conclusion: The Power of Relative Thinking
Mastering how to find a percentage increase or decrease is more than just a mathematical exercise; it is a shift in mindset. It moves you from “absolute thinking” (how many dollars did I make?) to “relative thinking” (how efficient is my money?). In the landscape of money, where inflation, taxes, and market volatility are constantly shifting the value of a dollar, the ability to calculate and interpret percentage changes is your most reliable compass. By applying these formulas to your budget, your investments, and your business ventures, you gain the clarity needed to build sustainable, long-term wealth.
aViewFromTheCave is a participant in the Amazon Services LLC Associates Program, an affiliate advertising program designed to provide a means for sites to earn advertising fees by advertising and linking to Amazon.com. Amazon, the Amazon logo, AmazonSupply, and the AmazonSupply logo are trademarks of Amazon.com, Inc. or its affiliates. As an Amazon Associate we earn affiliate commissions from qualifying purchases.