In the intricate world of personal finance, investing, and business operations, percentages are not merely mathematical constructs; they are the fundamental language through which we understand value, growth, risk, and opportunity. From calculating discounts on a sale item to analyzing investment returns, setting budgets, or determining profit margins, the ability to accurately figure out percentages is an indispensable skill. It empowers individuals and businesses to make informed decisions, track progress, and strategically plan for the future. Without a firm grasp of percentages, navigating financial landscapes is akin to sailing without a compass.

This guide will demystify percentages, breaking down the core concepts and illustrating their myriad applications exclusively within the realm of money. We’ll explore various calculation methods, provide practical financial examples, and equip you with the knowledge to wield this powerful tool with confidence, ultimately enhancing your financial acumen and decision-making capabilities.
The Ubiquitous Role of Percentages in Finance
Percentages are more than just numbers; they represent parts of a whole, scaled to a base of one hundred. This universal scaling makes them incredibly useful for comparing quantities, rates, and changes across different contexts, which is particularly vital in finance where diverse figures need standardization for meaningful analysis.
Understanding the Core Concept
At its simplest, a percentage means “per hundred.” So, 25% means 25 out of 100, or 25/100. This fraction can also be expressed as a decimal, 0.25. The conversion between fractions, decimals, and percentages is the bedrock of all percentage calculations. To convert a percentage to a decimal, divide by 100 (e.g., 50% = 50/100 = 0.50). To convert a decimal to a percentage, multiply by 100 (e.g., 0.75 = 0.75 * 100 = 75%). Understanding this interchangeability is key to manipulating financial figures effectively.
Why Financial Literacy Demands Percentage Proficiency
In the financial sphere, percentages provide a standardized way to interpret and communicate quantitative information. Consider these scenarios:
- Discounts and Sales: A store offers “20% off all electronics.” Without understanding percentages, you can’t quickly calculate the final price or the savings.
- Interest Rates: Whether it’s the interest on your savings account, a mortgage, or a credit card, interest is almost always expressed as an annual percentage rate (APR). Your financial health directly depends on understanding these percentages.
- Investment Returns: When an investment advisor speaks of a “7% annual return,” you need to comprehend what that means for your principal over time. Similarly, understanding capital gains or losses as a percentage helps gauge portfolio performance.
- Budgeting: Allocating “30% of your income to housing” or “15% to savings” requires percentage calculations to determine actual dollar amounts.
- Taxes: Income tax brackets, sales tax, property tax – all are calculated as percentages of a base amount.
- Business Metrics: Profit margins, market share, sales growth, and cost reductions are all routinely expressed and analyzed using percentages, forming the bedrock of financial reporting and strategic planning.
The ability to accurately compute and interpret these percentages is not just a mathematical exercise; it’s a critical life skill that empowers individuals to manage their money effectively and businesses to thrive.
Mastering Fundamental Percentage Calculations
While the basic concept is simple, percentages can be applied in various ways. Mastering these fundamental calculations is essential for anyone dealing with money.
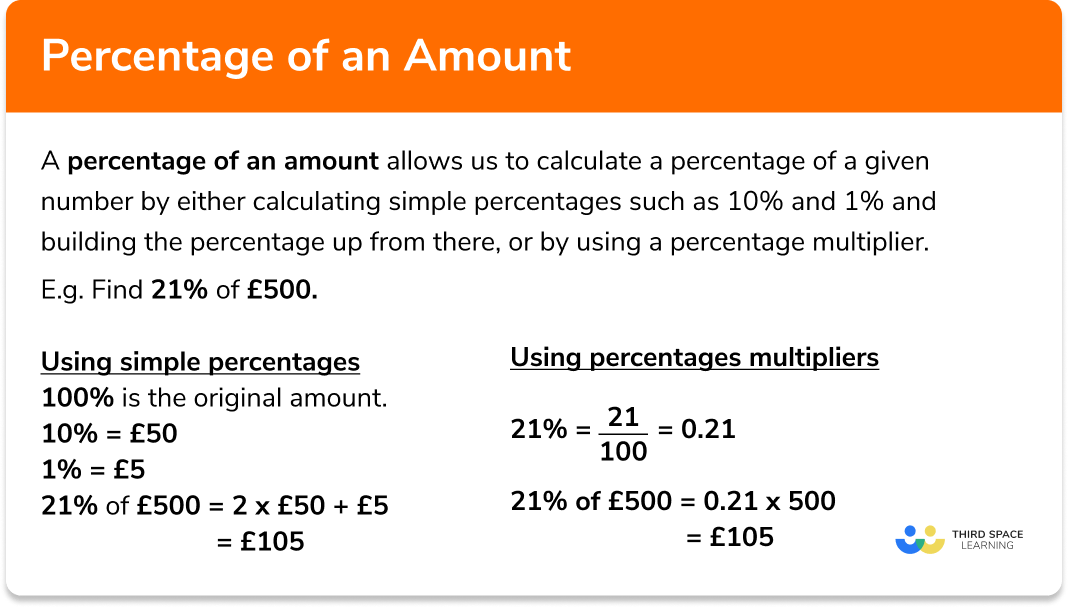
Calculating a Percentage Of a Number (Discounts, Taxes, Commissions)
This is perhaps the most common percentage calculation. You have a total amount, and you want to find a specific percentage of that amount.
Formula: Percentage (as decimal) * Total Amount
Financial Examples:
- Discounts: A new laptop costs $1,200, and there’s a 15% discount.
- 15% as a decimal is 0.15.
- Discount amount = 0.15 * $1,200 = $180.
- Final price = $1,200 – $180 = $1,020.
- Sales Tax: Your new couch costs $800, and the sales tax is 8%.
- Sales tax amount = 0.08 * $800 = $64.
- Total cost = $800 + $64 = $864.
- Commissions: A salesperson earns a 10% commission on sales of $5,000.
- Commission earned = 0.10 * $5,000 = $500.
Determining One Number as a Percentage Of Another (Profit Margins, Budget Allocation)
This calculation helps you understand what proportion one value represents in relation to a larger whole.
Formula: (Part / Whole) * 100
Financial Examples:
- Profit Margins: A business sells an item for $50 and it cost $30 to produce. The profit is $20.
- Profit margin = ($20 / $50) * 100 = 40%. (This is a gross profit margin if $30 is Cost of Goods Sold).
- Budget Allocation: You earn $4,000 per month and spend $1,200 on rent.
- Percentage of income spent on rent = ($1,200 / $4,000) * 100 = 30%.
- Investment Portfolio Diversification: If you have $10,000 in stocks and your total portfolio is $50,000.
- Percentage in stocks = ($10,000 / $50,000) * 100 = 20%.
Quantifying Change: Percentage Increase and Decrease (Investment Growth, Inflation)
Understanding percentage change is crucial for evaluating growth, decline, and performance over time.
Formula: ((New Value - Old Value) / Old Value) * 100
- If the result is positive, it’s a percentage increase.
- If the result is negative, it’s a percentage decrease.
Financial Examples:
- Investment Growth: Your stock portfolio was worth $20,000 last year and is now worth $23,000.
- Percentage increase = (($23,000 – $20,000) / $20,000) * 100 = ($3,000 / $20,000) * 100 = 15%.
- Inflation: A basket of goods cost $100 last year and costs $103 this year.
- Inflation rate = (($103 – $100) / $100) * 100 = ($3 / $100) * 100 = 3%.
- Cost Reduction: A company reduced its operating costs from $500,000 to $450,000.
- Percentage decrease = (($450,000 – $500,000) / $500,000) * 100 = (-$50,000 / $500,000) * 100 = -10%. (A 10% decrease).
The Art of Reverse Percentages (Original Price, Pre-Tax Income)
Sometimes you know the result of a percentage change and need to find the original amount. This is often called “reverse percentages.”
Formula: Original Amount = Final Amount / (1 +/- Percentage as decimal)
- Use
+for increases (e.g., adding tax). - Use
-for decreases (e.g., discounts).
Financial Examples:
- Original Price After Discount: You bought an item on sale for $80, which was advertised as 20% off. What was the original price?
- Here, 20% off means you paid 80% (100% – 20%) of the original price.
- Original Price = $80 / (1 – 0.20) = $80 / 0.80 = $100.
- Pre-Tax Income: Your take-home pay is $3,500 after a 15% income tax deduction. What was your gross income?
- You received 85% (100% – 15%) of your gross income.
- Gross Income = $3,500 / (1 – 0.15) = $3,500 / 0.85 ≈ $4,117.65.
Practical Applications: Percentages in Action
The true power of understanding percentages comes alive when applied to real-world financial scenarios.
Personal Finance Management: Budgeting, Savings, and Debt
- Budgeting: The “50/30/20 rule” (50% needs, 30% wants, 20% savings/debt repayment) is a popular budgeting framework that entirely relies on percentages. Knowing your income, you can quickly calculate the dollar amounts for each category.
- Savings Goals: If you want to save $10,000 in a year and can save 15% of your $3,000 monthly income, you can determine if your goal is realistic: 0.15 * $3,000 = $450/month. $450 * 12 = $5,400/year. This reveals you’d need to either save a higher percentage or earn more.
- Debt Repayment: Calculating the percentage of your income dedicated to debt payments (debt-to-income ratio) is crucial for financial health and loan applications. Lenders often look for ratios below a certain percentage.
Investment Decisions: Understanding Returns and Risk
- Return on Investment (ROI): This is the ultimate metric for an investment, always expressed as a percentage. ROI = ((Current Value of Investment – Cost of Investment) / Cost of Investment) * 100. It allows for comparison of different investment opportunities regardless of their initial cost.
- Portfolio Allocation: Investors decide to allocate a certain percentage of their portfolio to stocks, bonds, real estate, etc., based on their risk tolerance and financial goals. For example, a 70/30 stock-to-bond allocation.
- Dividend Yield: For income-generating investments, dividend yield (annual dividends per share / price per share * 100) tells you the percentage return on your investment from dividends alone.
Business Finance: Pricing, Profitability, and Growth Metrics
- Pricing Strategy: Businesses use markups and margins, both percentage-based, to price products competitively while ensuring profitability. Markup is a percentage of cost, while margin is a percentage of selling price.
- Profitability Analysis: Gross profit margin, operating profit margin, and net profit margin are all critical percentages that gauge a company’s efficiency and overall financial health. They show how much profit is generated for every dollar of revenue.
- Sales Growth: Measuring sales growth year-over-year as a percentage helps businesses track performance and set future targets.
- Cost of Goods Sold (COGS) as a Percentage of Revenue: This ratio helps businesses understand the efficiency of their production or purchasing.
Advanced Scenarios and Strategic Thinking
Beyond the basics, percentages unlock deeper insights into complex financial concepts.
Compound Interest and Exponential Growth
Compound interest, often called the “eighth wonder of the world,” relies heavily on percentage calculations. It’s interest earned on both the initial principal and the accumulated interest from previous periods.
Formula for Future Value with Compound Interest: FV = P * (1 + r)^n
Where P = principal, r = annual interest rate (as decimal), n = number of years.
Understanding this allows you to project the growth of savings, investments, or the total cost of loans over time, revealing the exponential power of even small percentage rates over long durations.
Financial Ratios and Performance Analysis
Businesses and investors frequently use a suite of financial ratios, almost all of which are percentages, to analyze a company’s liquidity, solvency, efficiency, and profitability. Examples include:
- Current Ratio: Current Assets / Current Liabilities (often expressed as a ratio, but understanding what percentage of liabilities can be covered by assets is implied).
- Debt-to-Equity Ratio: Total Debt / Shareholder Equity (indicates the percentage of financing coming from debt versus equity).
- Return on Equity (ROE): Net Income / Shareholder Equity * 100 (shows how much profit a company generates for each dollar of shareholders’ equity).
These ratios provide a standardized way to compare companies within an industry or to track a company’s performance over time, offering a comprehensive picture that raw dollar figures alone cannot provide.
Leveraging Tools and Avoiding Common Pitfalls
While mental math is useful for quick estimates, accuracy is paramount in financial matters.
Utilizing Calculators and Spreadsheets for Accuracy
- Basic Calculators: For simple calculations, any scientific or even smartphone calculator can handle percentages. Most have a ‘%’ button that performs operations like adding or subtracting a percentage.
- Spreadsheets (Excel, Google Sheets): For more complex or recurring calculations, spreadsheets are invaluable. They allow you to set up formulas once and apply them to numerous data points, minimizing errors and speeding up analysis. For example, you can calculate ROI for an entire portfolio or model different budget scenarios.
- Online Financial Calculators: Many websites offer specialized calculators for mortgages, loan amortization, retirement planning, and compound interest, pre-programmed with the necessary percentage formulas.
Common Errors and How to Mitigate Them
- Misinterpreting the Base: Ensure you’re calculating the percentage of the correct whole. For example, when calculating profit margin, ensure you divide by revenue, not cost. For reverse percentages, remember you’re finding the original total, not just the percentage portion.
- Decimal Conversion Errors: The most frequent mistake is forgetting to convert percentages to decimals (by dividing by 100) before multiplying, or vice versa. Always double-check this step.
- Additive vs. Multiplicative Discounts: A “20% off, then an additional 10% off” is not 30% off. It’s 20% off the original, then 10% off the new, discounted price. Always apply percentages sequentially.
- Confusing Percentage Change with Percentage Points: If an interest rate goes from 5% to 7%, that’s a 2 percentage point increase. As a percentage change, it’s ((7-5)/5)*100 = 40% increase. The distinction is vital for accuracy.
In conclusion, the ability to figure out percentages is far more than a basic math skill; it is a critical component of financial literacy and a cornerstone for sound decision-making in personal and business finance. By understanding the core concepts, mastering fundamental calculations, and applying them strategically, you gain an invaluable tool for analyzing financial data, managing your money, and confidently navigating the economic world around you.
aViewFromTheCave is a participant in the Amazon Services LLC Associates Program, an affiliate advertising program designed to provide a means for sites to earn advertising fees by advertising and linking to Amazon.com. Amazon, the Amazon logo, AmazonSupply, and the AmazonSupply logo are trademarks of Amazon.com, Inc. or its affiliates. As an Amazon Associate we earn affiliate commissions from qualifying purchases.