
In the intricate world of finance, numbers tell stories. They reveal growth, pinpoint areas of concern, and illuminate pathways to prosperity. Among the myriad calculations that form the bedrock of financial analysis, understanding “percent increase” stands out as a singularly powerful and indispensable tool. Whether you’re tracking your investment portfolio’s performance, assessing a company’s revenue growth, or simply understanding how much your salary has truly risen compared to inflation, the ability to accurately figure out percent increase is a fundamental skill. It transforms raw data into actionable insights, enabling informed decision-making for individuals and businesses alike.
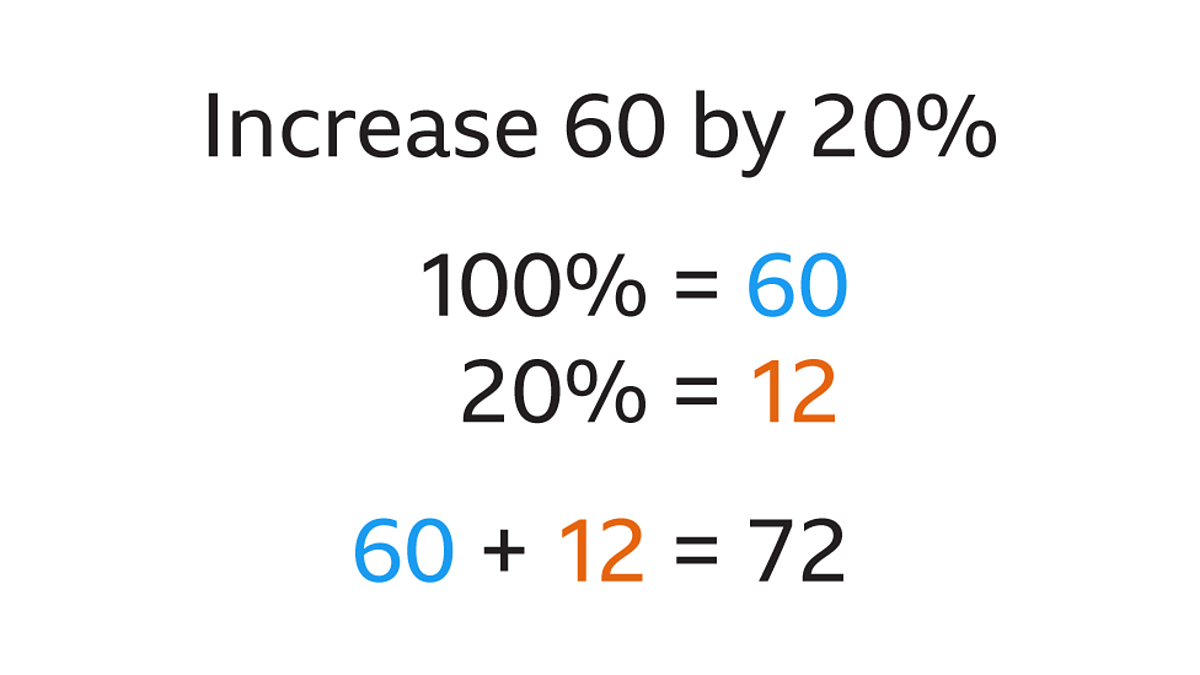
This guide delves deep into the mechanics and manifold applications of percent increase within the realm of money. We’ll demystify the core formula, explore its critical role in personal finance and investing, uncover its strategic importance in business finance, and highlight common pitfalls to ensure you leverage this metric with precision and confidence. By the end, you’ll not only know how to calculate percent increase but also why it’s a cornerstone of financial literacy and strategic planning.
The Core Mechanics: Deconstructing the Percent Increase Formula
At its heart, calculating percent increase is a straightforward mathematical operation designed to quantify the relative change between two values. It answers the question: “By what percentage has a value grown from its original state?” This simplicity, however, belies its profound utility across financial disciplines.
The Foundational Calculation
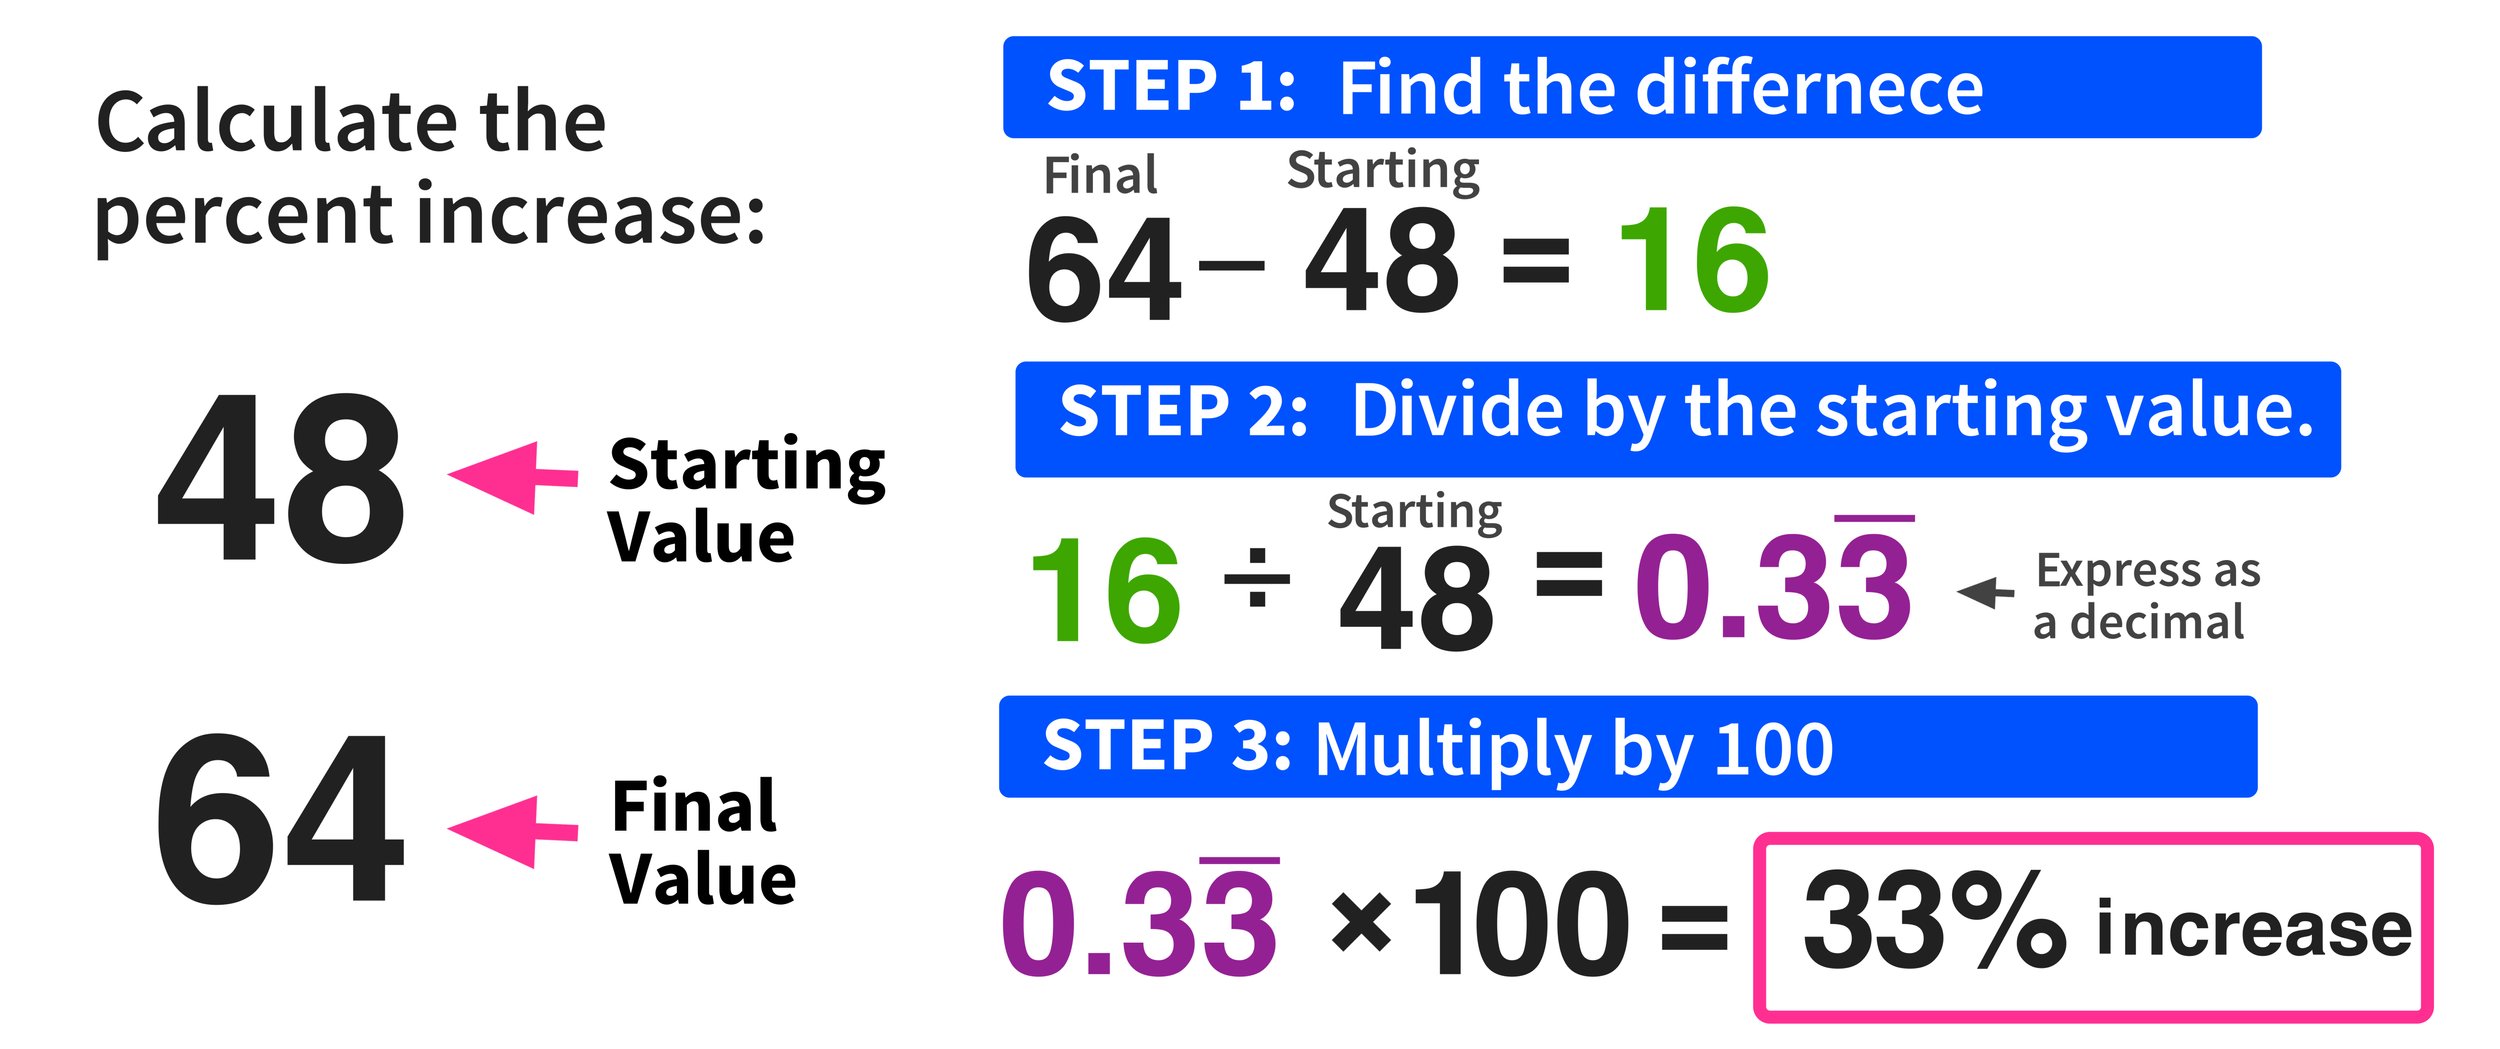
The formula for percent increase is universally applied and relatively easy to grasp:
$$ text{Percent Increase} = left( frac{text{New Value} – text{Old Value}}{text{Old Value}} right) times 100% $$
Let’s illustrate with a simple financial example. Imagine you invested $1,000 in a particular stock, and a year later, its value grew to $1,250.
Here, the Old Value is $1,000, and the New Value is $1,250.
$$ text{Percent Increase} = left( frac{$1,250 – $1,000}{$1,000} right) times 100% $$
$$ text{Percent Increase} = left( frac{$250}{$1,000} right) times 100% $$
$$ text{Percent Increase} = 0.25 times 100% $$
$$ text{Percent Increase} = 25% $$
This calculation tells us that your investment increased by 25%. This single number provides a far more intuitive understanding of growth than simply stating it went up by $250, especially when comparing it to other investments of different initial sizes.
Understanding Each Component
To truly leverage this formula, it’s essential to understand the role of each component:
-
New Value: This is the later, larger, or current value you are measuring. In financial terms, it could be your current portfolio balance, a company’s recent quarterly revenue, or your latest salary.
-
Old Value (Base Value): This is the original, earlier, or starting value against which you are comparing the new value. It acts as the baseline for your percentage calculation. In our example, it was your initial investment. The choice of the correct ‘Old Value’ is critical, as it defines the reference point for your growth assessment.
-
The Difference (New Value – Old Value): This initial subtraction yields the absolute monetary or numerical change between the two periods. It shows the raw increase.
-
Division by Old Value: This step normalizes the absolute change, expressing it as a proportion of the original amount. This is what allows for meaningful comparisons across different scales. Without this step, a $100 increase on a $1,000 investment would seem the same as a $100 increase on a $10,000 investment, which is clearly not true in relative terms.
-
Multiplication by 100%: Finally, converting the decimal into a percentage makes the figure more readable and relatable, fitting the common language of financial reporting and analysis.
Interpreting the Result
A positive percent increase unequivocally signifies growth or improvement. For example, a 15% increase in quarterly profits indicates a healthy expansion, while a 3% increase in living expenses helps you track inflation’s impact. Conversely, if the “New Value” were less than the “Old Value,” the result would be a negative percentage, indicating a decrease. While this article focuses on increase, understanding that the same formula with a negative outcome signals a decline is an important related concept for comprehensive financial analysis.
Percent Increase in Personal Finance: Tracking Your Wealth Journey
For individuals, understanding percent increase is not just an academic exercise; it’s a vital skill for managing personal finances, planning for the future, and making savvy financial decisions. It empowers you to objectively assess your financial health and progress.
Gauging Investment Performance
One of the most common and crucial applications of percent increase in personal finance is evaluating investment performance.
-
Stocks and Funds: Calculating the percent increase of your stock holdings or mutual funds helps you understand the actual return on your capital. If you buy a stock at $50 and sell it at $65, that’s a 30% increase. Comparing this to other investments, or to benchmark indices, provides a clear picture of your investment’s success.
-
Real Estate: When assessing property values, knowing the percent increase from purchase price to current market value is fundamental. This helps determine equity growth and potential profit upon sale, less any expenses.
-
Annual vs. Cumulative Returns: It’s important to distinguish between annual percentage increase (growth over a single year) and cumulative percentage increase (growth over multiple years). Annualized returns, which account for compounding, offer a more standardized way to compare investment performance over different time horizons.
Analyzing Income Growth and Cost of Living
Your income is the engine of your financial life, and understanding its growth in percentage terms is crucial.
-
Salary Raises: A “5% raise” sounds good, but what does it really mean? Calculating the percent increase in your actual take-home pay allows you to see the tangible impact.
-
Inflation and Purchasing Power: Perhaps even more critical is comparing your income’s percent increase to the percent increase in the cost of living, often measured by the Consumer Price Index (CPI). If your salary increases by 3% but inflation is 4%, your real purchasing power has actually decreased by 1%, despite a nominal income increase. This nuanced understanding is vital for maintaining your standard of living.
Smart Budgeting and Expense Management
Effective budgeting relies on understanding where your money goes and how those expenditures change over time.
-
Category Spending: By tracking the percent increase or decrease in spending categories (e.g., groceries, entertainment, utilities) month-over-month or year-over-year, you can identify trends. A sudden 15% increase in utility bills might prompt an investigation into energy efficiency, while a consistent 10% increase in dining out could signal a need to adjust habits.
-
Savings Rate: Calculating the percent increase in your savings balance is a powerful motivator. Watching your retirement account grow by 8% this year, or your emergency fund increase by 20% in six months, provides tangible evidence of your financial discipline paying off.
Monitoring Debt and Savings Growth
Understanding percent increase applies to both sides of your personal balance sheet:
-
Debt Interest: While focusing on increase, it’s also relevant to understand the percent increase in your debt due to interest charges. A credit card balance can increase significantly if only minimum payments are made, driven by high interest percentages.
-
Savings Accounts: Conversely, observing the percentage increase in your savings or investment accounts due to interest or dividends showcases the power of compounding and highlights the value of consistent saving.
Strategic Applications in Business Finance
For businesses, calculating percent increase is an indispensable tool for strategic planning, performance evaluation, and investor communication. It provides a clear, standardized way to measure progress and identify trends that impact profitability and sustainability.
Measuring Revenue and Profitability Growth
These are perhaps the most frequently analyzed metrics using percent increase in business.
-
Revenue Growth: A company’s top-line growth is often expressed as a percent increase year-over-year (YoY) or quarter-over-quarter (QoQ). For example, “Q3 revenue increased by 12% compared to Q3 last year.” This is a key indicator of market demand and business expansion.
-
Profitability Metrics: Net profit, gross profit, and operating income are all crucial metrics that benefit from percent increase analysis. An increase in net profit margin percentage signifies improved efficiency or pricing power, which is highly valued by investors.
-
Sales Performance: Tracking the percent increase in sales volume or value for specific products, regions, or customer segments helps sales teams identify successes and areas needing attention.
Evaluating Operational Efficiency
Businesses constantly strive to optimize operations, and percent increase helps quantify these efforts.
-
Cost Reduction: If a company reduces its manufacturing costs from $10 per unit to $8 per unit, that’s a 20% decrease, but measuring the percent increase in efficiency (e.g., units produced per hour) can be equally insightful.
-
Productivity Metrics: An increase in the average revenue per employee, or a reduction in customer service resolution time, can be expressed as a beneficial percent increase, indicating improved operational effectiveness.
-
Inventory Turnover: Analyzing the percent increase in inventory turnover can reveal how efficiently a company is managing its stock and converting it into sales.
Market Share and Sales Performance
Understanding a company’s position within its competitive landscape often involves percent increase.
-
Market Share Expansion: A company might announce that its market share increased from 15% to 18%. While the raw percentage points are a valid metric, understanding the percent increase in its own market share (e.g., a 20% increase from 15% to 18%) gives another perspective on its competitive growth.
-
Customer Acquisition: Tracking the percent increase in new customers acquired over a period, or the percent increase in customer retention rates, are vital for marketing and sales strategies.
Forecasting and Budgeting
Historical percent increases serve as critical inputs for financial forecasting and setting future budgets.
-
Sales Projections: If historical sales have shown a consistent 8% year-on-year increase, this trend can be used to project future sales figures, informing production, inventory, and staffing decisions.
-
Expense Budgeting: Similarly, understanding the typical percent increase in raw material costs, labor expenses, or administrative overhead allows companies to build realistic budgets and allocate resources effectively.
Common Pitfalls and Advanced Nuances
While the percent increase formula is deceptively simple, its accurate and insightful application requires an awareness of several common pitfalls and advanced considerations. Ignoring these can lead to misinterpretations and flawed financial conclusions.
The Base Effect: When Small Numbers Skew Perception
One of the most significant traps is the “base effect.” A large percent increase can seem impressive but might be less significant in absolute terms if the initial ‘Old Value’ (the base) was very small.
-
Example: A startup going from $1,000 in monthly revenue to $10,000 sees a 900% increase. While impressive, a larger, established company increasing its revenue from $1 million to $1.2 million, a 20% increase, adds far more absolute dollars to its top line.
-
Insight: Always consider the absolute change alongside the percentage. A 100% increase from $1 to $2 is less impactful than a 10% increase from $1 million to $1.1 million, despite the former’s higher percentage. Context is paramount.
Annualized vs. Absolute Growth Rates
When dealing with financial data over varying timeframes, distinguishing between absolute and annualized growth rates is crucial for fair comparison.
-
Absolute Growth: This is the straightforward percent increase over a specific, often irregular, period (e.g., “my investment grew by 35% in 18 months”).
-
Annualized Growth: This calculation extrapolates the growth to an annual basis, allowing for comparison of investments or returns over different durations. For example, a 35% growth in 18 months needs to be annualized to compare it meaningfully to an investment that grew 20% in 12 months. This often involves more complex formulas like Compound Annual Growth Rate (CAGR), which accounts for compounding.
-
Insight: For comparing different investment opportunities or company performances, especially those spanning different lengths of time, annualized growth rates typically provide a more accurate and standardized metric.
Adjusting for Inflation: Real vs. Nominal Percent Increase
Inflation, the general increase in prices and fall in the purchasing value of money, can significantly distort the perception of financial growth.
-
Nominal Increase: This is the raw percent increase in monetary terms, without accounting for inflation (e.g., your salary increased by 5%).
-
Real Increase: This adjusts the nominal increase for the effects of inflation to show the true growth in purchasing power. If your salary nominally increased by 5% but inflation was 3%, your real increase is approximately 2%.
-
Insight: For long-term financial planning, investment analysis, and assessing true economic progress, always strive to understand real percent increases. A significant nominal increase might be entirely eroded by inflation, leaving you no better off, or even worse.
Beyond Simple Numbers: Context is King
Finally, remember that a percentage increase is just one data point. It must always be viewed within its broader financial, economic, and operational context.
-
Industry Trends: A 10% increase might be stellar in a stagnant industry but subpar in a rapidly growing one.
-
Economic Conditions: Growth during a recession holds different weight than growth during a boom.
-
Company-Specific Factors: A surge in revenue might be due to a one-time asset sale rather than sustainable core business growth.
-
Insight: Use percent increase as a starting point for deeper investigation, not as the sole arbiter of success or failure. Combine it with other financial ratios, qualitative analysis, and a thorough understanding of underlying factors.

Conclusion
The ability to accurately figure out percent increase is more than just a mathematical skill; it’s a fundamental pillar of financial literacy. From dissecting your personal investment returns and understanding the true impact of inflation on your wages, to evaluating the growth trajectory of a business and making informed strategic decisions, percent increase provides clarity and perspective.
By mastering the core formula, recognizing its diverse applications across personal and business finance, and being mindful of the common pitfalls and advanced nuances, you empower yourself to navigate the complex financial landscape with greater confidence and insight. Embrace this essential tool, and transform raw numbers into compelling narratives of growth, opportunity, and financial acumen.
aViewFromTheCave is a participant in the Amazon Services LLC Associates Program, an affiliate advertising program designed to provide a means for sites to earn advertising fees by advertising and linking to Amazon.com. Amazon, the Amazon logo, AmazonSupply, and the AmazonSupply logo are trademarks of Amazon.com, Inc. or its affiliates. As an Amazon Associate we earn affiliate commissions from qualifying purchases.