
In the intricate world of personal finance and business operations, few concepts are as ubiquitous and critical as the percentage. From discerning the true value of a discount to understanding the growth trajectory of an investment, percentages serve as the universal language of financial comparison and analysis. They distill complex numerical relationships into easily digestible, comparable figures, empowering individuals and businesses alike to make informed decisions.
Far from being a mere academic exercise, calculating percentages of money is a fundamental skill that underpins effective budgeting, strategic investing, astute business management, and prudent financial planning. It allows us to quantify change, allocate resources, assess risk, and project future outcomes with clarity and precision. This comprehensive guide will demystify the process, exploring the fundamental principles of percentage calculation and illustrating their diverse applications across the financial spectrum, ultimately equipping you with the confidence to navigate your financial landscape with greater proficiency.
The Fundamentals of Percentage Calculation
At its core, a percentage is a way of expressing a number as a fraction of 100. The term “percent” literally means “per hundred,” originating from the Latin “per centum.” This simple concept is incredibly powerful because it standardizes comparisons, allowing us to relate different quantities to a common base.
Understanding What a Percentage Represents
Imagine you have a pie, and you eat a slice. If that slice represents a certain “percentage” of the whole pie, you’re essentially saying how many slices out of 100 equal-sized slices that one piece would be. In financial terms, this means understanding how a specific “part” of your money relates to the “whole” amount of money you are considering.
A percentage is often represented by the symbol “%”. For example, 25% means 25 out of 100, which can also be written as the fraction 25/100 or the decimal 0.25. Converting between these forms is crucial for calculations:
- Fraction to Percentage: Multiply the fraction by 100. (e.g., 1/4 = 0.25 * 100 = 25%)
- Decimal to Percentage: Multiply the decimal by 100. (e.g., 0.75 * 100 = 75%)
- Percentage to Decimal: Divide the percentage by 100. (e.g., 40% / 100 = 0.40)
This foundational understanding is the springboard for all subsequent financial percentage calculations. Without grasping what a percentage truly signifies, applying the formulas becomes a rote exercise rather than an insightful one.
The Basic Percentage Formula
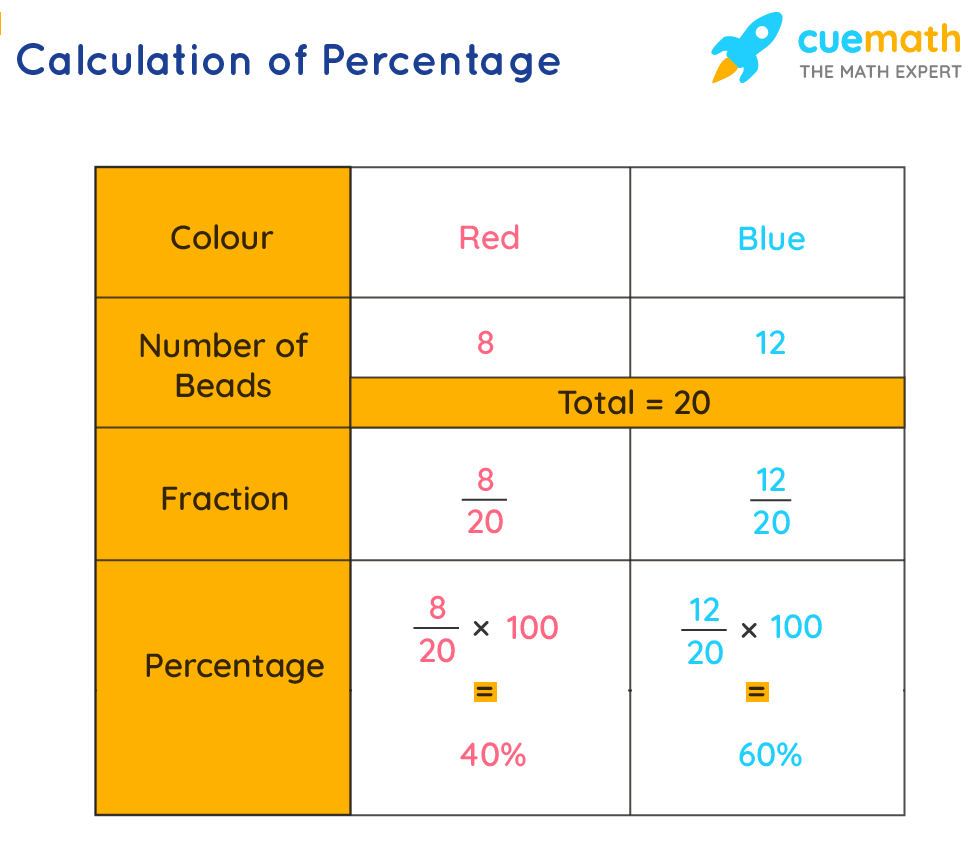
The most fundamental formula for calculating a percentage is straightforward and universally applicable. It answers the question: “What percentage is ‘part’ of ‘whole’?”
Percentage = (Part / Whole) × 100
Let’s break down the components:
- Part: This is the specific amount or portion you are interested in. It could be the amount of a discount, the interest earned, a particular expense category, or the profit made.
- Whole: This is the total amount, the baseline against which the “part” is being compared. It might be your total income, the original price of an item, the principal amount of a loan, or your total investment.
- 100: We multiply by 100 to convert the resulting decimal or fraction into a percentage format.
Example 1: Simple Savings
Suppose you saved $150 out of your $1,200 monthly income. To find out what percentage of your income you saved:
- Part = $150 (saved amount)
- Whole = $1,200 (total income)
- Percentage Saved = ($150 / $1,200) × 100 = 0.125 × 100 = 12.5%
Example 2: Finding a Part of a Whole
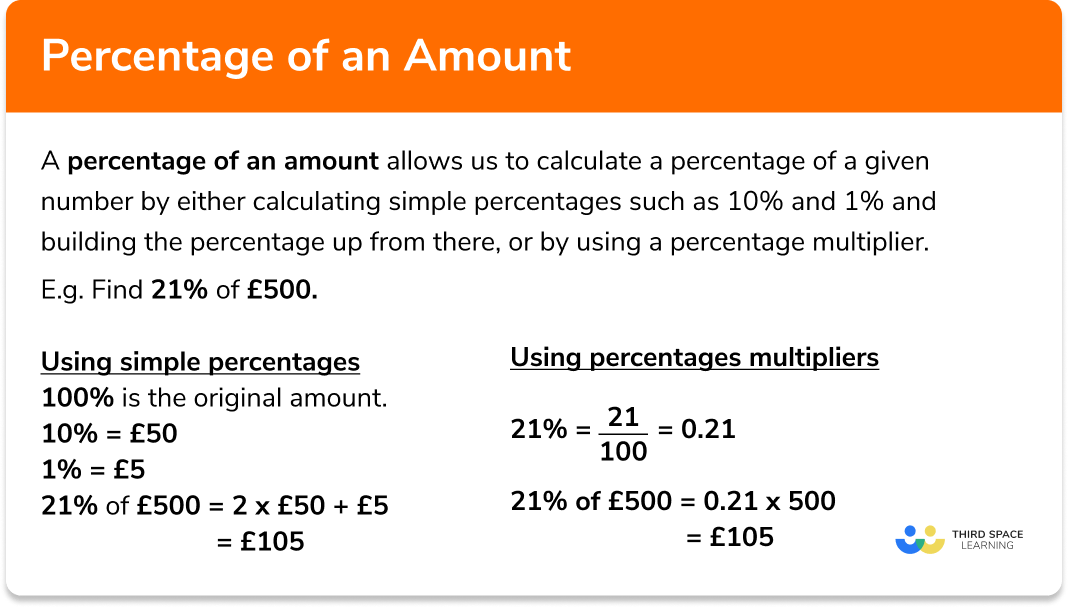
Sometimes, you already know the percentage and the whole, and you need to find the part. For instance, if you want to calculate 30% of $500:
- Convert 30% to a decimal: 30 / 100 = 0.30
- Part = Percentage (as decimal) × Whole
- Part = 0.30 × $500 = $150
Mastering these basic operations is the bedrock of financial literacy, enabling you to dissect and comprehend financial data with ease.
Practical Applications in Personal Finance
Percentages are not abstract concepts; they are the everyday tools that help us manage our personal finances effectively. From budgeting to investing, understanding these calculations is paramount.
Budgeting and Expense Tracking
One of the most critical applications of percentages in personal finance is budgeting. By calculating what percentage of your income goes towards various expenses, you gain clear insight into your spending habits and can identify areas for adjustment.
Example: Budget Allocation
Let’s say your net monthly income is $4,000.
- Rent: $1,200
- Groceries: $600
- Utilities: $200
- Transportation: $300
- Entertainment: $400
- Savings: $500
- Miscellaneous: $800
To find the percentage for each category:
- Rent: ($1,200 / $4,000) × 100 = 30%
- Groceries: ($600 / $4,000) × 100 = 15%
- Utilities: ($200 / $4,000) × 100 = 5%
- Transportation: ($300 / $4,000) × 100 = 7.5%
- Entertainment: ($400 / $4,000) × 100 = 10%
- Savings: ($500 / $4,000) × 100 = 12.5%
- Miscellaneous: ($800 / $4,000) × 100 = 20%
(Total should be 100% or slightly off due to rounding, in this case, it’s 100%)
This breakdown provides a visual and quantitative representation of where your money goes, allowing you to adhere to rules of thumb like the 50/30/20 rule (50% needs, 30% wants, 20% savings/debt repayment) or customize your budget to your specific goals.
Understanding Discounts and Sales
Shopping smart often involves deciphering discounts. Whether it’s “25% off” or “buy one get one 50% off,” percentages are at the heart of sale pricing.
Example: Calculating Savings
An item originally priced at $80 is on sale for 30% off.
- Discount amount = 30% of $80 = 0.30 × $80 = $24
- Sale price = Original price – Discount amount = $80 – $24 = $56
Conversely, if an item is $60 after a 25% discount, what was the original price?
If it’s 25% off, you are paying 100% – 25% = 75% of the original price.
- Original Price = Current Price / (1 – Discount as decimal)
- Original Price = $60 / 0.75 = $80
Understanding these calculations ensures you’re getting the best deal and aren’t misled by marketing ploys.
Interest Rates and Loan Payments
Interest rates are almost always expressed as percentages, whether for savings accounts, credit cards, or mortgages. They dictate how much you earn on savings or how much you pay for borrowing money.
Example: Simple Interest
You deposit $1,000 into a savings account with a 2% annual simple interest rate.
- Annual interest = 2% of $1,000 = 0.02 × $1,000 = $20
For loans and credit cards, the Annual Percentage Rate (APR) tells you the total cost of borrowing as a percentage. While calculating complex interest (like compound interest on a mortgage) requires more sophisticated formulas, understanding the fundamental percentage component is the first step. For instance, knowing that a 15% APR on a credit card means you’ll pay 15% of your outstanding balance annually (prorated monthly) if not paid off.
Investment Returns and Portfolio Allocation
In the world of investing, percentages are indispensable for evaluating performance and managing risk.
Example: Investment Gain/Loss
You invest $5,000 in a stock, and it grows to $5,750.
- Gain = $5,750 – $5,000 = $750
- Percentage Return = ($750 / $5,000) × 100 = 15%
Conversely, if the stock drops to $4,500:
- Loss = $5,000 – $4,500 = $500
- Percentage Loss = ($500 / $5,000) × 100 = 10%
Percentages are also used to analyze portfolio allocation, showing what proportion of your total investments is in stocks, bonds, real estate, etc., guiding diversification strategies. If you have $100,000 invested, and $60,000 is in stocks, then 60% of your portfolio is in stocks.
Advanced Applications in Business and Investment
Beyond personal finance, percentages are the lifeblood of business analysis, guiding strategic decisions, assessing performance, and communicating financial health to stakeholders.
Profit Margins and Business Performance
Businesses rely heavily on percentages to understand their profitability at various levels.
Example: Gross Profit Margin vs. Net Profit Margin
-
Gross Profit Margin: Measures how much revenue is left after accounting for the cost of goods sold (COGS).
- Formula:
(Gross Profit / Revenue) × 100 - If a company sells goods for $1,000,000 (Revenue) and it cost $600,000 to produce them (COGS), the Gross Profit is $400,000.
- Gross Profit Margin = ($400,000 / $1,000,000) × 100 = 40%
This indicates that for every dollar of revenue, 40 cents remain to cover operating expenses and profit.
- Formula:
-
Net Profit Margin: Measures the percentage of revenue that remains after all expenses, including taxes and interest, have been deducted. It’s the ultimate indicator of a company’s profitability.
- Formula:
(Net Profit / Revenue) × 100 - If, from the $400,000 gross profit, operating expenses, interest, and taxes total $300,000, the Net Profit is $100,000.
- Net Profit Margin = ($100,000 / $1,000,000) × 100 = 10%
This means 10 cents of every revenue dollar turns into actual profit for shareholders.
- Formula:
These percentages are critical for comparing a company’s performance against competitors or its own historical data.
Growth Rates and Market Share
Businesses measure success and potential through growth rates, often expressed as percentages.
Example: Year-over-Year Revenue Growth
A company’s revenue was $5,000,000 last year and $6,250,000 this year.
- Revenue Increase = $6,250,000 – $5,000,000 = $1,250,000
- Percentage Growth = ($1,250,000 / $5,000,000) × 100 = 25%
This 25% growth rate is a key metric for investors and management.
Example: Market Share
If the total market for a product is $100,000,000 and a company’s sales are $15,000,000, their market share is:
- Market Share = ($15,000,000 / $100,000,000) × 100 = 15%
Understanding market share is vital for competitive analysis and strategic planning.
Tax Calculations and Financial Planning
Taxes are inherently percentage-based, from income tax rates to sales tax and capital gains tax.
Example: Income Tax
If your taxable income is $70,000, and part of it falls into a 15% tax bracket and another part into a 20% bracket, calculating your total tax liability involves applying these percentages to the respective income portions. Similarly, understanding the percentage of your gross income that goes towards taxes (your effective tax rate) is crucial for financial planning.
Example: Sales Tax
An item costs $50, and the sales tax rate is 7%.
- Sales Tax Amount = 7% of $50 = 0.07 × $50 = $3.50
- Total Cost = $50 + $3.50 = $53.50
Financial planning often involves setting goals like “saving 15% of my income for retirement” or “allocating no more than 30% of my net worth to high-risk investments.” These percentage targets guide long-term financial health.
Tools and Tips for Accurate Calculation
While the formulas are simple, ensuring accuracy in calculations, especially with large sums of money or complex scenarios, is crucial. Fortunately, various tools can help.
Utilizing Calculators and Spreadsheets
For basic percentage calculations, a standard calculator is sufficient. However, for more complex financial scenarios, tracking multiple expenses, or analyzing investment portfolios, spreadsheets like Microsoft Excel or Google Sheets are invaluable.
Spreadsheet Advantages:
- Automation: Formulas can be set up to automatically update calculations as you change inputs.
- Organization: Data can be neatly organized and visualized.
- Functions: Built-in functions simplify complex calculations (e.g.,
SUM,AVERAGE, and direct percentage calculations).- To calculate
Part / Wholeas a percentage in Excel, you simply type=A1/B1(where A1 is Part, B1 is Whole) and then format the cell as a percentage. Excel automatically multiplies by 100 and adds the “%” symbol.
- To calculate
Online percentage calculators and financial apps also offer quick and convenient ways to perform these calculations, often with specialized functions for loans, tips, or discounts.
Common Mistakes to Avoid
Even with simple formulas, errors can creep in. Being aware of these common pitfalls can save you from miscalculations:
- Misidentifying the “Whole” or “Part”: This is perhaps the most common error. For instance, when calculating a percentage increase, ensure you’re dividing by the original amount, not the new amount. If a stock goes from $100 to $120, the increase is $20. The percentage increase is ($20 / $100) × 100 = 20%, not ($20 / $120) × 100.
- Rounding Errors: Rounding too early in a multi-step calculation can lead to significant discrepancies. It’s generally best to carry more decimal places during intermediate steps and only round the final answer.
- Confusing Percentage Points with Percentage Change: A shift from 10% to 12% is a 2 percentage point increase. However, the percentage change is ((12-10)/10) * 100 = 20%. This distinction is vital in financial reporting, particularly concerning interest rates or economic growth.
- Incorrect Decimal Conversion: Forgetting to convert a percentage to its decimal form (e.g., using 25 instead of 0.25) before multiplying can lead to errors by a factor of 100.
By being mindful of these common mistakes, you can significantly enhance the accuracy and reliability of your financial percentage calculations.
Mastering Percentages: A Cornerstone of Financial Literacy
Understanding and correctly applying percentage calculations transcends simple arithmetic; it is a fundamental pillar of financial literacy. In an increasingly data-driven world, the ability to interpret and manipulate percentages is not just an advantage but a necessity for informed decision-making.
Empowering Financial Decisions
Whether you are an individual managing a household budget, an entrepreneur evaluating business performance, or an investor allocating capital, mastering percentages empowers you to:
- Budget Smarter: Clearly see where your money goes and make conscious choices about spending and saving.
- Save More Effectively: Understand the impact of interest rates and set realistic savings goals.
- Invest Wisely: Accurately assess investment returns, risk, and portfolio diversification.
- Negotiate Better: Confidently calculate discounts, interest rates, and loan terms.
- Analyze Business Performance: Gauge profitability, growth, and market position with precision.
- Plan for the Future: Make informed decisions about retirement, taxes, and other long-term financial goals.
Percentages provide the clarity needed to transform raw financial data into actionable insights, enabling you to take control of your financial destiny rather than being a passive observer.
Continuous Learning and Application
The journey to financial mastery is ongoing. The more you apply percentage calculations in real-world scenarios – from checking your credit card statement to reviewing your investment portfolio – the more intuitive and second-nature they will become. Practice makes perfect, and consistent application builds confidence and a deeper understanding of financial dynamics.
Embrace the power of percentages as a tool for clarity, control, and ultimately, greater financial freedom. By dedicating time to understanding these calculations, you’re not just crunching numbers; you’re building a robust foundation for a more secure and prosperous financial future.
aViewFromTheCave is a participant in the Amazon Services LLC Associates Program, an affiliate advertising program designed to provide a means for sites to earn advertising fees by advertising and linking to Amazon.com. Amazon, the Amazon logo, AmazonSupply, and the AmazonSupply logo are trademarks of Amazon.com, Inc. or its affiliates. As an Amazon Associate we earn affiliate commissions from qualifying purchases.