
In the dynamic world of finance, understanding change is paramount. Whether you’re tracking your investment portfolio, analyzing market trends, or managing personal budgets, the ability to quantify reductions is a powerful skill. The percent decrease is a fundamental financial metric that allows us to precisely measure the proportionate drop in a value from an original point to a new, lower point. Far more insightful than a mere absolute numerical difference, a percentage decrease provides a standardized way to compare reductions across various scales, making it an indispensable tool for investors, business owners, and anyone navigating their personal financial landscape.
This article will demystify the calculation of percent decrease, grounding it firmly within the realm of personal and business finance. We’ll explore its importance, walk through the straightforward formula, illustrate its practical applications with real-world financial examples, and discuss best practices to ensure you’re using this metric effectively to make informed financial decisions.
Understanding the Importance of Percent Decrease in Finance
The seemingly simple concept of a percent decrease holds profound implications across various financial disciplines. It’s not just a mathematical exercise; it’s a lens through which we interpret economic health, investment performance, and personal financial efficacy.
Tracking Investment Performance
For investors, the percent decrease is a critical metric for understanding risk and evaluating portfolio performance during downturns. A stock that drops from $100 to $80 has experienced a 20% decrease, which is a more universally comparable figure than simply stating a $20 loss. This allows investors to:
- Quantify Drawdowns: Understand the magnitude of temporary declines from a peak value.
- Assess Risk Exposure: Compare the volatility and potential losses across different assets or investment strategies.
- Inform Selling Decisions: While not the sole factor, a significant percentage decrease can signal a need to re-evaluate an investment’s fundamentals or your risk tolerance.
Budgeting and Expense Management
In personal and business finance, effectively managing expenses is key to profitability and solvency. The percent decrease helps individuals and organizations pinpoint areas where spending has been successfully reduced or where further cuts might be necessary.
- Identify Cost Savings: Measure the impact of efforts to reduce specific expenses, such as a 15% decrease in utility bills after implementing energy-saving measures.
- Analyze Spending Habits: Track changes in discretionary spending month-over-month or year-over-year.
- Adjust Financial Plans: If income decreases, calculating a proportionate reduction in spending can help maintain financial stability.
Analyzing Sales and Discounts
From a consumer perspective, understanding percent decrease is essential for evaluating the real value of sales and discounts. A “25% off” sale immediately tells you the relative saving regardless of the original price. For businesses, it’s vital for:
- Pricing Strategies: Calculating discount percentages to attract customers while maintaining profit margins.
- Promotional Effectiveness: Assessing the impact of sales events on revenue and customer engagement.
- Clear Communication: Clearly stating percentage discounts helps consumers quickly grasp the value proposition.
Economic Indicators and Market Analysis
Economists and financial analysts frequently rely on percent decreases to interpret broad economic trends and market shifts.
- GDP Contractions: A percentage decrease in Gross Domestic Product signals economic recession.
- Inflation/Deflation: A decrease in the rate of inflation (disinflation) or actual price declines (deflation) is measured as a percentage.
- Market Corrections: Significant percentage drops in stock market indices often signal corrections or bear markets, prompting reassessments of investment strategies.
The Core Formula for Percent Decrease
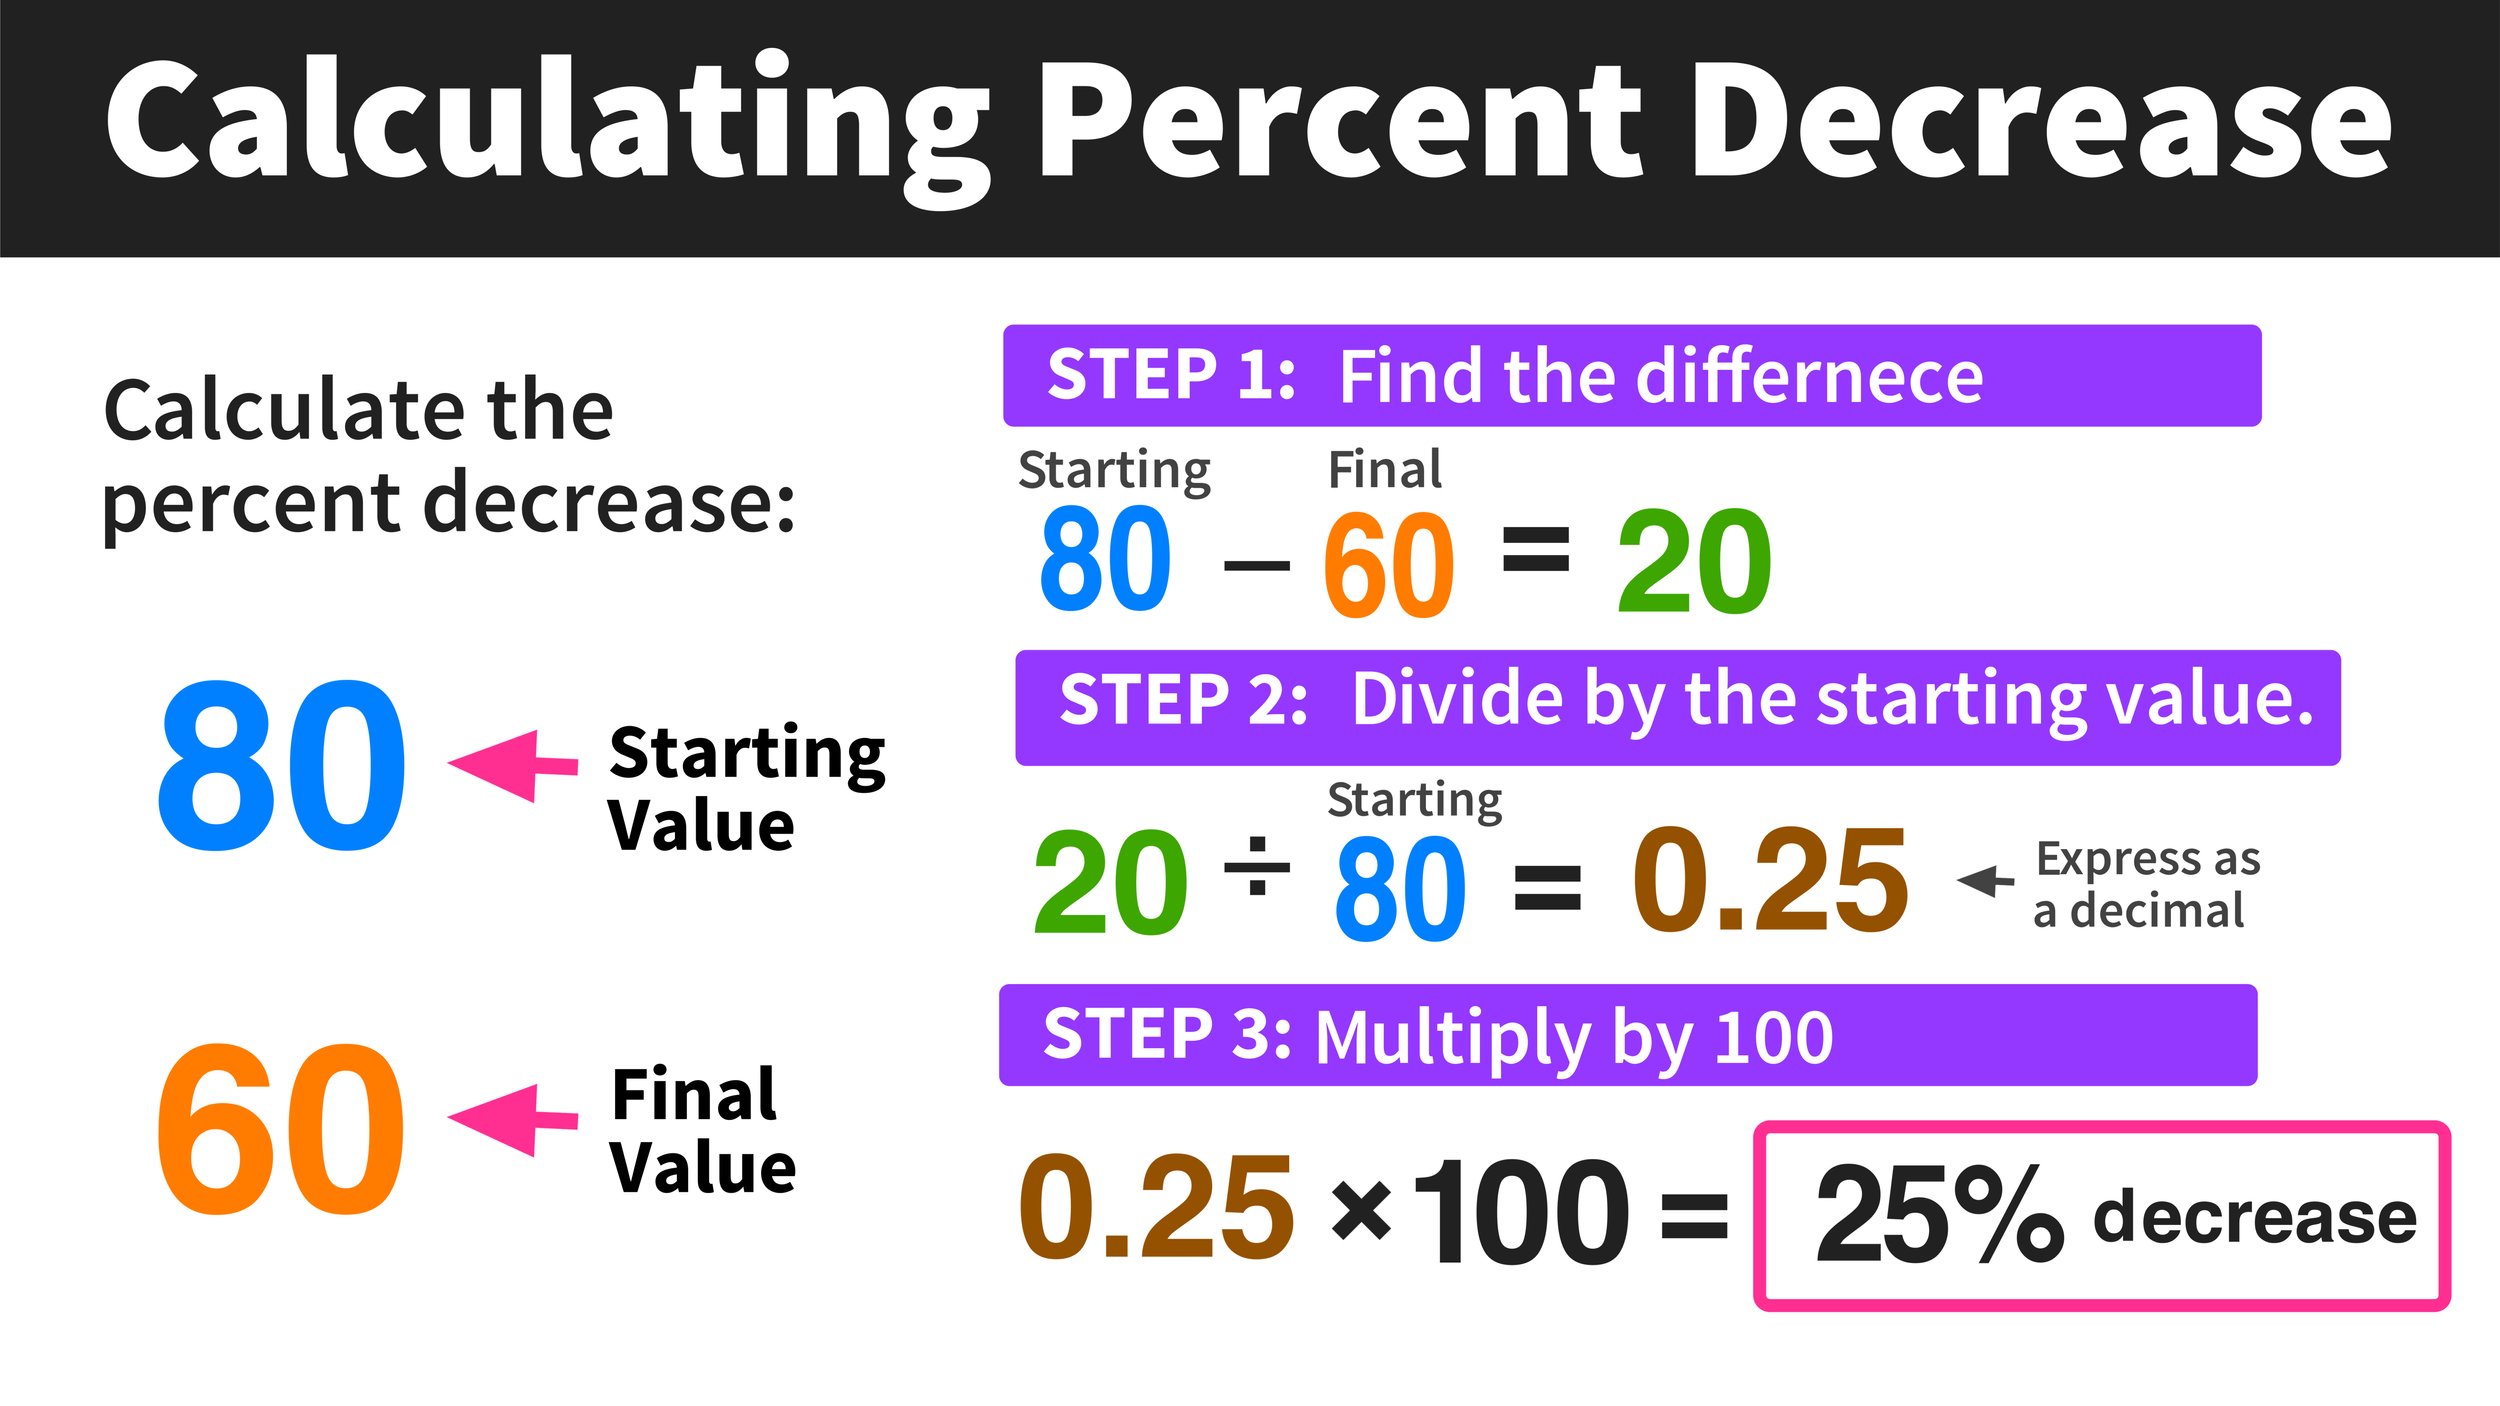
Calculating the percent decrease is a straightforward process, built upon a simple, yet powerful, mathematical formula. Once you understand its components, you can apply it to a myriad of financial scenarios.
Breaking Down the Components
To calculate a percent decrease, you primarily need two values:
- Original Value (or Starting Value): This is the initial number or amount from which the decrease is measured.
- New Value (or Ending Value): This is the reduced number or amount after the decrease has occurred.
The difference between these two values gives you the absolute decrease. The formula then converts this absolute decrease into a relative percentage.
Step-by-Step Calculation
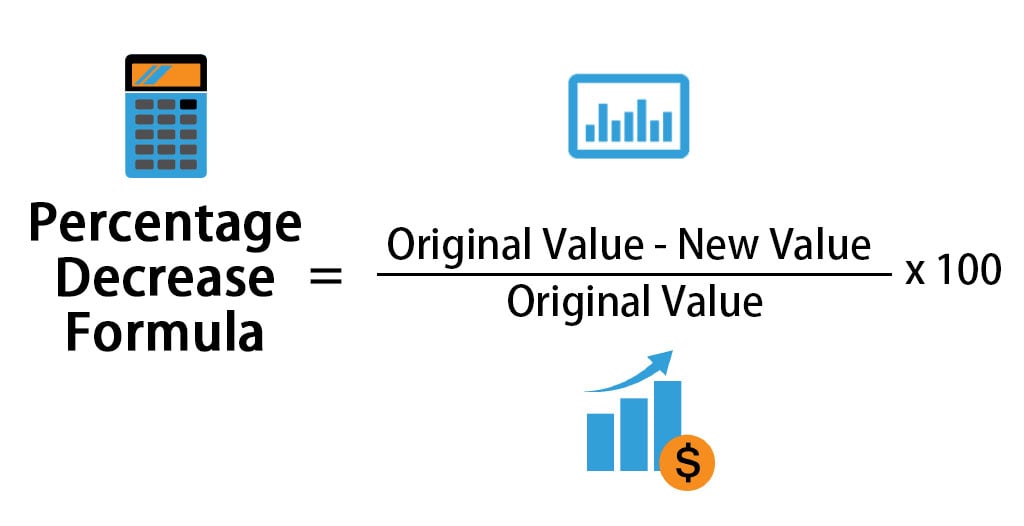
Here’s the universal formula and the steps to follow:
Formula:
Percent Decrease = ((Original Value - New Value) / Original Value) × 100
Let’s break it down into actionable steps:
- Find the Decrease: Subtract the New Value from the Original Value.
Decrease = Original Value - New Value - Divide by the Original Value: Divide the calculated Decrease by the Original Value. This gives you the decimal representation of the decrease.
Decimal Decrease = Decrease / Original Value - Multiply by 100: Multiply the Decimal Decrease by 100 to convert it into a percentage.
Percent Decrease = Decimal Decrease × 100
Illustrative Examples
Let’s apply this to a couple of common financial scenarios:
Example 1: Stock Price Drop
You bought shares of a company at $50 per share. Due to market volatility, the price dropped to $40 per share. What is the percent decrease?
- Original Value = $50
- New Value = $40
- Decrease = $50 – $40 = $10
- Decimal Decrease = $10 / $50 = 0.20
- Percent Decrease = 0.20 × 100 = 20%
The stock price experienced a 20% decrease.
Example 2: Monthly Budget Reduction
Last month, your discretionary spending was $800. This month, you made an effort to cut back, and your discretionary spending was $650. What is the percent decrease in your spending?
- Original Value = $800
- New Value = $650
- Decrease = $800 – $650 = $150
- Decimal Decrease = $150 / $800 = 0.1875
- Percent Decrease = 0.1875 × 100 = 18.75%
You successfully reduced your discretionary spending by 18.75%.
Practical Applications in Personal Finance and Investing
The ability to calculate percent decrease isn’t just theoretical; it empowers individuals to make smarter, data-driven decisions about their money.
Evaluating Investment Losses
When the market takes a dip, or a specific investment underperforms, knowing the percentage loss provides crucial context. If your portfolio value drops from $100,000 to $90,000, that’s a 10% decrease. This percentage allows you to:
- Benchmark Performance: Compare your loss to market indices or similar investments.
- Determine Recovery Needs: A 10% drop requires an 11.11% gain to recover, highlighting the power of compounding.
- Assess Risk Tolerance: Understand if the magnitude of the decrease aligns with your comfort level for risk.
Monitoring Budget Reductions
For personal budgeting, tracking expense reductions is vital for achieving financial goals. If you set a goal to cut your dining-out expenses, calculating the percent decrease month-over-month reveals your progress.
- Achieve Savings Goals: See how effective your cost-cutting measures are in freeing up cash for savings or debt repayment.
- Identify Areas for Improvement: If a target expense category shows a smaller-than-expected decrease, it signals where more discipline might be needed.
- Justify Spending Choices: Celebrate successful reductions and reinforce positive financial habits.
Understanding Loan and Debt Reductions
When paying down debt, tracking the principal reduction as a percentage provides a motivating progress report. If your mortgage principal was $200,000 and is now $190,000, that’s a 5% decrease in your loan balance.
- Visualize Progress: A percentage drop feels more significant and motivating than just seeing the absolute dollar amount.
- Set Realistic Goals: Use past reduction percentages to project future payoff timelines.
- Evaluate Strategies: Compare the effectiveness of different debt repayment strategies (e.g., avalanche vs. snowball) based on their percentage impact on total debt.
Assessing Asset Depreciation
Many assets, from vehicles to electronics, lose value over time. Calculating this percent decrease, or depreciation, is important for tax purposes, insurance claims, or simply understanding your net worth. If a car bought for $30,000 is now valued at $24,000, it has depreciated by 20%.
- Accurate Net Worth Calculation: Include depreciation to get a true picture of your assets’ current value.
- Tax Implications: For business assets, depreciation can be a deductible expense.
- Future Planning: Inform decisions on when to sell or replace depreciating assets.
Business Finance Scenarios for Percent Decrease
Beyond personal finances, percent decrease is an invaluable metric for businesses of all sizes, offering insights into operational efficiency, market performance, and strategic planning.
Sales and Revenue Declines
A decrease in sales or revenue is a critical indicator of a company’s health. Quantifying this as a percentage provides immediate context for stakeholders. If quarterly revenue drops from $1 million to $800,000, that’s a 20% decrease, which could trigger an immediate strategic review.
- Early Warning System: Significant percentage drops can signal market shifts, increased competition, or internal operational issues.
- Investor Relations: Publicly traded companies must report percentage changes in revenue, which heavily influences investor confidence.
- Marketing and Sales Strategy: Helps sales and marketing teams understand the impact of campaigns or economic factors on top-line performance.
Cost Reduction Strategies
Businesses constantly seek ways to optimize costs. Measuring the percent decrease in operational expenses helps evaluate the effectiveness of these efforts. For example, if manufacturing costs per unit decreased from $10 to $8, that’s a 20% reduction.
- Evaluate Efficiency Initiatives: Determine if new processes, technologies, or negotiations are yielding the desired cost savings.
- Improve Profit Margins: Reducing costs by a certain percentage directly impacts the bottom line, enhancing profitability.
- Resource Allocation: Identify departments or areas where cost-cutting has been most (or least) successful to inform future resource allocation.
Inventory Shrinkage Analysis
Inventory shrinkage, the loss of inventory due to theft, damage, or obsolescence, represents a direct financial loss for businesses. Expressing this as a percent decrease from expected inventory levels helps in management. If a retail store expected to have 1,000 units but only has 950, that’s a 5% shrinkage.
- Identify Problem Areas: Pinpoint specific product lines or locations with high shrinkage rates.
- Implement Loss Prevention: Justify investments in security, inventory management systems, or improved handling procedures.
- Financial Reporting: Accurately account for inventory losses in financial statements.
Market Share Contraction
In competitive industries, understanding changes in market share is paramount. If a company’s market share drops from 15% to 12%, that’s a 20% decrease (not a 3% decrease, which would be an absolute change, not a percentage decrease from the original share).
- Competitive Analysis: Track performance relative to competitors and the overall market.
- Strategic Planning: Inform decisions on product development, marketing spend, or mergers and acquisitions to regain or expand share.
- Valuation: Market share trends are often considered by investors and analysts when valuing a company.
Common Pitfalls and Best Practices
While calculating percent decrease is straightforward, misapplication or misinterpretation can lead to flawed financial conclusions. Adhering to best practices ensures accuracy and insightful analysis.
Ensuring Accurate Data
The integrity of your percent decrease calculation hinges entirely on the accuracy of your original and new values.
- Verify Sources: Always double-check your data inputs. Are they from reliable financial statements, validated reports, or accurate personal records?
- Consistent Units: Ensure both values are measured in the same units (e.g., dollars, units, percentage points) and over comparable timeframes.
- Avoid Rounding Errors (Initially): Perform the calculation with as much precision as possible before rounding the final percentage.
Contextualizing the Decrease
A number alone rarely tells the full story. The significance of a percent decrease depends heavily on its context.
- Consider the Baseline: A 50% decrease from $100 is very different from a 50% decrease from $1 million. The absolute value matters.
- Timeframe: Was the decrease over a day, a month, a year? The duration impacts its severity and implications.
- Industry Benchmarks: Is a 10% decrease in sales normal for your industry during a specific season, or does it signal a deeper problem?
- Causes and Effects: Understand why the decrease occurred and what its potential ripple effects might be.
Using Financial Tools
While manual calculation is good for understanding, leveraging technology can enhance efficiency and accuracy, especially with complex data sets.
- Spreadsheets (Excel, Google Sheets): Ideal for managing financial data, performing calculations, and creating visual representations of decreases over time.
- Online Calculators: Quick and convenient for one-off calculations.
- Financial Software: Many accounting and investment platforms automatically track and report percentage changes, integrating them into dashboards and reports.
Beyond the Number: Holistic Analysis
The percent decrease is a powerful metric, but it’s just one piece of the financial puzzle.
- Combine with Other Metrics: Always view percent decrease in conjunction with other financial indicators like absolute changes, growth rates, profit margins, and volume changes. A 50% decrease in sales might be less alarming if profit margins significantly increased due to cost-cutting.
- Trend Analysis: Look at sequences of percent decreases or changes over multiple periods to identify trends rather than reacting to isolated data points.
- Qualitative Factors: Financial numbers should always be balanced with qualitative insights. What market conditions, management decisions, or external events contributed to the decrease?
In conclusion, mastering the calculation and interpretation of percent decrease is an essential skill for anyone serious about managing money effectively. It transforms raw numbers into actionable insights, enabling better decision-making in personal finance, investing, and business operations. By understanding its mechanics, applying it thoughtfully, and contextualizing its findings, you can gain a clearer, more powerful perspective on the fluctuations that define the financial world.
aViewFromTheCave is a participant in the Amazon Services LLC Associates Program, an affiliate advertising program designed to provide a means for sites to earn advertising fees by advertising and linking to Amazon.com. Amazon, the Amazon logo, AmazonSupply, and the AmazonSupply logo are trademarks of Amazon.com, Inc. or its affiliates. As an Amazon Associate we earn affiliate commissions from qualifying purchases.