
Understanding and calculating increases is a fundamental skill in the world of finance, serving as a cornerstone for informed decision-making across personal and business realms. Whether you’re tracking your investment portfolio’s growth, evaluating a business’s revenue performance, or simply monitoring the rise in your monthly expenses, the ability to accurately quantify an increase provides crucial insights. This article delves into the various methods and applications of calculating increases, focusing exclusively on its relevance within the Money domain—from personal finance to sophisticated investment analysis.
The Foundation: Understanding the Basics of Increase Calculation
At its heart, calculating an increase involves comparing a current value to a previous one to determine the magnitude of change. This seemingly simple concept underpins nearly every financial metric used to assess growth, performance, and trends.

Absolute Increase: The Raw Difference
The most straightforward way to calculate an increase is to find the absolute difference between the new value and the old value. This tells you the raw number by which something has grown.
The formula is:
Absolute Increase = New Value – Old Value
For example, if your savings account balance grew from $5,000 to $5,500, the absolute increase is $5,500 – $5,000 = $500. While simple, the absolute increase provides a clear numerical understanding of the gain. However, its true significance often depends on the scale of the original value. A $500 increase means one thing for a $5,000 balance and quite another for a $5,000,000 balance. This is where the percentage increase becomes vital.
Percentage Increase: Contextualizing Growth
The percentage increase offers a more meaningful perspective by expressing the increase as a proportion of the original value. It normalizes the growth, allowing for easier comparison between different financial metrics or across different periods, regardless of their initial size. A 10% increase is always a 10% increase, whether it’s on a $100 investment or a $1,000,000 one.
The formula is:
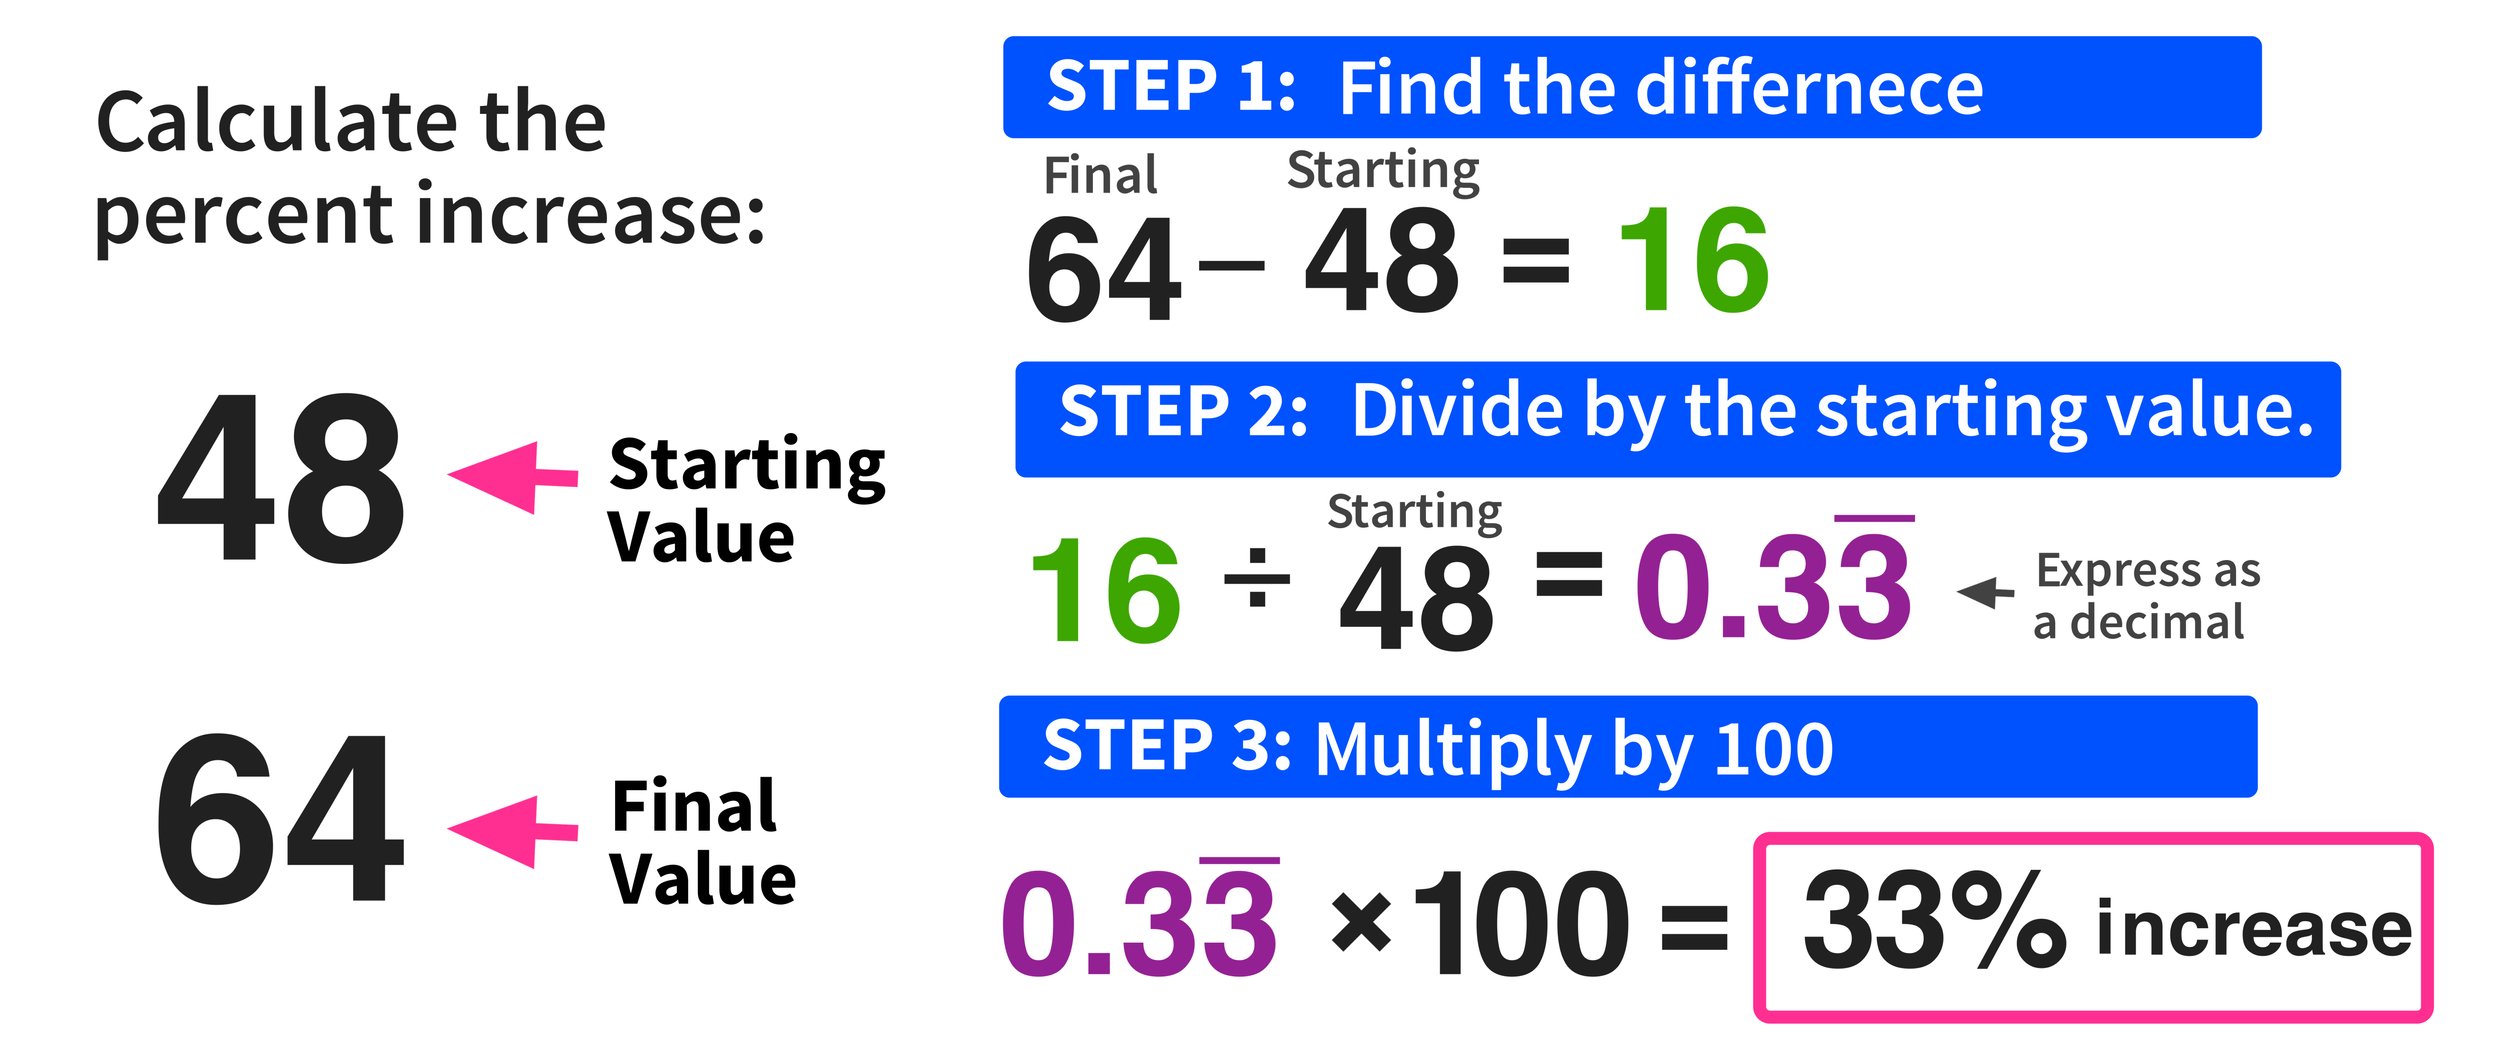
Percentage Increase = ((New Value – Old Value) / Old Value) × 100%
Let’s revisit the savings account example:
Old Value = $5,000
New Value = $5,500
Absolute Increase = $500
Percentage Increase = ($500 / $5,000) × 100% = 0.10 × 100% = 10%
This indicates a 10% growth in your savings. The percentage increase is arguably the most common and powerful way to articulate financial growth or decline, providing a standardized measure that is easily understood and comparable.
The Core Formula: A Universal Approach
While presented separately, these two calculations are intrinsically linked. The percentage increase formula can be broken down into steps: first, find the absolute difference, and then divide it by the original value before multiplying by 100 to convert it to a percentage. This core concept, comparing a change against a baseline, is universally applied across all financial increase calculations. Mastering this foundational understanding is the first step toward effective financial analysis.
Practical Applications in Personal Finance
In personal finance, calculating increases empowers individuals to monitor their financial health, make informed budgeting decisions, and track progress towards their financial goals. It brings clarity to how personal wealth is evolving over time.
Tracking Income Growth and Budget Changes
For individuals, understanding income increases is paramount. Whether it’s a raise at work, growth in side hustle revenue, or increased investment dividends, calculating the percentage increase in income over time helps assess career progression and overall financial capacity. Similarly, tracking increases in specific budget categories—such as housing costs, transportation, or groceries—allows for proactive budget adjustments. If your food expenses increase by 15% year-over-year, it signals a need to either reallocate funds, find cost-saving measures, or adjust your overall budget to accommodate the new reality. These calculations reveal trends that might otherwise go unnoticed, enabling more effective financial planning.
Measuring Savings and Investment Returns
Perhaps one of the most motivating applications of increase calculation in personal finance is measuring the growth of savings and investment portfolios.
For savings accounts, the percentage increase tells you how effectively your money is compounding or how much your regular contributions are adding to the balance relative to the starting amount.
For investments, calculating the percentage increase, often referred to as Return on Investment (ROI), is crucial. If you invest $1,000 in a stock that grows to $1,200, your absolute increase is $200, and your percentage increase (ROI) is (($1,200 – $1,000) / $1,000) × 100% = 20%. This calculation helps you evaluate the performance of different assets, compare them against benchmarks, and make decisions about where to allocate future capital.
Understanding Cost of Living Increases (Inflation)
Inflation, the general increase in prices and fall in the purchasing value of money, is a pervasive financial concept that directly impacts personal finances. While typically calculated at a macroeconomic level (e.g., Consumer Price Index), individuals can apply the concept of percentage increase to understand how their personal cost of living is rising. By tracking the prices of goods and services they regularly consume over time, individuals can estimate their personal inflation rate. This helps in understanding the real value of their income and investments. For example, if your salary increased by 3%, but your personal cost of living increased by 5%, your real purchasing power has effectively decreased, highlighting the importance of calculating increases beyond just income.
Business Finance: Gauging Performance and Growth

In the corporate world, calculating increases is indispensable for evaluating business performance, strategizing for growth, and reporting to stakeholders. It provides a quantitative measure of success, efficiency, and market position.
Revenue and Profit Growth Analysis
For businesses, the consistent growth of revenue and profit is a primary objective. Calculating the percentage increase in revenue year-over-year (YoY) or quarter-over-quarter (QoQ) allows management to assess sales effectiveness, market demand, and overall business expansion. Similarly, tracking the percentage increase in net profit reveals the efficiency of operations and cost management. A healthy revenue increase coupled with an even stronger profit increase indicates improved profitability margins. Conversely, a revenue increase with a disproportionately lower profit increase might signal rising costs or operational inefficiencies that need addressing. These calculations are critical for financial reporting, investor relations, and strategic planning.
Market Share and Customer Base Expansion
Businesses also use increase calculations to measure their competitive standing and customer acquisition efforts. An increase in market share, expressed as a percentage, indicates that the company is capturing a larger proportion of its target market. For instance, if a company’s sales accounted for 10% of the total industry sales last year and 12% this year, it has seen a 20% increase in market share percentage ((12-10)/10 * 100). Similarly, an increase in the customer base, measured by the percentage growth in the number of active customers, is a key indicator of successful marketing and sales strategies, reflecting brand reach and customer loyalty. These metrics are vital for competitive analysis and demonstrating business trajectory.
Expense Management and Cost Increases
While growth in revenue and profit is desirable, businesses must also meticulously track increases in expenses. Calculating the percentage increase in various operating costs—such as raw materials, labor, marketing, or administrative overheads—is essential for cost control and financial forecasting. Unchecked expense increases can erode profit margins, even if revenue is growing. For example, if advertising spend increases by 20% but only yields a 5% revenue increase, it suggests an inefficient marketing strategy. By analyzing these increases, businesses can identify areas for cost optimization, negotiate better terms with suppliers, or re-evaluate operational processes to maintain profitability.
Advanced Considerations for Financial Increase Calculations
Beyond basic absolute and percentage increases, the financial world often requires more sophisticated methods to analyze growth over multiple periods, accounting for the compounding effect of returns.
Annualized Growth Rates
When comparing financial data across different time frames, it’s often useful to annualize growth rates. This means converting a growth rate observed over a period (e.g., monthly, quarterly) into an equivalent annual rate, providing a standardized measure for comparison. If an investment yields 2% in a single quarter, its simple annualized rate might be 8% (2% x 4 quarters), assuming the growth is consistent. However, for accuracy, financial professionals often use more complex formulas that account for compounding.
Compound Annual Growth Rate (CAGR)
The Compound Annual Growth Rate (CAGR) is a crucial metric for measuring the average annual growth of an investment or financial metric over a specified period longer than one year, assuming the profits are reinvested at the end of each year. Unlike a simple average, CAGR smooths out volatility and provides a more realistic picture of sustained growth.
The formula for CAGR is:
CAGR = ((Ending Value / Beginning Value)^(1 / Number of Years)) – 1
For instance, if an investment grew from $10,000 to $16,105.10 over five years, the CAGR would be:
((16,105.10 / 10,000)^(1/5)) – 1 = (1.61051^(0.2)) – 1 ≈ 1.10 – 1 = 0.10 or 10%.
CAGR is indispensable for comparing the performance of different investments, assessing business growth trends, and forecasting future financial performance over multi-year horizons.
Real vs. Nominal Increase
In the context of inflation, it’s vital to distinguish between nominal increase and real increase.
A nominal increase is the raw, unadjusted percentage increase in monetary terms, as calculated by the basic percentage increase formula. It doesn’t account for changes in purchasing power.
A real increase, however, adjusts the nominal increase for inflation, revealing the true growth in purchasing power. If your salary increased by 5% (nominal increase) but inflation was 3%, your real increase in purchasing power is approximately 2% (5% – 3%). For investments, the real return indicates how much your wealth has genuinely grown after accounting for the erosion of purchasing power due to inflation. Calculating real increases provides a more accurate picture of financial progress and wealth accumulation.
Tools and Best Practices for Accurate Calculation
While the formulas are straightforward, applying them accurately and consistently requires attention to detail and leveraging appropriate tools.
Utilizing Spreadsheets and Financial Software
Modern financial calculations are almost universally performed using spreadsheets like Microsoft Excel or Google Sheets. These tools allow users to set up formulas once and apply them to vast datasets, automating calculations and minimizing human error. Functions such as RATE, FV (Future Value), and simple percentage formulas make complex financial analysis accessible. Dedicated financial software and accounting platforms also integrate these calculations, providing dashboards and reports that automatically display growth rates and performance metrics, freeing up time for analysis rather than manual calculation.
Avoiding Common Pitfalls
Several common mistakes can lead to inaccurate increase calculations:
- Incorrect Base Value: Always ensure you are dividing by the original or beginning value, not the new or difference value.
- Time Period Consistency: When comparing growth rates, ensure the time periods are consistent (e.g., comparing quarter-over-quarter growth with other quarter-over-quarter data).
- Ignoring Compounding: For multi-period growth, simple average growth rates can be misleading; use CAGR for a more accurate representation.
- Overlooking Inflation: For long-term financial planning and investment analysis, failing to account for inflation can lead to an overestimation of real returns and purchasing power.
The Importance of Consistent Data
Accurate calculations depend fundamentally on consistent and reliable data. Financial data should be gathered from verifiable sources, standardized in terms of reporting periods, and free from errors. Inconsistent data can lead to skewed results, misinformed decisions, and a flawed understanding of financial performance. Regular reconciliation and data validation are critical best practices to ensure the integrity of your calculations.
In conclusion, the ability to calculate and interpret increases is an essential competency for anyone navigating the financial landscape. From managing personal budgets to making strategic business decisions and evaluating complex investment portfolios, these calculations provide the clarity and insight needed to foster financial growth and achieve economic objectives. By mastering the core formulas and understanding their diverse applications, individuals and businesses alike can unlock a deeper understanding of their financial journey.
aViewFromTheCave is a participant in the Amazon Services LLC Associates Program, an affiliate advertising program designed to provide a means for sites to earn advertising fees by advertising and linking to Amazon.com. Amazon, the Amazon logo, AmazonSupply, and the AmazonSupply logo are trademarks of Amazon.com, Inc. or its affiliates. As an Amazon Associate we earn affiliate commissions from qualifying purchases.