
Understanding the economic landscape is paramount for sound financial decision-making, whether you’re managing a household budget, running a business, or making investment choices. At the heart of this understanding lies the Consumer Price Index (CPI), a widely recognized measure of inflation that tracks the average change over time in the prices paid by urban consumers for a market basket of consumer goods and services. Far from being an abstract economic indicator, the CPI directly influences everything from interest rates and wage negotiations to the purchasing power of your savings. This comprehensive guide will demystify the CPI, explaining its importance, how it’s calculated, and its profound implications for your financial well-being.
Understanding the CPI: A Core Economic Indicator
The Consumer Price Index serves as a vital barometer for the health of an economy, reflecting the cost of living and the rate at which it changes. For individuals, businesses, and policymakers alike, the CPI provides crucial insights into economic stability and trends.
What is the Consumer Price Index?
The Consumer Price Index (CPI) is a statistical measure produced by national statistical agencies (like the Bureau of Labor Statistics in the U.S. or Eurostat in the Eurozone). It measures the weighted average of prices of a basket of consumer goods and services, such as transportation, food, and medical care. The CPI is calculated by taking price changes for each item in the predetermined basket of goods and averaging them. Changes in the CPI are used to assess price changes associated with the cost of living; the CPI is one of the most frequently used statistics for identifying periods of inflation or deflation. When the CPI rises, it indicates inflation – that goods and services are becoming more expensive. Conversely, a falling CPI signals deflation.
Why is the CPI Important for Your Finances?
For the average individual, the CPI is not just an academic figure; it’s a direct reflection of their purchasing power. A rising CPI means that the money you earn today will buy less tomorrow. This erodes the real value of your savings, salaries, and fixed income. For instance, if inflation (measured by CPI) is 3% per year, and your savings account yields 1% interest, your real return is actually negative 2% – meaning your money is losing value. Understanding the CPI helps you make informed decisions about where to invest, whether to negotiate for a cost-of-living adjustment (COLA) in your salary, and how to plan for future expenses like retirement or education.
Who Uses the CPI and For What Purpose?
The utility of the CPI extends across various sectors:
- Individuals and Households: Use it to understand changes in their cost of living, evaluate the real return on investments, and make budgeting decisions.
- Businesses: Employ the CPI to adjust prices, negotiate wage contracts, forecast demand, and plan capital expenditures. It helps them understand input costs and consumer spending habits.
- Government and Policymakers: Central banks, like the Federal Reserve, use the CPI as a key indicator for setting monetary policy, particularly interest rates. Governments also use the CPI to index social security benefits, federal pensions, and other payments to account for inflation, ensuring the real value of these benefits is maintained.
- Investors: Analyze CPI data to gauge inflation risk, assess the outlook for interest rates, and make decisions about asset allocation across different investment vehicles, such as stocks, bonds, and real estate.
The Essential Components of CPI Calculation
Calculating the CPI is a meticulous process that involves several critical components designed to accurately reflect consumer spending patterns and price changes.
Defining the “Basket of Goods and Services”
The cornerstone of CPI calculation is the “basket of goods and services.” This basket represents the typical consumption pattern of urban consumers and includes a wide array of items grouped into categories such as food and beverages, housing, apparel, transportation, medical care, recreation, education and communication, and other goods and services. The specific items and their proportions in the basket are determined through extensive consumer expenditure surveys. This basket is not static; it is periodically updated to reflect changes in consumer tastes, technology, and economic realities, ensuring its relevance over time. For example, the basket might adjust to include new technologies like smartphones or streaming services as they become commonplace.
Data Collection: Prices and Weights
Once the basket is defined, the next crucial step is data collection. Government statisticians collect millions of price quotes each month from a representative sample of retail stores, service establishments, rental units, and healthcare providers across various geographic areas. These prices are collected for each item within the basket.
Crucially, each item in the basket is assigned a “weight,” reflecting its relative importance in consumer spending. For instance, housing costs typically have a much larger weight than the price of a specific type of fruit, because consumers spend a much larger portion of their income on housing. These weights are derived from the consumer expenditure surveys and are essential for ensuring that the CPI accurately reflects the overall impact of price changes on a household’s budget, rather than simply averaging raw price changes.
Base Period Selection and its Significance
To measure changes over time, a “base period” is established. The base period is a reference point against which prices in subsequent periods are compared. In the base period, the index value is typically set to 100. All other periods’ index values are then expressed in relation to this base. The choice of a base period is critical because it provides a consistent benchmark for comparing inflation rates across different timeframes. While the base period’s value is set to 100, the underlying prices and weights from that period are used in the calculation for all subsequent periods until a new re-weighting or base period adjustment occurs.
Step-by-Step Guide to CPI Calculation
Calculating the CPI involves a straightforward formula once the necessary data – prices and weights for the current and base periods – have been collected.
Let’s denote:
- $P_t$ = Price of a good/service in the current period (t)
- $P_0$ = Price of a good/service in the base period (0)
- $Q_0$ = Quantity of a good/service in the base period (used for weighting)
The formula for the CPI is:
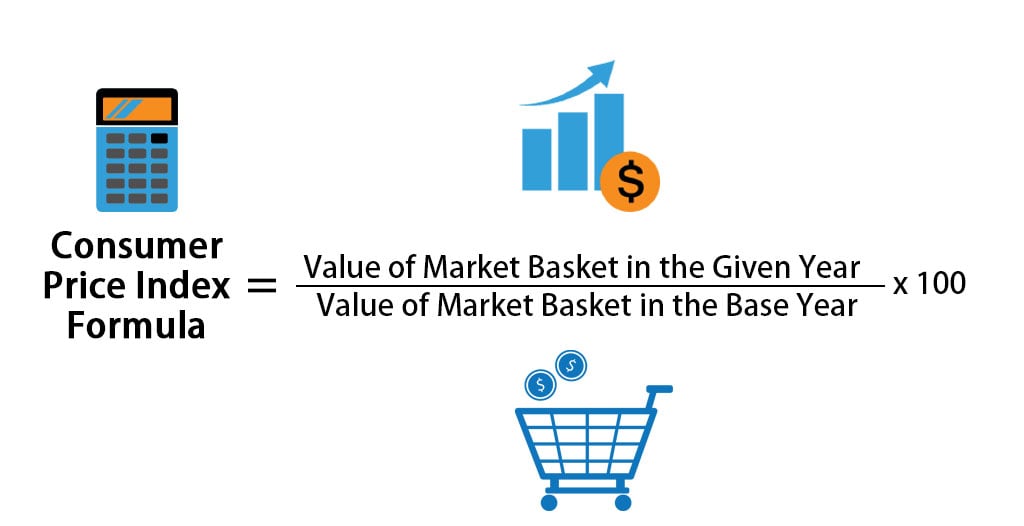
$CPI = frac{text{Cost of Basket in Current Period}}{text{Cost of Basket in Base Period}} times 100$
To break this down:
Step 1: Calculate the Cost of the Basket in the Current Period
For each item in the defined basket of goods and services, multiply its current price ($Pt$) by its base period quantity ($Q0$). Sum these products for all items in the basket. This gives you the total cost of the base period’s basket if purchased at current period prices.
$text{Cost of Basket in Current Period} = sum (P{t,i} times Q{0,i})$ for all items i.

Step 2: Calculate the Cost of the Basket in the Base Period
Similarly, for each item in the basket, multiply its base period price ($P0$) by its base period quantity ($Q0$). Sum these products for all items. This represents the total cost of the basket in the base period.
$text{Cost of Basket in Base Period} = sum (P{0,i} times Q{0,i})$ for all items i.
Step 3: Apply the CPI Formula
Once you have the total cost of the basket for both the current and base periods, plug these values into the CPI formula:
$CPI = frac{sum (P{t,i} times Q{0,i})}{sum (P{0,i} times Q{0,i})} times 100$
An Illustrative Example
Let’s consider a simplified economy with only two goods: Bread and Milk.
| Item | Base Period Quantity ($Q_0$) | Base Period Price ($P_0$) | Current Period Price ($P_t$) |
|---|---|---|---|
| Bread | 10 loaves | $1.00/loaf | $1.20/loaf |
| Milk | 5 gallons | $2.00/gallon | $2.50/gallon |
-
Cost of Basket in Base Period:
- Bread: $10 text{ loaves} times $1.00/text{loaf} = $10.00$
- Milk: $5 text{ gallons} times $2.00/text{gallon} = $10.00$
- Total Cost (Base Period): $$10.00 + $10.00 = $20.00$
-
Cost of Basket in Current Period:
- Bread: $10 text{ loaves} times $1.20/text{loaf} = $12.00$
- Milk: $5 text{ gallons} times $2.50/text{gallon} = $12.50$
- Total Cost (Current Period): $$12.00 + $12.50 = $24.50$
-
Calculate CPI:
- $CPI = frac{$24.50}{$20.00} times 100 = 1.225 times 100 = 122.5$
This CPI of 122.5 indicates that the cost of living has increased by 22.5% since the base period. The inflation rate between the base period and the current period would be $( (122.5 – 100) / 100 ) times 100 = 22.5%$.
Beyond the Basics: Nuances and Limitations of the CPI
While the CPI is an invaluable tool, it’s not without its complexities and limitations, which are important to understand for a complete financial perspective.
Addressing Substitution Bias
One significant challenge in CPI calculation is “substitution bias.” This occurs because the fixed basket of goods does not account for consumers’ ability to substitute away from goods whose prices have risen relatively more towards goods whose prices have risen less or even fallen. For example, if the price of apples rises sharply, consumers might buy more pears instead. A fixed basket would overestimate the cost of living increase because it assumes consumers are still buying the now-more-expensive apples. Modern CPI methodologies, like the chained CPI, attempt to mitigate this bias by allowing for substitutions and updating the weights more frequently.
Quality Changes and New Goods
Another limitation arises from changes in the quality of goods and services over time and the introduction of new products. If a product’s price increases but its quality also improves significantly (e.g., a car with more safety features), the actual cost of “utility” might not have risen as much as the pure price change suggests. Conversely, a decline in quality at the same price could mask a real price increase. Similarly, new goods (like smartphones when they first appeared) are not immediately included in the basket, meaning the initial deflationary impact they might have on related goods (e.g., landline phones) or the benefits they provide are not captured right away. Statisticians employ hedonic pricing models and regular basket updates to address these issues, but they remain complex challenges.
Geographic and Demographic Variations
The CPI is typically calculated for a national or large metropolitan area average, such as the “CPI-U” for all urban consumers. However, the cost of living can vary significantly across different geographic regions and demographic groups. For example, housing costs in New York City are vastly different from those in a rural town. Similarly, a retired couple might have a different spending pattern than a young family. While specialized regional CPIs or CPIs for specific demographic groups (like CPI-W for urban wage earners and clerical workers) exist, a single national CPI might not perfectly reflect the inflation experience of every individual or business.
Practical Applications and Implications for Individuals and Businesses
The CPI, with all its nuances, provides critical insights that directly impact financial planning and strategic decision-making.
How Inflation Impacts Purchasing Power
The most direct implication of a rising CPI is the erosion of purchasing power. If your income remains constant while the CPI increases, you can buy less with the same amount of money. This makes saving for future goals, such as retirement or a down payment on a house, more challenging. To maintain purchasing power, your investments and income need to grow at a rate that at least matches inflation. This understanding drives the need for strategic investment choices that offer real returns (returns above inflation) and the importance of negotiating salary increases that outpace the CPI.
CPI and Wage Adjustments (COLA)
Many labor contracts, social security benefits, and government pensions are indexed to the CPI through Cost-of-Living Adjustments (COLAs). These adjustments are designed to ensure that the real value of wages and benefits doesn’t diminish due to inflation. When the CPI rises, these payments are increased proportionately. For individuals, understanding how COLAs are tied to the CPI is crucial for anticipating changes in their income. For businesses, CPI-linked wage adjustments are a significant factor in managing labor costs and forecasting operational expenses.

Business Strategy and Pricing Decisions
For businesses, the CPI provides vital information for strategic planning. Rising input costs, driven by inflation, necessitate careful pricing decisions to maintain profit margins. Businesses must monitor the CPI to understand general price trends and forecast potential increases in the cost of raw materials, labor, and transportation. This knowledge informs decisions on when to adjust product prices, how to manage inventory, and whether to invest in efficiency improvements to mitigate inflationary pressures. Furthermore, understanding consumer behavior in an inflationary environment, where purchasing power is strained, can shape marketing and product development strategies.
In conclusion, the CPI is more than just a number; it’s a dynamic indicator that reflects the economic heartbeat of a nation and directly touches the financial lives of its citizens and businesses. By comprehending its calculation, its inherent limitations, and its broad applications, you equip yourself with the knowledge to navigate the complexities of inflation, protect your financial assets, and make more informed money decisions in an ever-evolving economic landscape.
aViewFromTheCave is a participant in the Amazon Services LLC Associates Program, an affiliate advertising program designed to provide a means for sites to earn advertising fees by advertising and linking to Amazon.com. Amazon, the Amazon logo, AmazonSupply, and the AmazonSupply logo are trademarks of Amazon.com, Inc. or its affiliates. As an Amazon Associate we earn affiliate commissions from qualifying purchases.