
Investing in the stock market offers a compelling path to wealth creation, but the journey involves more than simply buying low and selling high. To truly understand your investment performance, make informed decisions, and navigate tax obligations, mastering the art of calculating stock profit is indispensable. This guide will demystify the process, breaking down the core concepts, formulas, costs, and tax considerations that every investor needs to grasp. By the end, you’ll be equipped with the knowledge to accurately assess your returns and strategize for future financial success.
The Foundation of Stock Profit: Realized vs. Unrealized Gains
Before diving into complex calculations, it’s crucial to understand the fundamental nature of profit in stock investing. Not all gains are created equal, particularly when it comes to their financial and tax implications.
Defining Profit and Loss in Stock Trading
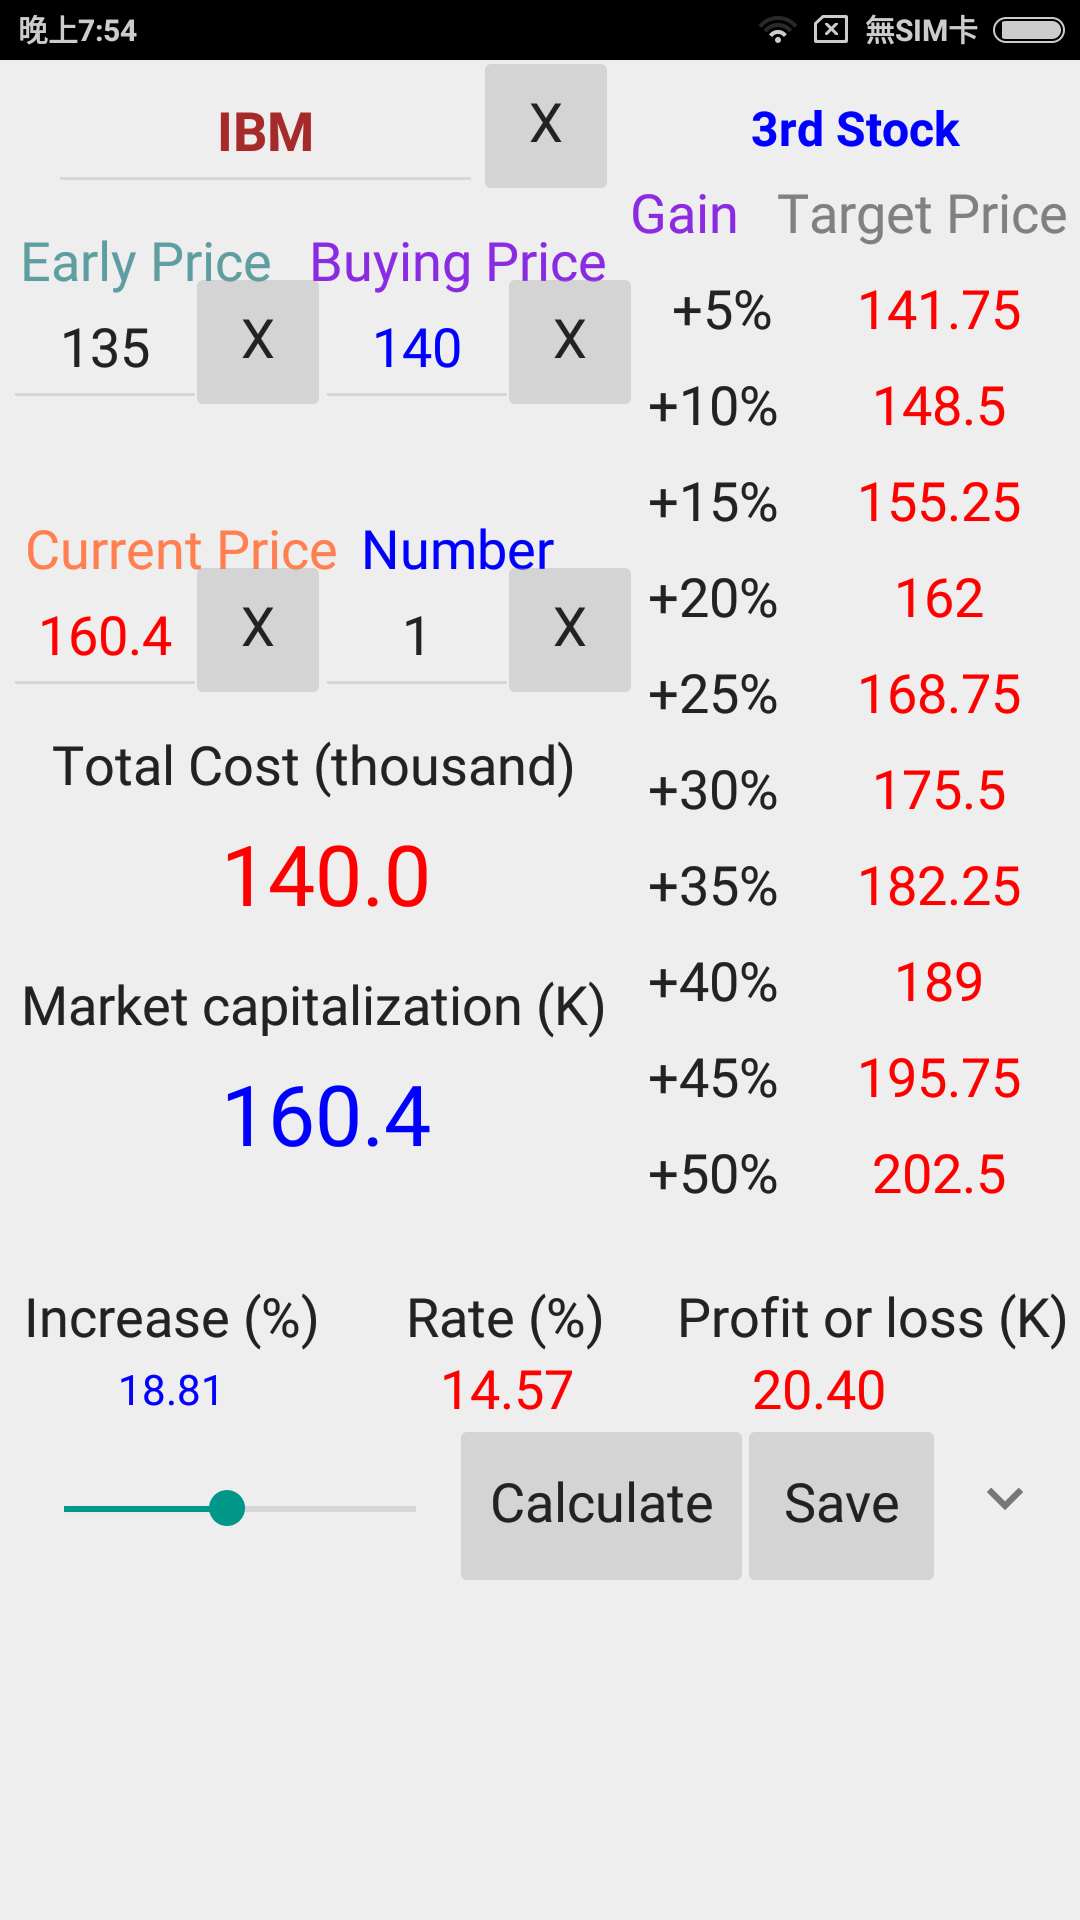
At its most basic, stock profit occurs when you sell shares of a company for a higher price than you paid for them. Conversely, a stock loss happens when you sell shares for less than their original purchase price. This straightforward principle is the bedrock of all investment analysis. The goal is always to maximize profits while minimizing losses, but achieving this requires more than just intuition; it demands precise calculation.
Realized vs. Unrealized Gains and Losses
A critical distinction in stock investing is between realized and unrealized gains or losses:
- Unrealized Gain/Loss: This refers to the profit or loss that exists on paper but has not yet been converted into cash. If you own shares of a stock that have appreciated in value since you bought them, you have an unrealized gain. If they’ve depreciated, you have an unrealized loss. These are hypothetical figures, as the market value could change before you decide to sell. Unrealized gains or losses do not trigger tax events.
- Realized Gain/Loss: This occurs only when you sell your shares. Once the transaction is complete, any profit or loss from that sale becomes “realized” and is officially locked in. Realized gains are taxable events and must be reported to tax authorities, making their accurate calculation paramount.
Understanding this difference is vital for both financial planning and tax preparation. An investor might have significant unrealized gains in their portfolio but no immediate tax liability until those gains are realized through a sale.
Core Formulas for Calculating Your Stock Profit
Once you grasp the basics, the next step is to familiarize yourself with the essential formulas that quantify your investment returns. These calculations move beyond simple intuition to provide concrete figures.
The Simple Profit Calculation Formula
The most straightforward way to calculate the gross profit from a stock sale is as follows:
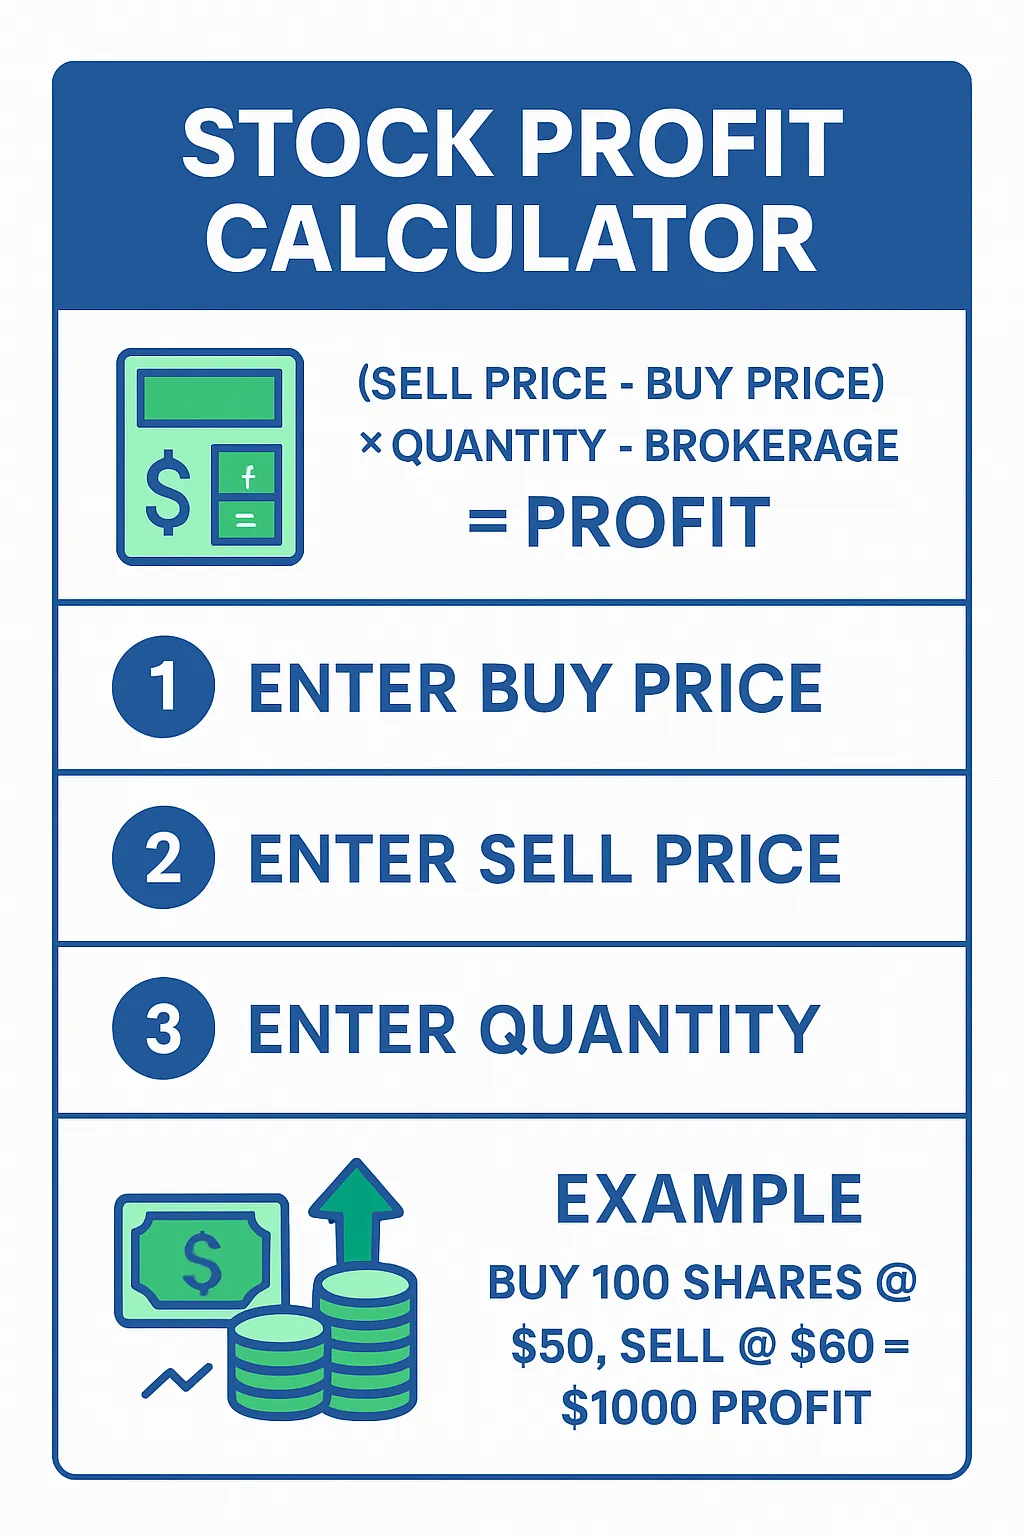
Gross Profit = (Selling Price Per Share – Buying Price Per Share) × Number of Shares
Let’s illustrate with an example:
Suppose you bought 100 shares of Company A at $50 per share and later sold them at $65 per share.
Gross Profit = ($65 – $50) × 100
Gross Profit = $15 × 100
Gross Profit = $1,500
This formula gives you the absolute dollar amount of profit generated from the price difference, before accounting for any costs or additional income.
Calculating Total Return Including Dividends
Many stocks pay dividends, which are distributions of a company’s earnings to its shareholders. These payments are a crucial component of an investor’s total return and should always be factored into profit calculations.
Total Gross Return = (Selling Price Per Share – Buying Price Per Share + Dividends Per Share) × Number of Shares
Alternatively, if you’ve tracked total dividends received:
Total Gross Return = (Selling Price Per Share – Buying Price Per Share) × Number of Shares + Total Dividends Received
Using our previous example: Assume Company A also paid a total of $2 per share in dividends while you held the stock.
Total Gross Return = ($65 – $50 + $2) × 100
Total Gross Return = ($15 + $2) × 100
Total Gross Return = $17 × 100
Total Gross Return = $1,700
Dividends can significantly boost your overall profit, especially over long investment horizons, making their inclusion in your calculations essential for an accurate picture of your investment’s performance.
Understanding Percentage Return on Investment (ROI)
While the absolute dollar profit is important, the percentage return on investment (ROI) often provides a more insightful measure of an investment’s efficiency and allows for easier comparison between different investments.
Percentage Return = (Total Profit / Total Initial Investment) × 100%
Where:
- Total Profit includes both capital gains (from price appreciation) and any dividends received.
- Total Initial Investment includes the initial purchase price of the shares.
From our example with dividends ($1,700 total gross profit) and an initial investment of 100 shares at $50 each ($5,000):
Percentage Return = ($1,700 / $5,000) × 100%
Percentage Return = 0.34 × 100%
Percentage Return = 34%
A 34% return indicates a strong performance relative to the initial capital deployed, offering a standardized metric for evaluating investment success.
Beyond the Purchase Price: Accounting for All Costs
The formulas above provide a gross profit, but a true understanding of your net profit requires meticulously accounting for all associated costs and fees. These seemingly small expenses can significantly erode your returns if overlooked.
Brokerage Commissions and Transaction Fees
When you buy or sell stocks, your brokerage firm typically charges fees. These can include:
- Brokerage Commissions: A flat fee per trade or a percentage of the transaction value. While many modern brokerages offer commission-free trading for stocks and ETFs, some specialized services or international trades may still incur them.
- Transaction Fees: Smaller regulatory fees (e.g., SEC fees, TAF) charged by regulatory bodies or exchanges. These are usually very small but can add up over numerous trades.
These fees apply to both the buying and selling sides of a transaction. For an accurate profit calculation, you must factor in all costs associated with both the acquisition and the disposal of your shares.
Calculating Your Adjusted Cost Basis
The cost basis is the original value of an asset for tax purposes, adjusted for certain factors. For stocks, this is generally your purchase price plus any commissions or fees paid when buying the shares.
Adjusted Cost Basis Per Share = (Total Purchase Price + Buying Commissions/Fees) / Number of Shares
Let’s say you bought 100 shares at $50 each, and paid a $10 commission for the purchase.
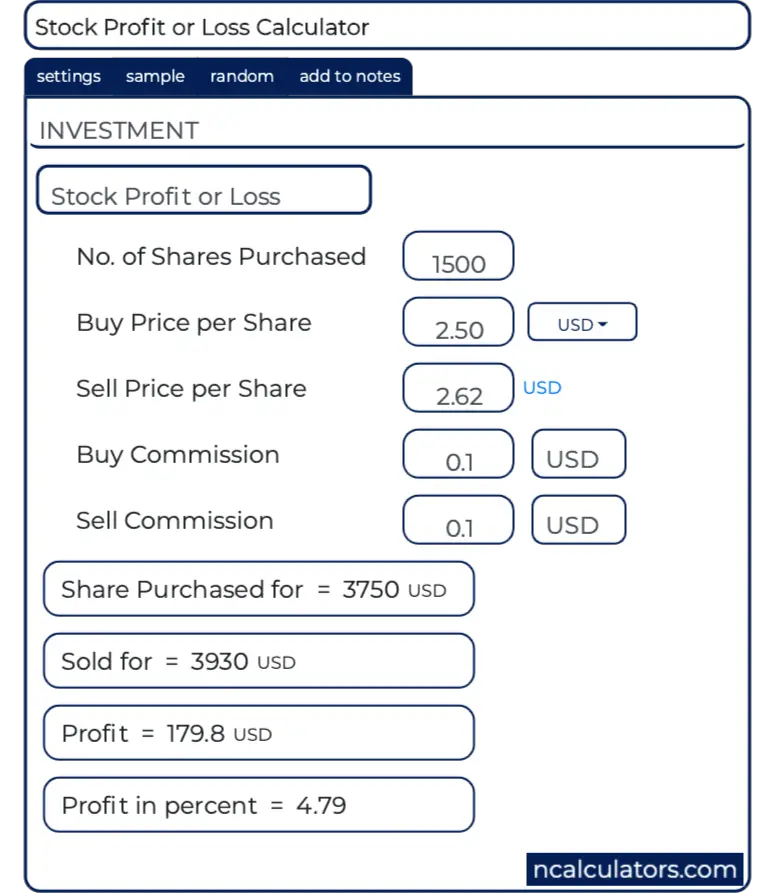
Total Purchase Cost = (100 shares * $50/share) + $10 = $5,000 + $10 = $5,010
Adjusted Cost Basis Per Share = $5,010 / 100 shares = $50.10 per share
This $50.10 is your true effective buying price per share.
The Net Profit Formula: Incorporating All Expenses
To calculate your actual take-home profit, you must subtract all costs from your total gross return.
Net Profit = (Selling Price Per Share × Number of Shares) – (Adjusted Cost Basis Per Share × Number of Shares) – Selling Commissions/Fees + Total Dividends Received
Alternatively:
Net Profit = Total Gross Return – Total Buying Costs – Total Selling Costs
Using our example:
- Initial purchase: 100 shares at $50, with a $10 buying commission (Total Buying Cost = $5,010)
- Sale: 100 shares at $65, with a $10 selling commission (Total Selling Proceeds = $6,500 – $10 = $6,490)
- Total Dividends Received: $200 (100 shares * $2/share)
Net Profit = $6,490 (Net Sale Proceeds) – $5,010 (Total Buying Cost) + $200 (Dividends)
Net Profit = $1,480 + $200
Net Profit = $1,680
Notice how the $20 in commissions ($10 buying + $10 selling) reduced the initial $1,700 gross profit (including dividends) down to $1,680 net profit. This seemingly small difference can be significant, especially with frequent trading or large position sizes.
Navigating Tax Implications and Advanced Scenarios
Calculating profit accurately isn’t just about understanding your returns; it’s also about fulfilling your tax obligations. Tax rules can significantly impact your net profit, and certain scenarios require specialized calculation methods.
Short-Term vs. Long-Term Capital Gains
The duration for which you hold an investment before selling determines its tax classification:
- Short-Term Capital Gains: Apply to profits from assets held for one year or less. These gains are typically taxed at your ordinary income tax rate, which can be considerably higher than long-term capital gains rates.
- Long-Term Capital Gains: Apply to profits from assets held for more than one year. These gains are often taxed at preferential, lower rates, making holding investments for longer periods a common strategy for tax efficiency.
Understanding this distinction is crucial for tax planning. Realizing a gain just before the one-year mark versus just after can lead to vastly different tax bills, directly impacting your net profit.
The Wash Sale Rule
The IRS’s wash sale rule is designed to prevent investors from claiming artificial losses for tax purposes. If you sell a security at a loss and then buy substantially identical securities within 30 days before or after the sale, the loss is disallowed for tax purposes in that year. Instead, the disallowed loss is added to the cost basis of the new shares. This rule can complicate loss calculations, as a seemingly realized loss might not be deductible.
Averaging Down/Up and Cost Basis Methods
When you make multiple purchases of the same stock at different prices, determining your cost basis for a partial sale becomes more complex. Common methods include:
- First-In, First-Out (FIFO): Assumes that the first shares you bought are the first shares you sell. This is the default method if you don’t specify otherwise.
- Last-In, First-Out (LIFO): Assumes the last shares bought are the first sold. Less common for individual investors due to tax implications.
- Average Cost: Averages the cost of all shares purchased. Often used for mutual funds but can be applied to stocks.
- Specific Identification: Allows you to choose which specific shares (e.g., those with the highest cost basis to minimize capital gains, or those held for longer for long-term capital gains tax treatment) you are selling. This method offers the most flexibility for tax optimization.
Your brokerage will typically track your cost basis using FIFO by default, but you can usually select a different method (like specific identification) before selling to optimize your tax outcome.
Impact of Stock Splits and Reverse Splits
Stock splits and reverse splits change the number of shares you own and their per-share price, but they do not immediately change the total value of your investment or your overall cost basis.
- Stock Split (e.g., 2-for-1): You receive more shares, and the price per share is proportionally reduced. Your total cost basis remains the same, but it’s now spread across more shares, reducing your cost basis per share.
- Reverse Split (e.g., 1-for-2): You own fewer shares, and the price per share is proportionally increased. Your total cost basis remains the same, but it’s now concentrated on fewer shares, increasing your cost basis per share.
After a split, you must adjust your cost basis per share to accurately calculate profit when you eventually sell. For instance, if you owned 100 shares at a $50 cost basis and there was a 2-for-1 split, you would then own 200 shares with a cost basis of $25 per share.
Practical Application: Examples and Tools for Accurate Calculation
Knowing the formulas is one thing; applying them effectively is another. Practical examples and the right tools can make profit calculation straightforward.
Step-by-Step Example of a Comprehensive Stock Trade
Let’s bring everything together with a detailed scenario:
-
Initial Purchase: On Jan 15, 2022, you buy 50 shares of Company B at $100/share. Buying commission: $5.
- Total Purchase Cost = (50 * $100) + $5 = $5,005
- Cost Basis Per Share = $5,005 / 50 = $100.10
-
Dividend Received: On Oct 1, 2022, you receive a $1/share dividend.
- Total Dividends = 50 shares * $1 = $50
-
Sale: On Jan 20, 2023, you sell all 50 shares of Company B at $120/share. Selling commission: $5.
- Total Sale Proceeds = (50 * $120) – $5 = $6,000 – $5 = $5,995
-
Calculate Net Profit:
- Capital Gain/Loss = Net Sale Proceeds – Total Purchase Cost = $5,995 – $5,005 = $990
- Total Net Profit = Capital Gain + Total Dividends = $990 + $50 = $1,040
-
Calculate Percentage Return:
- Percentage Return = ($1,040 / $5,005) * 100% = 20.78%
-
Tax Implication: Since the shares were held from Jan 15, 2022, to Jan 20, 2023 (more than one year), the $990 capital gain is a long-term capital gain, subject to preferential tax rates. The $50 in dividends is also taxable income in 2022 (when received).
Utilizing Brokerage Statements and Financial Tools
Most modern brokerage platforms provide detailed statements and reports that greatly simplify profit calculation. These reports typically list:
- Purchase and sale prices.
- Dates of transactions (crucial for short-term vs. long-term classification).
- Commissions and fees.
- Dividends received.
- Cost basis information, often by specific lot or using the FIFO method.
Beyond brokerage reports, several tools can assist:
- Spreadsheet Software (e.g., Microsoft Excel, Google Sheets): Ideal for creating custom trackers, especially for investors with complex portfolios or multiple purchases of the same stock. You can set up formulas to automatically calculate profit, ROI, and track cost basis.
- Online Financial Calculators: Many financial websites offer free calculators for capital gains, percentage returns, and even tax estimates.
- Portfolio Tracking Apps: Dedicated apps can aggregate data from multiple brokerage accounts and provide real-time profit/loss tracking and performance analysis.
By diligently reviewing your brokerage statements and leveraging these tools, you can ensure accuracy and save significant time, particularly during tax season.
Calculating stock profit accurately is a cornerstone of smart investing. It transcends merely seeing a stock price go up; it’s about understanding the true financial impact of your decisions, accounting for every cost, and preparing for your tax obligations. By applying the formulas, acknowledging all associated fees, and understanding tax implications, you empower yourself to make more informed choices, optimize your returns, and build a robust financial future. Investing is a journey of continuous learning, and mastering profit calculation is a crucial step on that path.
aViewFromTheCave is a participant in the Amazon Services LLC Associates Program, an affiliate advertising program designed to provide a means for sites to earn advertising fees by advertising and linking to Amazon.com. Amazon, the Amazon logo, AmazonSupply, and the AmazonSupply logo are trademarks of Amazon.com, Inc. or its affiliates. As an Amazon Associate we earn affiliate commissions from qualifying purchases.