
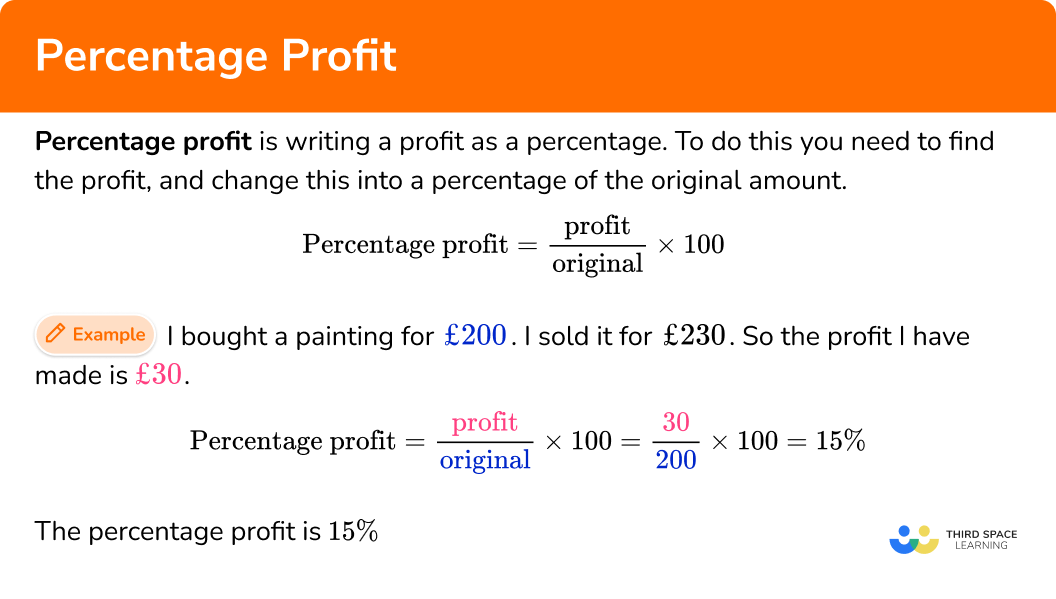
Understanding the financial health of any enterprise hinges significantly on its profitability. While raw profit figures provide a snapshot of monetary gain, the percentage of profit offers a far more insightful and comparative metric. It transforms a static number into a dynamic indicator, revealing efficiency, performance trends, and comparative standing within an industry. For business owners, investors, and even astute consumers, knowing how to calculate and interpret profit percentages is an indispensable skill, illuminating the true earning power behind every sale. This comprehensive guide will demystify the process, providing clear methodologies and practical insights into this fundamental financial calculation.
Understanding the Fundamentals of Profitability
Before diving into calculations, it’s crucial to grasp the basic components that constitute profit. Every business operation, from a multinational corporation to a solo entrepreneur, generates revenue and incurs costs. The interplay between these two elements ultimately determines profitability.
Defining Key Terms
To accurately calculate profit percentages, we must first establish a common understanding of the financial terms involved:
-
Revenue (or Sales): This is the total income generated from the sale of goods or services before any expenses are deducted. It represents the top-line figure on an income statement.
-
Cost of Goods Sold (COGS): Directly attributable to the production of goods sold by a company. This includes the cost of materials, direct labor, and manufacturing overheads. For service-based businesses, this might be called Cost of Services and include direct labor and materials.
-
Gross Profit: This is the profit a company makes after deducting the costs associated with making and selling its products, or the costs associated with providing its services. It’s calculated as Revenue – COGS.
-
Operating Expenses: These are the costs incurred by a business through its normal operations, not directly tied to production. Examples include administrative salaries, rent, utilities, marketing, and research and development. Also known as Selling, General, and Administrative (SG&A) expenses.
-
Operating Profit (or EBIT – Earnings Before Interest and Taxes): This represents the profit generated from a company’s core operations before accounting for interest and income taxes. It’s calculated as Gross Profit – Operating Expenses.
-
Net Profit (or Net Income): This is the ultimate bottom-line figure, representing the total profit after all expenses, including COGS, operating expenses, interest, and taxes, have been deducted from total revenue. It indicates the actual profit available to shareholders or retained within the business.
The Importance of Profit Metrics
Why go beyond just the dollar amount of profit? Absolute profit figures can be misleading in isolation. A business making $1 million in profit sounds impressive, but if it required $100 million in revenue to achieve that, its efficiency might be questioned. Conversely, a business making $100,000 in profit from $200,000 in revenue shows remarkable efficiency. Profit percentages provide:
-
Comparability: They allow for a “like-for-like” comparison between businesses of different sizes, or for comparing a business’s performance over different periods, neutralizing the scale effect.
-
Efficiency Measurement: They indicate how effectively a company converts its revenue into various levels of profit, highlighting areas where costs might be too high.
-
Trend Analysis: Tracking profit percentages over time helps identify patterns, improvements, or deteriorating performance.
-
Strategic Planning: They inform decisions about pricing, cost control, investment, and operational changes.
The Core Formulas for Profit Calculation
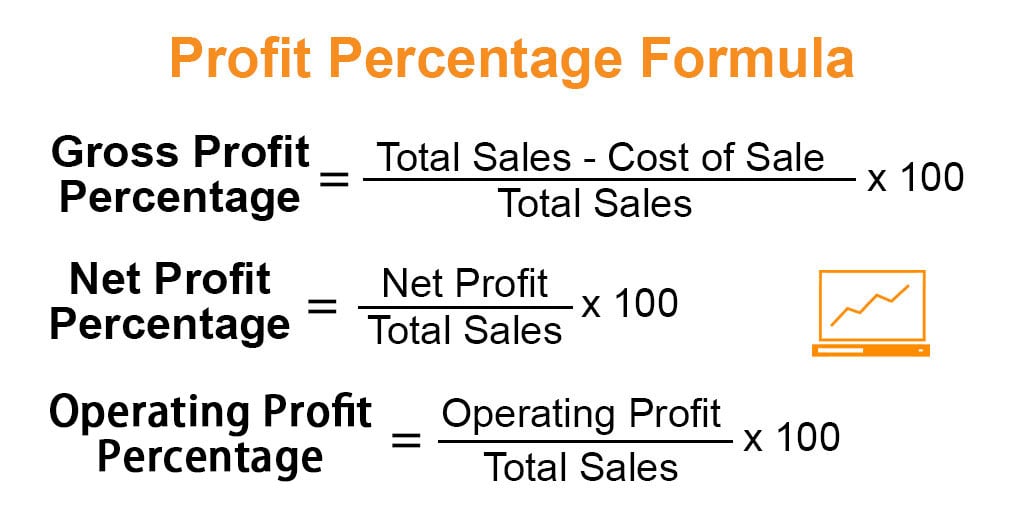
There are three primary profit percentages, each offering a distinct perspective on a company’s financial performance. Understanding and calculating all three provides a holistic view of profitability.
Gross Profit Percentage
The gross profit percentage, also known as gross profit margin, measures the percentage of revenue that exceeds the cost of goods sold. It indicates how efficiently a company manages its production costs.
Formula:
Gross Profit Percentage = (Gross Profit / Revenue) × 100
Or, more directly:
Gross Profit Percentage = ((Revenue - Cost of Goods Sold) / Revenue) × 100
Significance: A higher gross profit percentage suggests that a company is effectively controlling its direct production costs relative to its sales price. It’s a critical metric for manufacturing and retail businesses, indicating pricing power and production efficiency. A declining gross margin could signal rising raw material costs, inefficient production, or aggressive pricing strategies that erode profitability.
Operating Profit Percentage
The operating profit percentage, or operating profit margin, reveals how much profit a company makes from its core operations before accounting for interest and taxes. It reflects the efficiency of a company’s management in controlling both production costs and operating expenses.
Formula:
Operating Profit Percentage = (Operating Profit / Revenue) × 100
Or, expanded:
Operating Profit Percentage = ((Gross Profit - Operating Expenses) / Revenue) × 100
Significance: This metric is highly valued because it focuses purely on the operational efficiency of the business, isolating the impact of financing decisions (interest) and tax structures. A strong operating profit margin indicates effective management of day-to-day business costs, from sales and marketing to administrative overhead. It helps assess the sustainability of a business’s core activities.
Net Profit Percentage
The net profit percentage, or net profit margin, is the most comprehensive measure, indicating the percentage of revenue left after all expenses, including COGS, operating expenses, interest, and taxes, have been deducted. It represents the ultimate profitability of the business.
Formula:
Net Profit Percentage = (Net Profit / Revenue) × 100
Significance: This is often considered the “bottom line” profit percentage, showing how much of each dollar of revenue translates into actual earnings for the company’s owners or shareholders. It’s a crucial indicator of overall financial health and efficiency. A healthy net profit margin is essential for a business’s long-term sustainability, allowing for reinvestment, debt repayment, and shareholder returns.
Step-by-Step Guide to Calculating Profit Percentages
Let’s walk through an example to illustrate how to calculate these profit percentages using a hypothetical business scenario.
Gathering Your Financial Data
To perform these calculations, you’ll need access to a company’s income statement (also known as a profit and loss statement). For our example, let’s assume “Innovative Solutions Inc.” has the following figures for the last fiscal year:
-
Revenue: $1,500,000
-
Cost of Goods Sold (COGS): $750,000
-
Operating Expenses: $350,000
-
Interest Expense: $20,000
-
Taxes: $90,000
Applying the Formulas with Examples
Now, let’s calculate the various profit percentages for Innovative Solutions Inc.:
1. Calculate Gross Profit Percentage:
-
Step 1: Calculate Gross Profit.
Gross Profit = Revenue - COGSGross Profit = $1,500,000 - $750,000 = $750,000 -
Step 2: Apply the Gross Profit Percentage Formula.
Gross Profit Percentage = (Gross Profit / Revenue) × 100Gross Profit Percentage = ($750,000 / $1,500,000) × 100Gross Profit Percentage = 0.50 × 100 = 50%Interpretation: Innovative Solutions Inc. retains 50 cents of every dollar of revenue after covering its direct production costs.
2. Calculate Operating Profit Percentage:
-
Step 1: Calculate Operating Profit.
Operating Profit = Gross Profit - Operating ExpensesOperating Profit = $750,000 - $350,000 = $400,000 -
Step 2: Apply the Operating Profit Percentage Formula.
Operating Profit Percentage = (Operating Profit / Revenue) × 100Operating Profit Percentage = ($400,000 / $1,500,000) × 100Operating Profit Percentage = 0.2667 × 100 ≈ 26.67%Interpretation: The company generates approximately 26.67 cents of profit from its core operations for every dollar of revenue, before interest and taxes.
3. Calculate Net Profit Percentage:
-
Step 1: Calculate Net Profit.
First, find Profit Before Tax:
Profit Before Tax = Operating Profit - Interest ExpenseProfit Before Tax = $400,000 - $20,000 = $380,000Then, find Net Profit:
Net Profit = Profit Before Tax - TaxesNet Profit = $380,000 - $90,000 = $290,000 -
Step 2: Apply the Net Profit Percentage Formula.
Net Profit Percentage = (Net Profit / Revenue) × 100Net Profit Percentage = ($290,000 / $1,500,000) × 100Net Profit Percentage = 0.1933 × 100 ≈ 19.33%Interpretation: After all expenses, including production, operations, interest, and taxes, Innovative Solutions Inc. earns approximately 19.33 cents for every dollar of revenue.
Interpreting and Utilizing Profit Percentages
Calculating these percentages is only the first step. The real value lies in their interpretation and application for strategic decision-making.
Benchmarking and Industry Comparisons
The calculated profit percentages gain significant meaning when compared against benchmarks.
-
Historical Performance: Compare current percentages to previous periods (quarter-over-quarter, year-over-year) to identify trends. Is profitability improving or declining?
-
Industry Averages: How do your margins stack up against competitors or industry averages? If your gross margin is lower, it might suggest pricing issues or inefficient production. If your operating margin is lower, perhaps your administrative or marketing costs are too high. Industry benchmarks are often available from financial data providers or industry associations.
-
Goals and Targets: Are you meeting your internal financial targets? Profit percentages provide clear metrics to track progress towards strategic financial objectives.
Identifying Areas for Improvement
Analyzing each layer of profit margin can pinpoint specific areas for improvement:
-
Low Gross Margin: Could indicate issues with supplier costs (negotiate better deals), production efficiency (streamline processes, reduce waste), or pricing strategy (consider price increases if market allows).
-
Low Operating Margin (but healthy Gross Margin): Suggests problems with controlling operating expenses. This could mean excessive marketing spend, high administrative overheads, or inefficient sales processes. Reviewing each line item of SG&A is crucial.
-
Low Net Margin (but healthy Operating Margin): This often points to high interest expenses (perhaps high debt levels or unfavorable loan terms) or a heavy tax burden. While taxes are often fixed, managing debt and optimizing capital structure can improve this.
Strategic Decision Making
Profit percentages are invaluable tools for guiding major business decisions:
-
Pricing Strategy: Understanding your gross margin helps set competitive yet profitable prices.
-
Cost Control Initiatives: Detailed analysis of operating margins can justify investments in automation, renegotiation of leases, or optimization of staffing levels.
-
Investment Decisions: For investors, consistent and healthy profit margins are a strong indicator of a well-managed, financially sound company worthy of investment. For businesses, strong margins can indicate capacity for growth and self-funding.
-
Operational Efficiency: Identifying bottlenecks or inefficiencies that reduce any of the profit margins can lead to operational overhauls, supply chain optimizations, or technology adoptions.
Common Pitfalls and Advanced Considerations
While powerful, profit percentages should be used with a nuanced understanding of their limitations and context.
The Impact of Non-Recurring Items
Income statements can sometimes include one-off gains or losses (e.g., sale of an asset, restructuring costs, legal settlements). These “non-recurring items” can artificially inflate or depress profit percentages for a single period, making year-over-year comparisons less reliable without adjustment. It’s often insightful to calculate “normalized” profit percentages that exclude such extraordinary items for a clearer view of core operational performance.
The Role of Accrual vs. Cash Basis Accounting
Most businesses use accrual accounting, which recognizes revenues when earned and expenses when incurred, regardless of when cash is exchanged. This provides a more accurate picture of profitability over a period but doesn’t necessarily reflect cash flow. While profit percentages are based on accrual figures, understanding a company’s cash flow (via the cash flow statement) is also vital for a complete financial assessment, as a profitable company can still face liquidity issues.
Beyond Simple Percentages
While gross, operating, and net profit percentages are foundational, other related metrics offer further insights into profitability and efficiency. Return on Investment (ROI), Return on Equity (ROE), and Earnings Per Share (EPS) are examples of advanced profitability ratios that build upon these core percentages, offering perspectives on how effectively capital and equity are being utilized to generate returns. These go beyond the immediate scope of revenue-to-profit conversion but are often considered in conjunction for a holistic financial analysis.

Conclusion
Calculating the percentage of profit is far more than a simple accounting exercise; it is an essential diagnostic tool for assessing and enhancing financial performance. By meticulously calculating gross, operating, and net profit percentages, businesses and investors gain invaluable insights into operational efficiency, pricing power, and overall financial health. These metrics enable meaningful comparisons, pinpoint areas for strategic improvement, and ultimately inform decisions that drive sustainable growth and long-term success in an ever-competitive marketplace. Mastering these calculations is a fundamental step toward financial literacy and strategic business acumen.
aViewFromTheCave is a participant in the Amazon Services LLC Associates Program, an affiliate advertising program designed to provide a means for sites to earn advertising fees by advertising and linking to Amazon.com. Amazon, the Amazon logo, AmazonSupply, and the AmazonSupply logo are trademarks of Amazon.com, Inc. or its affiliates. As an Amazon Associate we earn affiliate commissions from qualifying purchases.