
In the vast and intricate world of finance, few concepts are as ubiquitous and fundamental as percentages. From personal budgeting and understanding investment returns to analyzing market share and business profitability, percentages serve as the universal language for comparing values, expressing change, and making informed decisions. While the calculation itself is straightforward, mastering the art of deriving a percentage from two numbers unlocks a deeper, more nuanced comprehension of financial dynamics that empowers individuals and businesses alike.
This guide will demystify the process of calculating percentages, grounding each explanation and example firmly within the context of money. By the end, you’ll not only be adept at the calculation but also appreciate its profound relevance across all facets of your financial life, transforming what might seem like a simple mathematical exercise into an indispensable financial superpower.
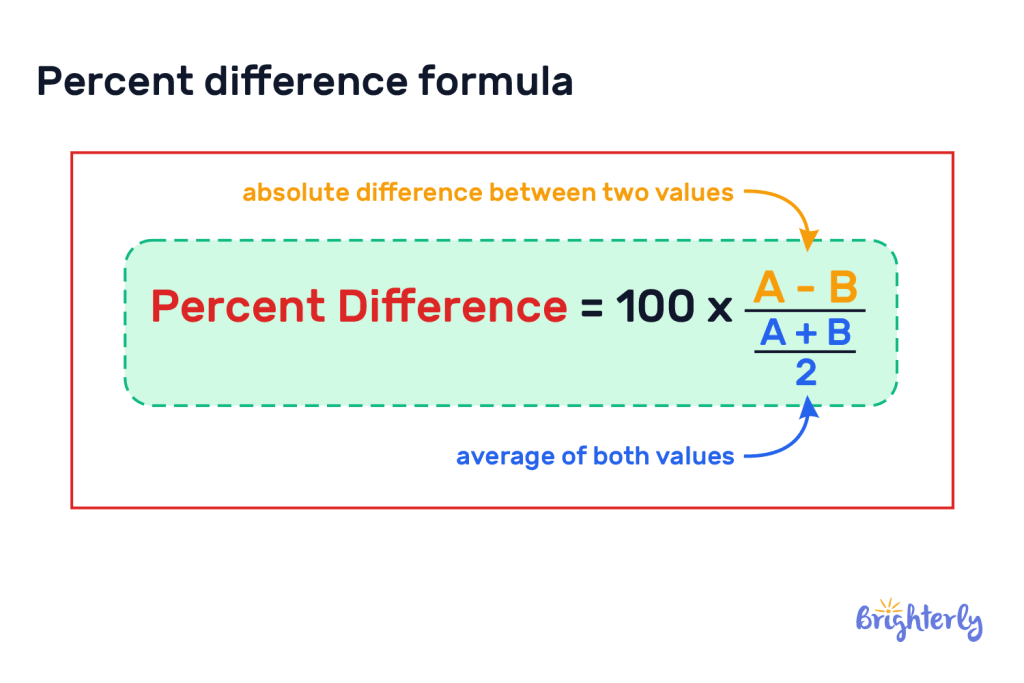
The Foundational Formula: Understanding Percentage Basics
At its core, a percentage is simply a way of expressing a number as a fraction of 100. The term “percent” literally means “per hundred.” When you calculate a percentage from two numbers, you’re essentially determining what proportion one number represents relative to another, scaled to a base of 100. This scaling makes comparisons intuitive and standardized, regardless of the absolute magnitudes of the original numbers.
The fundamental formula to calculate a percentage from two numbers is elegantly simple:
$$ text{Percentage} = left( frac{text{Part}}{text{Whole}} right) times 100 $$
Let’s deconstruct this formula to understand its components and their financial implications.
Deconstructing the Formula: Part, Whole, and Scaling
To apply the percentage formula effectively in financial scenarios, it’s crucial to correctly identify the ‘Part’ and the ‘Whole’ within any given problem:
-
The ‘Part’: This is the specific amount or quantity you are interested in or want to express as a proportion of the total. In financial terms, this could be the amount of interest paid, the discount received, the profit earned, or the spending on a particular budget category. It’s the subset of the total that you are focusing on.
-
The ‘Whole’: This represents the total, original, or reference amount. It’s the base against which the ‘Part’ is being compared. Financially, this often refers to your total income, the original price of an item, your initial investment, total revenue, or the total market size. The ‘Whole’ provides the context for the ‘Part’.
-
The Multiplication by 100: Once you divide the ‘Part’ by the ‘Whole’, you get a decimal or a fraction. Multiplying this result by 100 converts that decimal into its percentage equivalent. This step is what makes the proportion easily interpretable as “out of 100.” For instance, 0.25 becomes 25%, meaning 25 out of every 100 units.
Step-by-Step Calculation Guide with Financial Examples
Let’s walk through the process with a couple of basic financial examples:
Example 1: Calculating a Tip
You had a meal that cost $60, and you want to leave a $12 tip. What percentage of the meal cost is the tip?
- Identify the ‘Part’: The tip amount, which is $12.
- Identify the ‘Whole’: The total meal cost, which is $60.
- Divide ‘Part’ by ‘Whole’: $12 / $60 = 0.2
- Multiply by 100: 0.2 * 100 = 20
- Add the percentage symbol: 20%
- Interpretation: Your tip is 20% of the meal cost.
Example 2: Understanding a Simple Discount
A pair of shoes originally priced at $80 is on sale for $64. What percentage discount are you getting?
- Calculate the discount amount (the ‘Part’): Original Price – Sale Price = $80 – $64 = $16.
- Identify the ‘Whole’: The original price, which is $80.
- Divide ‘Part’ by ‘Whole’: $16 / $80 = 0.2
- Multiply by 100: 0.2 * 100 = 20
- Add the percentage symbol: 20%
- Interpretation: You are getting a 20% discount on the shoes.
These fundamental steps form the basis for all percentage calculations, regardless of their complexity in a financial context.
Practical Applications in Personal Finance
Percentages are not just abstract numbers; they are the bedrock of sound personal financial management. From meticulously crafting a budget to strategically tackling debt, understanding how to calculate and interpret percentages allows you to gain unprecedented clarity into your financial health and future.
Budgeting and Expense Tracking
One of the most immediate and impactful applications of percentage calculations in personal finance is budgeting. By expressing your expenses as a percentage of your income, you gain a clear picture of how your money is allocated and where potential savings can be found.
Example: Analyzing Your Spending
Suppose your net monthly income is $4,000. Last month, you spent $1,200 on rent, $600 on groceries, and $400 on entertainment.
-
Rent as a percentage of income: ($1,200 / $4,000) * 100 = 30%
-
Groceries as a percentage of income: ($600 / $4,000) * 100 = 15%
-
Entertainment as a percentage of income: ($400 / $4,000) * 100 = 10%
-
Insight: This breakdown helps you adhere to budgeting rules (e.g., the 50/30/20 rule) and identify if a particular category is consuming an disproportionately large portion of your income, signaling an area for potential adjustment.
Understanding Discounts and Sales
Shopping smart often involves evaluating discounts. Percentages enable you to quickly grasp the true value of a sale.
Example: Comparing Sale Prices
You want to buy a new appliance. Store A offers 25% off an item originally priced at $800. Store B offers a $200 discount on the same item, originally priced at $900. Which is the better deal?
-
Store A Discount: 25% of $800 = 0.25 * $800 = $200. Final price: $800 – $200 = $600.
-
Store B Discount (in percentage): ($200 / $900) * 100 = 22.22% (approx). Final price: $900 – $200 = $700.
-
Insight: While Store B’s absolute discount amount might seem appealing, calculating the percentage reveals that Store A offers a better overall deal (25% vs. 22.22%) and a lower final price.
Debt Management and Interest Rates
Understanding interest rates, which are almost always expressed as percentages, is paramount for managing debt effectively.
Example: Credit Card Interest
You have a credit card balance of $1,500. Over a billing cycle, you are charged $22.50 in interest. What is your effective interest rate for that period?
-
Interest Rate: ($22.50 / $1,500) * 100 = 1.5%
-
Insight: If this is a monthly rate, multiplying by 12 would give you an Annual Percentage Rate (APR) of 18%, a critical number for comparing credit card offers and understanding the true cost of borrowing.
Percentages in Investing and Wealth Building
Moving beyond day-to-day finances, percentages become even more critical in the realm of investing. They are the primary metrics used to evaluate investment performance, assess risk, and strategically allocate assets to build wealth over time.
Return on Investment (ROI)
ROI is arguably the most fundamental metric for evaluating the profitability of any investment. It’s almost always expressed as a percentage, allowing for easy comparison across diverse investment types.
Formula:
$$ text{ROI} = left( frac{text{Current Value} – text{Initial Investment}}{text{Initial Investment}} right) times 100 $$
Example: Stock Investment
You bought 100 shares of a company for $50 each, totaling an initial investment of $5,000. After a year, the shares are worth $65 each, making your current investment value $6,500.
-
ROI: (($6,500 – $5,000) / $5,000) * 100 = ($1,500 / $5,000) * 100 = 30%
-
Insight: A 30% ROI in a year is a strong return, providing a clear benchmark against other investment opportunities or market averages.

Portfolio Allocation
Wise investors diversify their assets, and percentages are essential for structuring and maintaining a balanced investment portfolio.
Example: Asset Allocation
Your total investment portfolio is worth $250,000. Of this, $150,000 is in stocks, $75,000 is in bonds, and $25,000 is in real estate.
-
Stocks: ($150,000 / $250,000) * 100 = 60%
-
Bonds: ($75,000 / $250,000) * 100 = 30%
-
Real Estate: ($25,000 / $250,000) * 100 = 10%
-
Insight: This breakdown immediately shows your risk exposure. A 60% allocation to stocks generally suggests a moderate-to-aggressive risk profile. Regular rebalancing based on these percentages helps maintain your desired risk/return balance.
Compound Interest and Growth
While calculating the final value of compound interest involves more complex formulas, understanding the underlying percentage growth rate per period is crucial. The magic of compounding lies in these repeated percentage gains.
Example: Annual Growth Rate
If your investment grows from $10,000 to $10,500 in one year, your annual growth rate (percentage increase) is:
-
Growth Rate: (($10,500 – $10,000) / $10,000) * 100 = 5%
-
Insight: Even seemingly small percentages like 5% can lead to substantial wealth accumulation over long periods due to compounding, demonstrating the power of consistent positive returns.
Business Finance and Profitability Metrics
For businesses, percentages are not merely useful; they are vital for assessing performance, strategizing for growth, and making critical operational decisions. They provide a standardized way to compare financial health across different periods, departments, or even competitors.
Profit Margins (Gross and Net)
Profitability is at the heart of any business, and profit margins, expressed as percentages, are key indicators of a company’s efficiency.
-
Gross Profit Margin: This shows the percentage of revenue left after deducting the cost of goods sold (COGS). It reflects operational efficiency in production.
- Formula: $$ left( frac{text{Revenue} – text{COGS}}{text{Revenue}} right) times 100 $$
- Example: If a company has $1,000,000 in revenue and $600,000 in COGS, its Gross Profit Margin is (($1,000,000 – $600,000) / $1,000,000) * 100 = 40%.
-
Net Profit Margin: This shows the percentage of revenue remaining after all expenses, including taxes and interest, have been deducted. It’s the ultimate measure of a company’s overall profitability.
- Formula: $$ left( frac{text{Net Income}}{text{Revenue}} right) times 100 $$
- Example: If the same company has a net income of $150,000, its Net Profit Margin is ($150,000 / $1,000,000) * 100 = 15%.
-
Insight: A healthy profit margin indicates efficient management and a sustainable business model. Businesses constantly strive to improve these percentages.
Market Share Analysis
Understanding a company’s market share—its proportion of the total sales in an industry—is crucial for strategic planning and competitive analysis.
Example: Industry Dominance
In a total market worth $50 million annually, Company X generates $12 million in sales.
-
Market Share: ($12,000,000 / $50,000,000) * 100 = 24%
-
Insight: Knowing its 24% market share, Company X can set goals to increase this percentage, analyze competitors’ shares, and adapt its marketing and sales strategies accordingly.
Expense Ratios and Operational Efficiency
Businesses use percentages to analyze individual expenses relative to revenue or total expenses, identifying areas for cost reduction and efficiency improvements.
Example: Marketing Spend
A company spends $50,000 on marketing in a quarter, generating $500,000 in revenue.
-
Marketing Expense Ratio: ($50,000 / $500,000) * 100 = 10%
-
Insight: If the industry average for marketing expenses is 8%, this 10% ratio might signal that the company is overspending on marketing or that its campaigns aren’t as efficient as they could be, prompting a review.
Common Pitfalls and Advanced Considerations
While the basic percentage calculation is straightforward, financial contexts often introduce nuances that can lead to misinterpretations if not handled carefully.
Percentage Points vs. Percentage Change
This is a common source of confusion, especially in financial news and reports.
- Percentage Points: Refers to the absolute difference between two percentages.
- Example: If an interest rate increases from 5% to 7%, that’s an increase of 2 percentage points.
- Percentage Change: Refers to the relative change in the percentage itself.
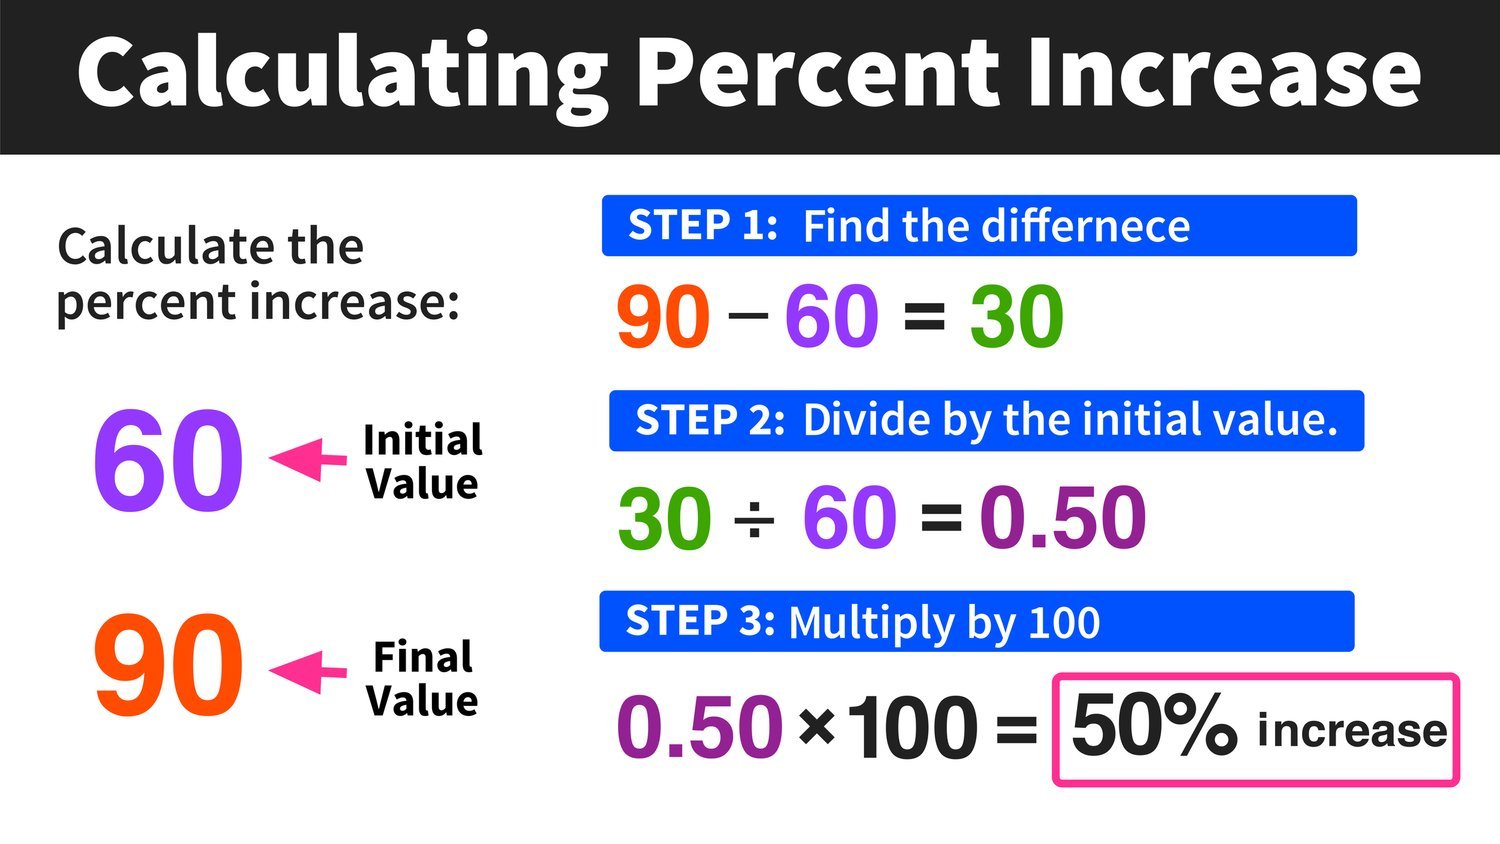
- Example: An increase from 5% to 7% is a ((7 – 5) / 5) * 100 = 40% percentage change.
It’s crucial to distinguish between these two to avoid misrepresenting financial shifts. A 2 percentage point increase in interest rates sounds less dramatic than a 40% increase, but both are accurate descriptions of the same event when used correctly.
Base Value Changes
Percentages can also be misleading if the base value (the ‘Whole’) changes between calculations.
Example: Investment Volatility
You invest $1,000. In Year 1, your investment decreases by 10%. In Year 2, it increases by 10%. Do you have your original $1,000?
-
After Year 1: $1,000 – (10% of $1,000) = $1,000 – $100 = $900.
-
After Year 2: $900 + (10% of $900) = $900 + $90 = $990.
-
Insight: You end up with $990, not $1,000. This is because the base for the 10% increase in Year 2 was $900, not the original $1,000. Always be mindful of the base against which percentages are applied.
Using Financial Tools
While understanding the manual calculation is paramount, in today’s digital age, leverage financial tools for efficiency and accuracy in complex scenarios:
- Calculators: Basic calculators handle simple percentage operations with ease.
- Spreadsheets (Excel/Google Sheets): Incredibly powerful for financial modeling, budgeting, and investment tracking. Formulas can automate complex percentage calculations across large datasets.
- Financial Software: Specialized tools often include built-in calculators for loans, mortgages, ROI, and more.
These tools augment your understanding, allowing you to focus on interpreting the results rather than just the mechanics of calculation.
Conclusion
The ability to calculate a percentage from two numbers is far more than a simple arithmetic skill; it is an indispensable tool that forms the very backbone of financial literacy. From meticulously managing your personal budget and making savvy purchasing decisions to evaluating complex investment opportunities and dissecting business performance, percentages provide the clarity, comparability, and insight necessary to navigate the financial landscape effectively.
By mastering the foundational formula, understanding the nuances of ‘part’ and ‘whole’ in various financial contexts, and being aware of common pitfalls, you equip yourself with the power to translate raw numbers into meaningful financial intelligence. Embrace this fundamental skill, and you will undoubtedly make more informed, strategic, and ultimately more successful financial decisions throughout your life, empowering your journey towards financial well-being and prosperity. Start applying these calculations to your own finances today, and unlock a deeper understanding of your money.
aViewFromTheCave is a participant in the Amazon Services LLC Associates Program, an affiliate advertising program designed to provide a means for sites to earn advertising fees by advertising and linking to Amazon.com. Amazon, the Amazon logo, AmazonSupply, and the AmazonSupply logo are trademarks of Amazon.com, Inc. or its affiliates. As an Amazon Associate we earn affiliate commissions from qualifying purchases.