In the world of finance, numbers are the primary language of progress, risk, and stability. Whether you are tracking the performance of a stock portfolio, managing a corporate budget, or trying to reduce your monthly household expenses, the ability to quantify change is essential. Among the various mathematical tools at a financier’s disposal, the calculation of percentage decrease is perhaps one of the most vital. It provides the necessary context to raw data, allowing you to understand the magnitude of a loss, the effectiveness of a cost-saving measure, or the volatility of an asset.

Understanding percentage decrease is not merely an academic exercise; it is a fundamental skill for anyone looking to achieve financial literacy. In this guide, we will explore the core formula for calculating percentage decrease, its critical applications in personal and business finance, and the strategic implications of these figures in investment analysis.
The Fundamental Formula: Why Percentage Decrease Matters in Money Management
At its simplest level, a percentage decrease measures the relationship between a starting value and a final, lower value, expressed as a fraction of 100. In finance, we rarely care about the absolute dollar amount in isolation. For instance, a $1,000 drop in value means something very different for a $2,000 account than it does for a $1,000,000 account. Percentage decrease provides the scale necessary for informed decision-making.
Defining the Core Formula
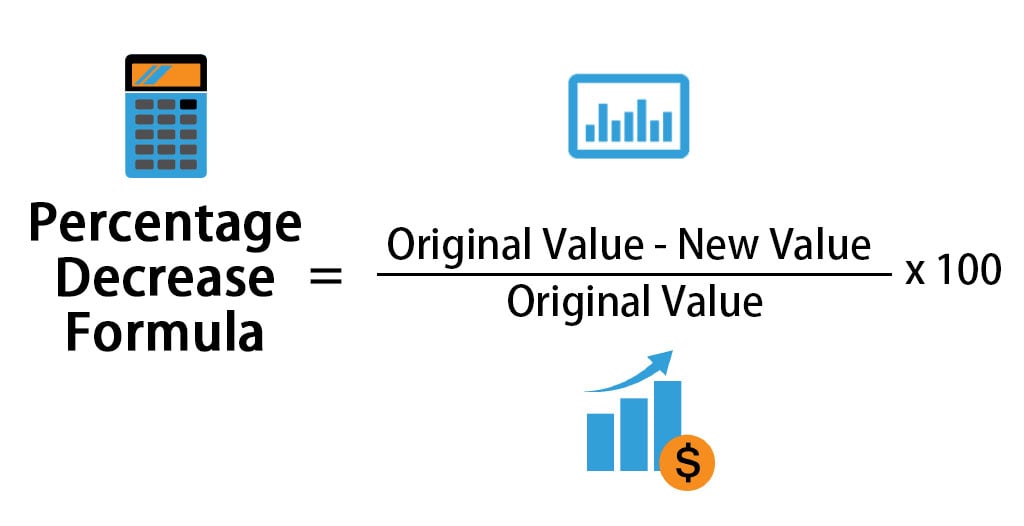
To calculate the percentage decrease, you follow a straightforward three-step process. First, determine the difference between the original value and the new value. Second, divide that difference by the original value. Finally, multiply the result by 100 to convert it into a percentage.
The mathematical formula is expressed as:
Percentage Decrease = [(Original Value – New Value) / Original Value] × 100
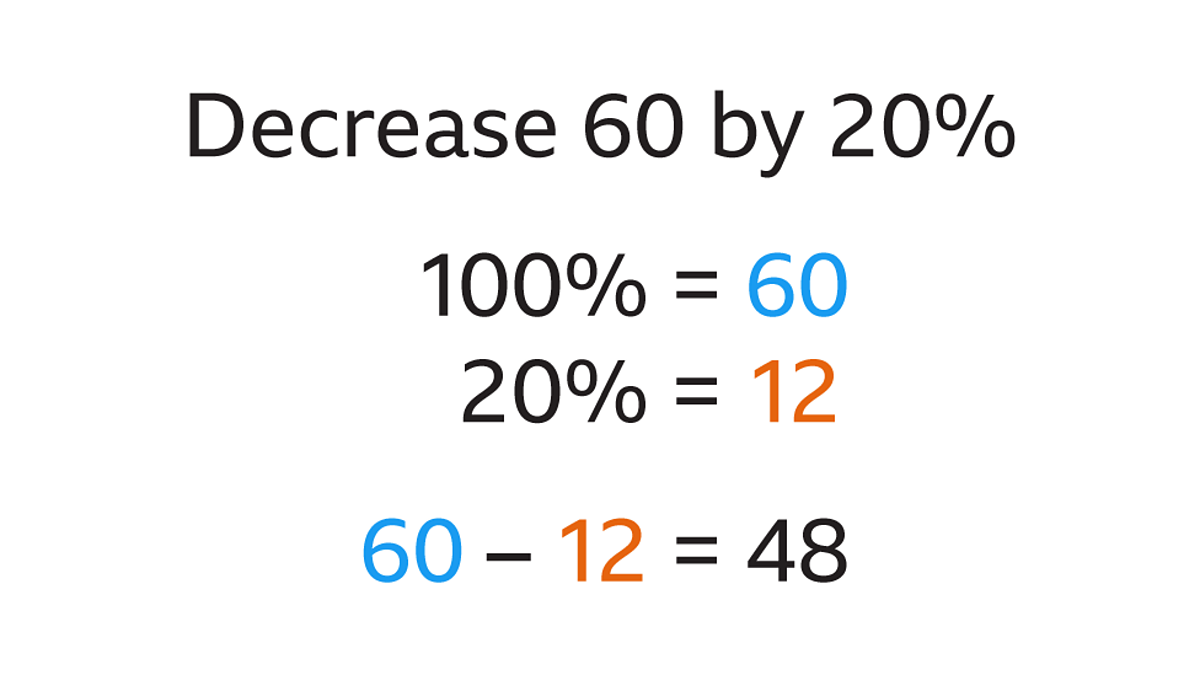
For example, if you were analyzing a utility bill that dropped from $200 last month to $160 this month, the calculation would look like this:
- $200 – $160 = $40 (The absolute decrease)
- $40 / $200 = 0.2
- 0.2 × 100 = 20%
In this scenario, you successfully achieved a 20% reduction in your utility costs—a significant metric for any budget-conscious individual.
Understanding the Psychological Impact of Financial Losses
In behavioral finance, the concept of percentage decrease is tied closely to “loss aversion.” Research suggests that the pain of a financial loss is psychologically twice as powerful as the joy of an equivalent gain. When an investor sees a 10% decrease in their portfolio, it often triggers an emotional response that raw numbers do not. By mastering the calculation, you can strip away the emotion and view the data objectively. Is a 5% dip a market correction or a reason to exit a position? Without the percentage, you are simply guessing; with it, you are analyzing.
Practical Applications in Personal Finance
For the individual consumer, the percentage decrease is a tool for optimization. It is the primary metric used to evaluate the success of a “frugal living” plan or a debt repayment strategy. When you can quantify your progress, you are more likely to stay committed to your long-term financial goals.
Tracking Expense Reduction and Budgeting
When performing a monthly or quarterly budget review, the goal is often to see a percentage decrease in “non-discretionary” or “wasteful” spending categories. If you decide to cut back on dining out, tracking the dollar amount is helpful, but the percentage decrease tells you how much of your lifestyle has actually shifted.
If your “Dining Out” category went from $500 to $350, that is a 30% decrease. This figure allows you to compare different categories of your life on an even playing field. You might find that while you saved $150 on food, you only saved 5% on your total expenses. This insight might lead you to realize that larger fixed costs, like insurance or subscriptions, need a more aggressive reduction strategy.
Analyzing Consumer Price Changes and Inflation
While we often talk about inflation as a percentage increase, savvy consumers look for percentage decreases in specific commodity cycles to time their purchases. For example, if the price of a specific technology or a bulk grocery item decreases during a seasonal sale, calculating the percentage decrease helps you determine the true value of the “deal.” Retailers often use “Sale” tags to lure customers, but calculating the actual percentage decrease yourself ensures that the discount is significant enough to warrant the expenditure.
Investment Analysis: Measuring Market Corrections and Portfolio Volatility
In the realm of investing, percentage decrease takes on a more serious tone. It is the standard metric for measuring “drawdowns”—the peak-to-trough decline during a specific record period of an investment or fund. Understanding how to calculate and interpret these decreases is the difference between a panicked amateur and a seasoned professional.
Calculating Drawdowns in Your Portfolio
A drawdown is usually quoted as the percentage between the peak (the highest value the portfolio reached) and the subsequent trough (the lowest point before a new peak is achieved). If your retirement account hit a high of $500,000 and subsequently dropped to $425,000 during a market downturn, you have experienced a 15% drawdown.
Financial advisors use this percentage to determine an investor’s risk tolerance. If a 15% decrease causes you to lose sleep, your portfolio may be too aggressively weighted in equities. By calculating the percentage decrease during various market cycles, you can rebalance your assets to ensure your “downside risk” aligns with your emotional and financial capacity.
The “Recovery Gap”: Why a 20% Loss Requires More Than a 20% Gain
Perhaps the most crucial lesson in financial mathematics is the asymmetry of percentage changes. This is often where investors get trapped. If an asset decreases by 50%, it does not need a 50% increase to return to its original value; it needs a 100% increase.
Let’s look at the math:
- Original Value: $100
- 50% Decrease: $50
- To get from $50 back to $100, you need to add $50.
- $50 is 100% of your current $50 value.
This “recovery gap” highlights why managing percentage decreases is more important than chasing high percentage gains. Protecting your capital and minimizing the percentage of your losses is the cornerstone of sustainable wealth building.
Business Finance: Assessing Operational Efficiency and Revenue Dips
For business owners and financial officers, percentage decrease is a Key Performance Indicator (KPI) used to measure efficiency and organizational health. In a corporate setting, a decrease is not always a negative; in fact, a decrease in “overhead” or “waste” is a primary goal of any lean management strategy.
Monitoring Cost of Goods Sold (COGS)
One of the most effective ways to increase a company’s net profit margin is to decrease the Cost of Goods Sold (COGS). If a manufacturer finds a new supplier that reduces the cost of raw materials from $10.00 per unit to $8.50 per unit, they have achieved a 15% decrease in production costs. When scaled across 100,000 units, this 15% decrease transforms the company’s bottom line, providing extra capital for R&D or marketing.
Analyzing Seasonal Sales Fluctuations
Businesses rarely experience linear growth. Most industries are subject to seasonality. A retail business might see a significant percentage decrease in sales during February compared to December. By calculating this decrease year-over-year (comparing this February to last February), management can determine if the dip is a standard seasonal trend or a sign of a larger systemic problem. If sales decreased by 10% last February but decreased by 25% this February, the business knows it needs to investigate market shifts, competitor actions, or internal failings.
Tools and Strategies for Automating Your Financial Calculations
While knowing the formula is essential, modern finance relies on automation to track these percentages in real-time. Manually calculating every price shift is inefficient when software can provide instant insights.
Using Excel and Google Sheets for Real-Time Monitoring
For those who manage their own finances or small business books, spreadsheets are the ultimate tool. You can set up a simple formula to track percentage decreases automatically. In Excel, if your original value is in cell A1 and your new value is in cell B1, the formula would be =(A1-B1)/A1. By formatting the cell as a “Percentage,” you get an instant view of the change.
Professional traders and CFOs use these formulas to create “dashboards” that highlight any asset or department that has decreased beyond a certain threshold (e.g., a “red flag” for any expense that hasn’t decreased by at least 5% annually).
Leveraging Financial Apps for Net Worth Tracking
In the fintech era, apps like Mint, YNAB, or Empower (formerly Personal Capital) do the heavy lifting for you. These tools connect to your bank accounts and investment portfolios to provide a visual representation of percentage changes. They allow you to see a 2% decrease in your net worth or a 10% decrease in your monthly spending at a glance.
However, the “insight” part of the professional tone we are aiming for comes from understanding the why behind these automated numbers. An app can tell you there was a 10% decrease, but only a person with a solid grasp of financial percentage calculations can determine if that decrease represents a successful budget cut or a concerning loss of dividend income.
Conclusion
Calculating percentage decrease is more than a arithmetic trick; it is a vital lens through which we view financial health. In personal finance, it empowers the saver to see the impact of their frugality. In investing, it warns the trader of the “recovery gap” and the dangers of high volatility. In business, it serves as a metric for efficiency and a safeguard against operational bloat. By mastering this simple calculation, you move from being a passive observer of your money to an active, informed manager of your wealth.
aViewFromTheCave is a participant in the Amazon Services LLC Associates Program, an affiliate advertising program designed to provide a means for sites to earn advertising fees by advertising and linking to Amazon.com. Amazon, the Amazon logo, AmazonSupply, and the AmazonSupply logo are trademarks of Amazon.com, Inc. or its affiliates. As an Amazon Associate we earn affiliate commissions from qualifying purchases.